

Fructosyl peptide oxidases from Coniochaeta sp. and E. terrenum were crystallized by the sitting-drop vapour-diffusion method. The crystals diffracted to 1.8 and 1.6 Å resolution, respectively.
Keywords: fructosyl peptide oxidase, haemoglobin A1c, diagnosis of diabetes, Coniochaeta sp., Eupenicillium terrenum
Abstract
Fructosyl peptide oxidase (FPOX) catalyses the oxidation of α-glycated dipeptides such as N α-(1-deoxy-d-fructos-1-yl)-l-valyl-l-histidine (Fru-ValHis) and is used in the diagnosis of diabetes mellitus. Here, two thermostable mutants of FPOX, CFP-T7 and EFP-T5M, were crystallized by the sitting-drop vapour-diffusion method. The crystal of CFP-T7 belonged to the tetragonal space group P41212, with unit-cell parameters a = b = 110.09, c = 220.48 Å, and that of EFP-T5M belonged to the monoclinic space group P21, with unit-cell parameters a = 43.00, b = 230.05, c = 47.27 Å, β = 116.99°. The crystals of CFP-T7 and EFP-T5M diffracted to 1.8 and 1.6 Å resolution, respectively.
1. Introduction
Haemoglobin A1c (HbA1c) is the major glycohaemoglobin species in blood cells. The ratio of HbA1c to total haemoglobin is accepted as a very important marker in the diagnosis of diabetes mellitus and the assessment of long-term glycaemic control in diabetes patients (Bunn et al., 1978 ▶; Kobold et al., 1997 ▶). HbA1c is defined as a haemoglobin glycated at the N-terminal valine residue of the β-subunits. In human blood, haemoglobin is readily irreversibly glycated at this valine residue (Shapiro et al., 1980 ▶). Therefore, the ratio of HbA1c to total haemoglobin reflects the average blood glucose level during the past few months (Bunn et al., 1978 ▶). For the routine measurement of HbA1c, methods such as high-performance liquid chromatography (HPLC) and immunoassays have been widely used (Halwachs-Baumann et al., 1997 ▶; John et al., 1993 ▶). The HPLC method is more commonly used since its reproducibility and accuracy are good; however, it requires expensive equipment and has a long operating time. The immunoassay method can measure many samples in a short time; however, it can be lacking in reproducibility. Thus, an accurate, reproducible and cost-effective method to measure HbA1c is required. A novel enzymatic method utilizing fructosyl amino-acid oxidase (EC 1.5.3) could fulfil these requirements. Fructosyl amino-acid oxidase (FAOX) catalyses the oxidation of glycated amino acids to produce the corresponding Schiff-base intermediate. Subsequently, the intermediate is readily hydrolysed to amino acids and glucosone (Horiuchi et al., 1989 ▶). In this oxidation reaction, flavin adenine dinucleotide (FAD), a cofactor of FAOX, is reduced to FADH2 and then reoxidized by oxygen to FAD to generate hydrogen peroxide.
Various types of FAOXs have been isolated from several eukaryotes and prokaryotes. The fungal FAOXs are categorized into three groups according to their substrate specificities and the homology of their amino-acid sequences. The first group contains those which preferably oxidize α-glycated amino acids such as N α-(1-deoxy-d-fructos-1-yl)-l-valine (Fru-Val), while the second group contains those which preferably oxidize ∊-glycated amino acids such as N ∊-(1-deoxy-d-fructos-1-yl)-l-lysine (∊Fru-Lys). The FAOXs in the third group oxidize α- and ∊-glycated amino acids at a comparable rate. Interestingly, some of the FAOXs in the first group show unique substrate specificity. FAOX from Coniochaeta sp., Eupenicillium terrenum and Phaeosphaeria nodorum can oxidize an α-glycated dipeptide with the same structure as the N-terminal peptide sequence of the HbA1c β-subunit, i.e. N α-(1-deoxy-d-fructos-1-yl)-l-valyl-l-histidine (Fru-ValHis; Hirokawa et al., 2003 ▶; Kim et al., 2010 ▶). These FAOXs are often referred to as fructosyl peptide oxidases (FPOXs) and generally share high homology with others in the first group and differ only by their ability to oxidize Fru-ValHis.
In the last decade, enzymatic HbA1c assay methods using FPOX have been developed (Hirokawa et al., 2004 ▶, 2005 ▶). These methods basically consist of three steps: (i) proteolysis of the HbA1c β-subunits to release Fru-ValHis, (ii) oxidation of liberated Fru-ValHis by FPOX and (iii) detection of the produced hydrogen peroxide by peroxidase and a suitable chromogen. FPOX-based methods for assaying HbA1c are widespread (Kamayama et al., 2008 ▶; Shirata et al., 2009 ▶) and thus FPOXs are of growing importance in diabetic diagnosis.
Recently, the crystal structure of amadoriase II, an FAOX from Aspergillus fumigatus belonging to the third group, has been solved both in the free form and in complex with the analogue of N α-(1-deoxy-d-fructos-1-yl)-glycine (Fru-Gly; Collard et al., 2008 ▶). However, the relationship between the substrate-binding sites of FPOXs and their substrate specificities is still unclear. In this study, we report the crystallization and preliminary X-ray analysis of two eukaryotic FPOXs: a thermostable mutant of FPOX (Hirokawa et al., 2008 ▶) from Coniochaeta sp. (CFP-T7) and one from E. terrenum (EFP-T5M). These FPOXs exhibit 34 and 36% amino-acid sequence identity to amadoriase II. This crystallographic approach should prove useful for elucidating the active site of FPOXs and should provide a better understanding of what determines their unique substrate specificities.
2. Materials and methods
2.1. Site-directed mutagenesis
CFP-T7 and EFP-T5 are thermostable mutants of FPOXs obtained by random mutagenesis in our previous study (Hirokawa et al., 2008 ▶). In this study, CFP-T7 and EFP-T5M, the deletion mutant of EFP-T5, were used for crystallization. In EFP-T5M, some amino-acid residues estimated to be non-essential for enzyme activity and crystallization were removed from EFP-T5. To construct the EFP-T5M mutant, site-directed mutagenesis was carried out by inverse PCR using KOD-Plus DNA polymerase (Toyobo).
The plasmid pUC-EFP-T5 containing the gene encoding EFP-T5 (Hirokawa et al., 2008 ▶) was used as the template for site-directed mutagenesis. This plasmid and mutagenic primers for deletion of peroxisome targeting signal type 1 (A435-L437), 5′-TGATTCTTGGGGTACCGAGCTC-3′ and 5′-ATCATGCTTCCATCCCGGCATC-3′, were used for inverse PCR. The reaction mixture was digested with DpnI and the amplified DNA fragment was self-ligated by a reaction with T4 polynucleotide kinase and ligase, and introduced into Escherichia coli JM109 cells. Subsequently, the resultant plasmid and mutagenic primers for deletion of the N-terminus (A2-H3), 5′-TCGCGTGCAAGCACCAAAGTC-3′ and 5′-CATGTCGGGGATCCTCTAGAG-3′, were used for inverse PCR. The reaction mixture was digested with DpnI and the amplified DNA fragment was self-ligated by a reaction with T4 polynucleotide kinase and ligase, and introduced into E. coli JM109 cells. The resultant plasmid, pUC-EFP-T5M, also had an extra amino-acid substitution, K339R (AAG→AGG); however, this mutation did not affect enzyme activity.
2.2. Expression and purification
Recombinant CFP-T7 was overexpressed in E. coli JM109 cells and purified as described previously (Hirokawa et al., 2008 ▶). Additionally, purified CFP-T7 was applied onto a HiLoad 26/60 Superdex 200 prep-grade column (GE Healthcare) equilibrated with 10 mM potassium phosphate buffer (KPB) pH 7.0 containing 150 mM sodium chloride and analysed by SDS–PAGE (Laemmli et al., 1970 ▶; Fig. 1 ▶ a). The active fractions were collected, dialysed against 10 mM KPB pH 7.0 and concentrated to 30 mg ml−1 using an Amicon Ultra Ultracel 30K (Millipore). The concentration of CFP-T7 was measured by absorbance at 280 nm using an extinction coefficient of 82 390 M −1 cm−1 calculated from the number of tyrosine and tryptophan residues in CFP-T7 (Pace et al., 1995 ▶).
Figure 1.

SDS–PAGE analysis after gel-filtration chromatography. Lane M contains molecular-mass markers. (a) CFP-T7. 4 µg protein was used in all lanes. The arrow indicates CFP-T7. Fractions 1–4 were collected and used for crystallization. (b) EFP-T5M. 2.5 µg protein was used in all lanes. The arrow indicates EFP-T5M. Fractions 1–13 were collected and used for crystallization.
The plasmid pUC-EFP-T5M was introduced into E. coli BL21 cells and transformants were cultured in 3 l LB medium containing 50 µg ml−1 ampicillin and 1 mM isopropyl-β-d-thiogalactopyranoside at 303 K. The cells were then harvested by centrifugation and resuspended in 150 ml 10 mM KPB pH 7.0 for disruption by sonication. The homogenate was centrifuged at 6000g for 15 min to remove intact cells and cell debris. Ammonium sulfate was added to the above supernatant to 35% saturation and the resultant solution was centrifuged at 7000g for 15 min to remove precipitate. Subsequently, ammonium sulfate was added to the supernatant to 70% saturation followed by centrifugation at 7000g for 30 min. The resulting precipitate was dissolved in 60 ml 10 mM KPB pH 7.0 followed by centrifugation at 30 000g for 15 min. The supernatant was then dialysed against 10 mM KPB pH 6.5 and applied onto a Q Sepharose FF column (GE Healthcare) equilibrated with 10 mM KPB pH 6.5. The column was washed with the same buffer and the non-absorbed protein fraction was collected and dialysed against 10 mM KPB pH 8.0. Subsequently, the dialysed solution was applied onto a HiLoad 26/10 Q Sepharose HP column (GE Healthcare) equilibrated with 10 mM KPB pH 8.0. The column was washed with the same buffer and the absorbed protein was eluted with a linear NaCl gradient (0–100 mM). EFP-T5M was eluted at 40–55 mM NaCl. The active fractions were collected and applied onto a HiLoad 26/60 Superdex 200 prep-grade column equilibrated with 10 mM HEPES–NaOH pH 8.0 containing 150 mM NaCl and analysed by SDS–PAGE (Fig. 1 ▶ b). Purified EFP-T5M solutions were dialysed with 10 mM HEPES–NaOH pH 8.0 and concentrated to 20 mg ml−1 using Amicon Ultra Ultracel 30K. The concentration of EFP-T5M was measured by absorbance at 280 nm using an extinction coefficient of 76 890 M −1 cm−1 calculated from the number of tyrosine and tryptophan residues in EFP-T5M (Pace et al., 1995 ▶).
2.3. Crystallization
Crystallization of CFP-T7and EFP-T5M was carried out using the sitting-drop vapour-diffusion method at 293 K. Initial crystallization screening was undertaken using Crystal Screen and Crystal Screen 2, Index, MembFac, PEG/Ion (Hampton Research), JCSG-plus, MemGold, MemStart, MemSys (Molecular Dimensions), Precipitant Synergy and Wizard I, II and III (Emerald BioSystems) by mixing 100 nl protein solution with 100 nl reservoir solution. Subsequently, crystallization conditions were optimized by varying the concentrations of precipitants and additives and the pH by mixing 2 µl protein solution with 2 µl reservoir solution.
2.4. Data collection and processing
The CFP-T7 crystal was transferred into a cryoprotectant consisting of 2.2 M potassium/sodium phosphate pH 6.4, 2.0%(v/v) PEG 400, 20.0%(v/v) glycerol. A few minutes later, it was scooped up in a cryoloop and cooled in liquid nitrogen. X-ray diffraction data were collected at 100 K using synchrotron radiation of wavelength 1.0 Å on BL41XU at SPring-8 (Hyogo, Japan) on a MAR225HE CCD detector. The crystal-to-detector distance was 165 mm. Data were collected to 1.8 Å resolution (1.0° frames) with an exposure time of 1 s.
The EFP-T5M crystal was transferred into a cryoprotectant consisting of 100 mM sodium citrate pH 6.1, 29%(w/v) PEG 4000, 12%(v/v) 2-propanol. A few minutes later, it was scooped up in a cryoloop and cooled in liquid nitrogen. X-ray diffraction data were collected at 100 K using synchrotron radiation of wavelength 1.0 Å on BL41XU at SPring-8 (Hyogo, Japan) on an ADSC-Q315 CCD detector. The crystal-to-detector distance was 210 mm. Data were collected to 1.6 Å resolution (0.1° frames) with an exposure time of 1 s.
The data of each crystal were indexed and integrated with MOSFLM (Leslie, 1992 ▶) and were scaled using SCALA from the CCP4 program suite (Winn et al., 2011 ▶).
3. Results and discussion
During the preliminary screening for crystallization conditions, rod-shaped crystals of CFP-T7 were found in a drop consisting of 2.0 M potassium/sodium phosphate pH 6.5 with 2%(v/v) PEG 400 (Precipitant Synergy condition No. 9) and plate-shaped crystals of EFP-T5M were found in a drop consisting of 100 mM sodium citrate pH 5.5 with 20%(w/v) PEG 4000, 10%(v/v) 2-propanol (Wizard III condition No. 17). Subsequent refinement gave the best crystallization conditions consisting of 2.0 M potassium/sodium phosphate pH 6.4 with 2.6%(v/v) PEG 400 for CFP-T7 (Fig. 2 ▶ a) and 100 mM sodium citrate pH 6.1 with 24%(w/v) PEG 4000 and 10%(v/v) 2-propanol for EFP-T5M (Fig. 2 ▶ b).
Figure 2.
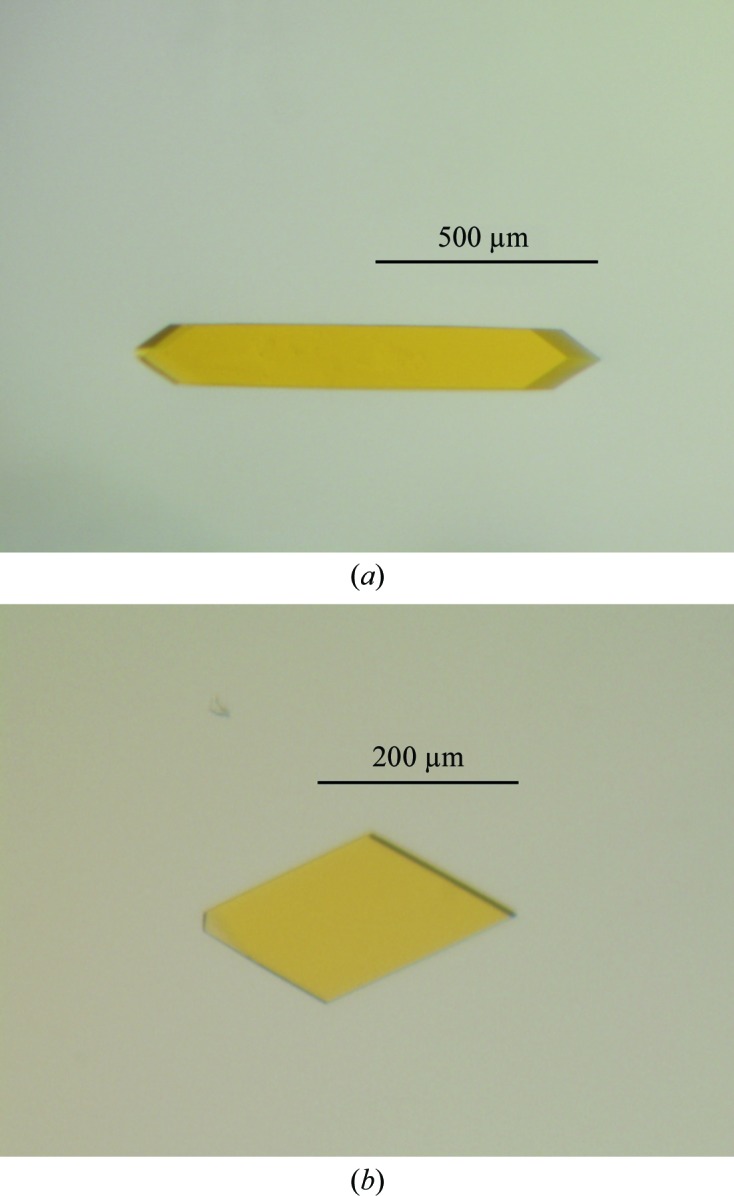
Crystals of FPOXs in a sitting drop. (a) A crystal of CFP-T7 obtained from 2.0 M potassium/sodium phosphate pH 6.4 with 2.6%(v/v) PEG 400. The crystal dimensions are about 1.0 × 0.2 × 0.1 mm. (b) A crystal of EFP-T5M obtained from 100 mM sodium citrate pH 6.1 with 24%(w/v) PEG 4000 and 10%(v/v) 2-propanol. The crystal dimensions are about 0.3 × 0.2 × 0.05 mm.
X-ray diffraction data were collected from the crystals of CFP-T7 and EFP-T5M to 1.8 and 1.6 Å resolution, respectively. The crystal of CFP-T7 belonged to the tetragonal space group P41212, with unit-cell parameters a = b = 110.09, c = 220.48 Å. Assuming the presence of three molecules in the asymmetric unit, the Matthews coefficient (V M) was 2.3 Å3 Da−1 and the estimated solvent content was 45% (Matthews, 1968 ▶). The crystal of EFP-T5M belonged to the monoclinic space group P21, with unit-cell parameters a = 43.00, b = 230.05, c = 47.27 Å, β = 116.99°. Assuming the presence of two molecules in the asymmetric unit, V M was 2.1 Å3 Da−1 and the estimated solvent content was 42%. Data-collection statistics for each FPOX crystal are given in Table 1 ▶.
Table 1. Statistics of X-ray diffraction data.
Values in parentheses are for the outermost resolution shell.
| CFP-T7 | EFP-T5M | |
|---|---|---|
| X-ray source | BL41XU, SPring-8 | BL41XU, SPring-8 |
| Space group | P41212 | P21 |
| Unit-cell parameters (Å, °) | a = b = 110.09, c = 220.48, α = β = γ = 90 | a = 43.00, b = 230.05, c = 47.27, α = γ = 90, β = 116.99 |
| Wavelength (Å) | 1.0000 | 1.0000 |
| Resolution range (Å) | 32.85–1.80 (1.90–1.80) | 41.43–1.60 (1.69–1.60) |
| Total No. of reflections | 907098 (126348) | 393218 (57321) |
| No. of unique reflections | 124047 (17696) | 106467 (15574) |
| Completeness (%) | 98.9 (98.0) | 99.4 (99.3) |
| R merge † (%) | 6.7 (30.2) | 7.0 (29.5) |
| 〈I/σ(I)〉 | 19.8 (6.3) | 11.8 (4.4) |
| Multiplicity | 7.3 (7.1) | 3.7 (3.7) |
R
merge = 
 .
.
The program MOLREP (Vagin & Teplyakov, 2010 ▶) was utilized for phase determination by molecular replacement using reflections to 3.5 Å resolution and the structure of amadoriase II (FAOX from A. fumigatus; PDB entries 3djd and 3dje; F. Collard, J. Zhang, I. Nemet, K. R. Qanungo, V. M. Monnier & V. C. Yee, unpublished work) as a model. As a result, the initial R factors of the CFP-T7 and EFP-T5M models were 57.1 and 56.1%, respectively. Two rather than three molecules were found in the asymmetric unit for the CFP-T7 crystal, while two molecules were found in the asymmetric unit as predicted for the EFP-T5M crystal. Therefore, V M was 3.4 Å3 Da−1 and the estimated solvent content was 64% for the CFP-T7 crystal.
Acknowledgments
We thank Dr A. Matsuyama for providing the opportunity for this study, close support, encouragement and fruitful discussions.
References
- Bunn, H. F., Gabbay, K. H. & Gallop, P. M. (1978). Science, 200, 21–27. [DOI] [PubMed]
- Collard, F., Zhang, J., Nemet, I., Qanungo, K. R., Monnier, V. M. & Yee, V. C. (2008). J. Biol. Chem. 283, 27007–27016. [DOI] [PMC free article] [PubMed]
- Halwachs-Baumann, G., Katzensteiner, S., Schnedl, W., Pürstner, P., Pieber, T. & Wilders-Truschnig, M. (1997). Clin. Chem. 43, 511–517. [PubMed]
- Hirokawa, K., Gomi, K. & Kajiyama, N. (2003). Biochem. Biophys. Res. Commun. 311, 104–111. [DOI] [PubMed]
- Hirokawa, K., Ichiyanagi, A. & Kajiyama, N. (2008). Appl. Microbiol. Biotechnol. 78, 775–781. [DOI] [PubMed]
- Hirokawa, K., Nakamura, K. & Kajiyama, N. (2004). FEMS Microbiol. Lett. 235, 157–162. [DOI] [PubMed]
- Hirokawa, K., Shimoji, K. & Kajiyama, N. (2005). Biotechnol. Lett. 27, 963–968. [DOI] [PubMed]
- Horiuchi, T., Kurokawa, T. & Saito, N. (1989). Agric. Biol. Chem. 53, 103–110.
- John, W. G., Gray, M. R., Bates, D. L. & Beacham, J. L. (1993). Clin. Chem. 39, 663–666. [PubMed]
- Kamayama, A., Shimohiro, H., Nogami, S., Tanimoto, A. & Okazaki, T. (2008). Jpn. J. Med. Technol. 57, 182–184.
- Kim, S., Ferri, S., Tsugawa, W., Mori, K. & Sode, K. (2010). Biotechnol. Bioeng. 106, 358–366. [DOI] [PubMed]
- Kobold, U., Jeppsson, J. O., Dülffer, T., Finke, A., Hoelzel, W. & Miedema, K. (1997). Clin. Chem. 43, 1944–1951. [PubMed]
- Laemmli, U. K. (1970). Nature (London), 227, 680–685. [DOI] [PubMed]
- Leslie, A. G. W. (1992). Crystallographic Computing 5: From Chemistry to Biology, edited by D. Moras, A. D. Podjarny & J.-C. Thierry, pp. 39–50. Oxford University Press.
- Matthews, B. W. (1968). J. Mol. Biol. 33, 491–497. [DOI] [PubMed]
- Pace, C. N., Vajdos, F., Fee, L., Grimsley, G. & Gray, T. (1995). Protein Sci. 4, 2411–2423. [DOI] [PMC free article] [PubMed]
- Shapiro, R., McManus, M. J., Zalut, C. & Bunn, H. F. (1980). J. Biol. Chem. 255, 3120–3127. [PubMed]
- Shirata, T., Noguchi, N., Nakajima, E., Ohnuma, O., Igarashi, M., Tominaga, M. & Tajima, N. (2009). Jpn. J. Med. Technol. 58, 189–194.
- Vagin, A. & Teplyakov, A. (2010). Acta Cryst. D66, 22–25. [DOI] [PubMed]
- Winn, M. D. et al. (2011). Acta Cryst. D67, 235–242.