

Abstract
Study Objectives
We evaluated the effects of sleep restriction on leptin levels in a large, diverse sample of healthy participants, while allowing free access to food.
Methods
Prospective experimental design. After 2 nights of baseline sleep, 136 participants (49% women, 56% African Americans) received 5 consecutive nights of 4 hours time in bed (TIB). Additionally, one subset of participants received 2 additional nights of either further sleep restriction (n = 27) or increased sleep opportunity (n = 37). Control participants (n = 9) received 10 hr TIB on all study nights. Plasma leptin was measured between 10:30 a.m. and 12:00 noon following baseline sleep, after the initial sleep-restriction period, and after 2 nights of further sleep restriction or recovery sleep.
Results
Leptin levels increased significantly among sleep-restricted participants after 5 nights of 4 hr TIB (Z = −8.43, p < .001). Increases were significantly greater among women compared to men (Z = −4.77, p < .001) and among participants with higher body mass index (BMI) compared to those with lower (Z = −2.09, p = .036), though participants in all categories (sex, race/ethnicity, BMI, and age) demonstrated significant increases. There was also a significant effect of allowed TIB on leptin levels following the 2 additional nights of sleep restriction (p < .001). Participants in the control condition showed no significant changes in leptin levels.
Conclusions
These findings suggest that sleep restriction with ad libitum access to food significantly increases morning plasma leptin levels, particularly among women.
Keywords: leptin, sleep restriction, sex, obesity
Leptin is an adipocyte-derived, proinflammatory hormone that plays a key role in energy homeostasis (Lago, Gomez, Lago, Gomez-Reino, & Gualillo, 2008; Zhang et al., 1994), potentially via increased energy use through increased sympathetic outflow and decreased food intake (Collins et al., 1996). Circulating leptin levels are correlated with adipose tissue mass, and levels are higher in obese compared to lean adults (Considine et al., 1996). Epidemiologic evidence suggests that in recent years, rates of obesity/overweight have increased (Flegal, Carroll, Ogden, & Johnson, 2002; Schiller, Martinez, & Barnes, 2006), while self-reported sleep durations have decreased (National Sleep Foundation, 1998, 2006; Tune, 1968). Numerous studies have also documented a strong relationship between shorter habitual sleep durations and higher body mass indices (BMIs) in both adults and children (for meta-analytic review, see Cappuccio et al., 2008). Although some recent evidence suggests that other characteristics of sleep (e.g., snoring, sleep fragmentation) may contribute to the relationship between shorter sleep duration and higher BMI (Lauderdale et al., 2009), the underlying biological mechanisms are not yet understood.
Leptin has recently been proposed as one possible mechanistic link between increasing rates of obesity and decreasing habitual sleep durations. Two epidemiological studies have reported that shorter self-reported sleep durations are associated with decreased fasting plasma leptin levels and higher BMIs (Chaput, Despres, Bouchard, & Tremblay, 2007; Taheri, Lin, Austin, Young, & Mignot, 2004). Additionally, a number of experimental studies have reported decreases in leptin following sleep restriction (Gomez-Merino, Chennaoui, Drogou, Bonneau, & Guezennec, 2002; Gomez-Merino et al., 2005; Guilleminault et al., 2003; Gundersen, Opstad, Reistad, Thrane, & Vaagenes, 2006; Mullington et al., 2003; Nindl et al., 2006; Spiegel, Leproult, et al., 2004; Spiegel, Tasali, Penev, & Van Cauter, 2004), though two recent studies reported no change in leptin following sleep restriction (Nedeltcheva et al., 2009; Schmid, Hallschmid, Jauch-Chara, Born, & Schultes, 2008). However, all of these studies have relied on small samples (N ≤ 12) composed primarily of males, and all but one either severely restricted/controlled food intake or allowed daily caloric intake to vary during sleep restriction but assessed leptin levels during a subsequent period of caloric control. In the one study where small meals were provided during sleep restriction, leptin levels increased significantly across the sleep restriction period (Shea, Hilton, Orlova, Ayers, & Mantzoros, 2005). Thus, there are very limited data available on the effects of sleep restriction on leptin levels when other physiologic systems related to leptin levels and maintenance of energy balance (i.e., food intake and physical activity) are permitted to vary in response to the changing physiologic environment.
Additionally, no previous studies have enrolled a sufficiently large sample to examine the effects of demographic characteristics on the effects of sleep restriction. Women, in particular, have been understudied. Given that health risks vary according to sex and race/ethnicity (see, e.g., Ervin, 2009; Lloyd-Jones et al., 2009), evaluation of these phenomena across a diverse population is critical. To address these issues, we conducted a study to investigate the effects of sustained sleep restriction on leptin levels while allowing participants free access to food in addition to regularly scheduled meals. The amount of sleep restriction was held constant for the first 5 days and then varied systematically in a subset of participants for 2 additional nights to assess the effects of duration of sleep opportunity on plasma leptin levels. We also used a larger sample size than has previously been studied, enrolling both men and women of diverse racial/ethnic backgrounds.
Methods
Participants
Participants were recruited from advertisements in Philadelphia area newspapers and were compensated for participation with payments based on time of participation in study (e.g., screening only, complete participation). The initial pool of participants comprised 163 healthy adults who provided informed consent to take part in this study, which was approved by the institutional review board (IRB) of the University of Pennsylvania. Participants underwent a complete medical history and physical screening to rule out hepatitis, cancer, other serious medical conditions, and Axis I psychiatric disorders (e.g., major depressive disorder, schizophrenia). Current use of prescribed medications was also an exclusion criterion. Physicals were conducted by nurse practitioners in the General Clinical Research Center at the University of Pennsylvania; height and weight measurements for BMI were also collected by study nurses at this time. For female participants, the start date of last menstrual period was also collected via self-report to assess menstrual phase. Clinical chemistry and urine tests were performed to ensure participants were free of active infection and illicit drugs. Normal sleep–wake rhythms and average sleep duration (7–9 hr of sleep per night, with morning wake time between 06:00 and 09:00 hr) were verified by sleep logs and actigraphy for a period of at least 1 week prior to participation in the study. The latter criterion functioned both to exclude potential participants with a circadian phase disorder and to ensure that the assigned wake times in the study did not deviate significantly from participants’ normal sleep cycles.
Complete data were collected from 145 participants (mean age 30.42 years, range 22–45 years; mean BMI 24.66 kg/m2, range 17.7–32.6 kg/m2; sex: 49% women; race/ethnicity: 39% Caucasian, 56% African American, 5% other). The 18 participants (11% of total) who had incomplete data (13 withdrew or were withdrawn for minor physical or performance concerns; 2 had one or more data points below the lowest leptin level that could be reliably detected by assay reagents [verified with standardized samples]; 1 had an insufficient sample to assay at one data point; 1 had one unsuccessful blood draw; 1 had baseline leptin data >2 SD above the mean) did not differ significantly from completers on any demographic variable (p values > .42; race/ethnicity comparison based on Caucasian and African American participants only). Data from participants with incomplete data are not presented.
Protocol Design
Sleep restriction
An 11-day protocol was conducted in the Sleep and Chronobiology Laboratory at the Hospital of the University of Pennsylvania. Participants were kept in constant dim ambient light of <50 lux for the duration of the study and were not permitted visitors. Lights were maintained at this low level to prevent any changes in the time-keeping hormone melatonin, which is sensitive to light levels.
Participants were randomized to either the sleep restriction (n = 136) or the control condition (n = 9) based on power calculations generated for the main (neurobehavioral) outcome measure of the study. Sleep-restricted participants did not differ significantly from control participants on any demographic measure (p values > .14). The 136 sleep-restricted participants completed 2 nights of baseline sleep (B1 and B2; 10 hr time in bed [TIB]/night) followed by 5 nights of sleep restriction (SR1–SR5; 4 hr TIB/night). Of these participants, 27 were randomized to receive 2 additional nights of further sleep restriction (FR group: FR1 and FR2: 0, 2, or 4 hr TIB/night) and 37 were randomized to receive 2 nights of increased sleep time (recovery sleep group: RS1 and RS2: 6, 8, or 10 hr TIB/night). Sleep and wake times were anchored to a morning wake time of 08:00 hr; as such, on nights with a 4-hr sleep opportunity, participants were allowed in bed only during 04:00–08:00 hr. All sleep-restricted participants received 2 additional nights of 10 hr and 12 hr TIB before leaving the laboratory (data not presented). A cohort of 9 control participants received 10 hr TIB/night for the duration of the 11-night protocol. All participants were run through the protocol in groups of 4–5, which helped to buffer feelings of isolation in the laboratory environment through social interaction. See Figure 1 for a more detailed description of the study design and sample sizes.
Figure 1.

Study design. Control condition (n = 9) received 10 hr TIB/night. Blood draws were completed between 10:30 and 12:00 following baseline (B2), sleep restriction (SR5), and further sleep restriction (FR2)/recovery sleep (RS2) nights. Participants without complete data are not presented. TIB = time in bed.
Blood-sampling paradigm
Blood draws were performed through the antecubital vein between 10:30 and 12:00 on the mornings following B2, SR5, and FR2 or RS2. Samples were collected from control participants on equivalent study protocol days. Samples were drawn into 10-mL plastic vacutainer tubes spray-coated with sodium heparin, centrifuged, aliquotted, and frozen at −80°C until analysis. Samples were assayed for leptin and a subset of other inflammatory and endocrine markers. Only leptin results are presented here; analysis of other data is currently in progress.
Leptin assays
Plasma leptin levels were measured by a commercially available radioimmunoassay kit (Millipore, Billerica, Massachusetts). The sensitivity limit was 0.5 ng/mL, interassay coefficients of variation were 14.4% and 9.2% (for low and high leptin concentrations, respectively), and intraassay coefficients of variation were 5.6% and 3.4% (for low and high concentration leptin standards, respectively). All samples and standards were assayed in duplicate within the same assay kit.
Laboratory environment
Participants received three meals per day plus an optional evening snack on nights when they received sleep opportunities of less than 8 hr TIB. Study participants determined the timing of food consumption; however, breakfast was typically consumed between 08:30 and 11:00, lunch between 12:30 and 16:00, and dinner between 18:30 and 20:00. Additional snack food was available ad libitum throughout the study, as were water, juice, and caffeine-free soda. Meal choices were selected by participants from a standardized set of options provided by the Metabolic Kitchen of the Hospital of the University of Pennsylvania; chocolate, turkey, bananas, and caffeinated beverages were prohibited due to their effects on sleep/alertness. Participants were allowed to ambulate freely in the laboratory and were not confined to their beds throughout the study (excluding assigned sleep periods) but were restricted from performing more strenuous activities. While not engaged in study-related activities, participants read books, played board games, and watched movies.
Statistical Analyses
Statistical Package for the Social Sciences (SPSS) Statistical Software, version 16.0 (SPSS Inc, Chicago, Illinois), was used for statistical analyses. Nonparametric analyses were conducted using the total sample to assess the effects of 5 nights of partial sleep restriction on plasma leptin levels (B2 to SR5). Mann-Whitney U tests were used for between-group comparisons, and Wilcoxin signed rank tests were used for within-group comparisons. Comparisons were also conducted to assess for differences within demographic groups (sex, race, age, BMI, and a subset analyses of lean men only). Regression analyses were completed to assess the predictive value of demographic variables (sex, BMI, race/ethnicity, age) on change in leptin levels. Log-transformed scores were used for regression analyses, and residuals as well as Mahalanobis distances were examined for outliers and model fit. A 2-by-2 between-groups analysis of covariance (ANCOVA) was also conducted to assess the effect of further sleep restriction (FR2) or recovery sleep (RS2) for both male and female participants, while controlling for BMI and prior change from B2 to SR5. Log-transformed data were used for the ANCOVA, as raw leptin data were not normally distributed.
Results
The mean leptin level for the sleep-restricted participants was 7.88 (±6.59) ng/mL at baseline (B2) and increased to 10.51 (±8.83) ng/mL following 5 nights of partial sleep restriction (SR5). Leptin levels did not change significantly from B2 to SR5 within the control group (Z = −0.18, p = .86). Among sleep-restricted participants, leptin levels significantly increased from B2 to SR5 in the total sample (Z = −8.43, p < .001) as well as among males (Z = −5.87, p = < .001), females (Z = −6.07, p = < .001), African Americans (Z = −6.06, p < .001), and Caucasians (Z = −5.48, p < .001). Leptin levels also increased significantly following sleep restriction in the following subsamples grouped by age and BMI: participants with higher BMIs (above the median [24.3 kg/m2]: Z = −6.32, p < .001), participants with lower BMIs (below the median: Z = −5.55, p < .001), older participants (above the mean: Z = −5.67, p < .001), and younger participants (below the mean: Z = −6.24, p < .001). Lean male participants (BMI ≤ 24; n = 26), a subsample similar to participants in most previous studies, also demonstrated significant elevations in leptin levels as a result of sleep restriction (Z = −2.98, p = .003). Also within the sleep-restriction condition, a comparison of women and men on leptin change scores indicated that women demonstrated a greater increase in leptin levels from B2 to SR5 than men (Z = −4.77, p < .001; Figure 2). Changes in leptin were also greater in participants with higher compared to lower BMI (Z = −2.09, p = .036). Comparisons of changes in leptin from B2 to SR5 between other demographic groups (race/ethnicity, age) were nonsignificant (all p values > .14). See Table 1 for presentation of all means and standard deviations.
Figure 2.
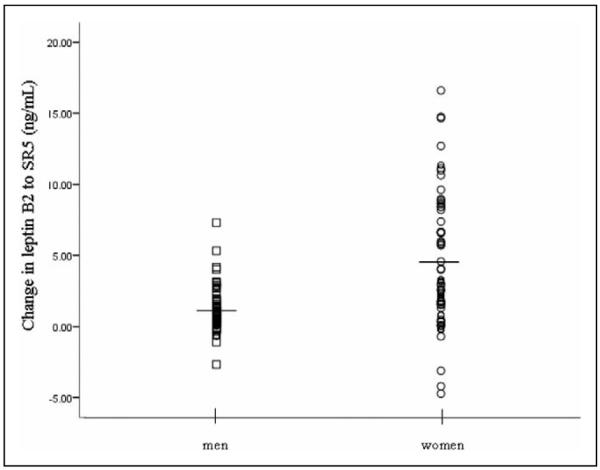
Effects of sleep restriction on leptin levels in male and female study participants from baseline (B2) to post–5 nights of partial sleep restriction (SR5). Horizontal lines represent mean values: male participants = 1.11 ng/mL, female participants = 4.29 ng/mL. Mean body mass index (BMI) = 25.68 kg/m2 for male participants and 23.46 kg/m2 for female participants.
Table 1.
Mean Leptin Levels at Baseline (B2) and After 5 Nights of Sleep Restricted to 4 hr Time in Bed/Night (SR5) for Sleep-Restricted and Control Participants and Subgroups of Sleep-Restricted Participants
| Leptin Levels (ng/mL), Mean (SD) |
||
|---|---|---|
| Participants and Subgroups | B2 | SR5 |
| Sleep-restricted participants (n = 136) | 7.88 (6.59) | 10.51 (8.83) |
| Control participants (n = 9) | 10.88 (6.49) | 11.03 (6.32) |
| Subgroups of sleep-restricted participants | ||
| Sexa | ||
| Males (n = 71) | 4.65 (3.78) | 5.76 (4.42) |
| Females (n = 65) | 11.41 (7.20) | 15.70 (9.52) |
| Racea | ||
| African Americans (n = 75) | 9.28 (7.28) | 12.29 (9.50) |
| Caucasians (n = 54) | 5.58 (4.68) | 7.48 (6.34) |
| BMIa | ||
| Below median BMI (n = 68) | 5.79 (5.18) | 7.84 (6.72) |
| Above median BMI (n = 68) | 9.97 (7.21) | 13.19 (9.87) |
| Age | ||
| Below mean age (n = 77) | 6.76 (6.10) | 9.40 (8.66) |
| Above mean age (n = 59) | 9.34 (6.98) | 11.97 (8.91) |
NOTES: Subgroups of control participants are not presented due to sample size. Data from sleep-restricted participants who indicated race/ethnicity other than Caucasian or African American are not presented separately. Median body mass index (BMI) = 24.3 kg/m2. Mean age = 30.63 years.
Subgroups differed significantly at baseline (all p values < .002).
Regression analyses conducted to assess the relative contributions of different variables to leptin response to sleep restriction showed significant contributions of sex and BMI, similar to results from the nonparametric comparisons presented above (Table 2).
Table 2.
Contributions of Demographic Variables to Leptin Response to Sleep Restriction From Baseline to Post–5 Nights of Partial Sleep Restriction (B2 to SR5)
| Variable | B | SE B | β |
|---|---|---|---|
| Sex | 3.93 | 0.56 | .55* |
| BMI | 0.36 | 0.083 | .37* |
| Age | −0.60 | 0.039 | .12 |
| Race/ethnicitya | 0.42 | 0.58 | .058 |
NOTE: R2 = .32. Results of analysis of variance (ANOVA): F(4, 124) = 14.45, p < .001. B = unstandardized beta (regression) coefficient; SE B = standard error of B; β = standardized beta (regression) coefficient.
Only African American and Caucasian sleep-restricted participants included in the model.
p < .001.
A 2-by-2 between-groups ANCOVA was conducted to assess the effects of further sleep restriction (FR2) and recovery sleep (RS2) on leptin levels for men and women, controlling for prior change in leptin from B2 to SR5 and for BMI. The independent variables were the recovery groups (further restriction: FR2; recovery: RS2) and sex (male, female). The dependent variable was change in log-transformed leptin scores from SR5 to FR2 or RS2. BMI and change in log-transformed leptin levels from B2 to SR5 were used as covariates to control for individual differences. After adjustment for BMI and change in leptin levels from B2 to SR5, there was a significant effect of recovery group (F(1, 58) = 14.33, p < .001) with a large effect size (partial eta squared = .20). There was no interaction between recovery group and sex (F(1, 58) = 0.00 p = .99), but there was a significant main effect of sex (F(1, 58) = 5.90, p .018) with a moderate effect size (partial eta squared = .092). See Figure 3 for presentation of leptin levels by recovery group.
Figure 3.
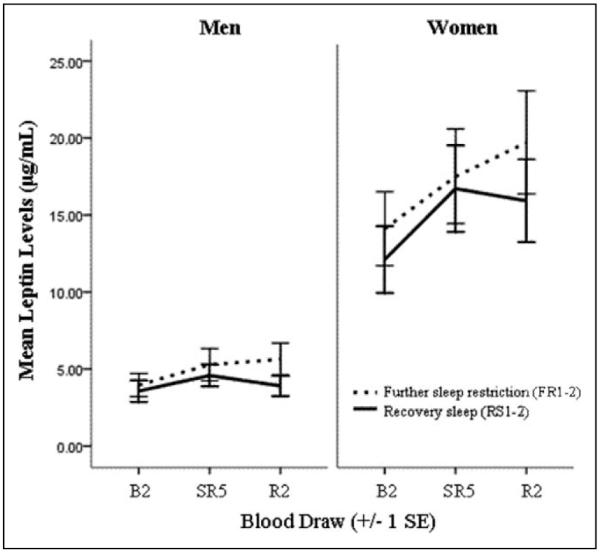
Leptin levels at all three time points for male and female participants completing 2 days of further sleep restriction or recovery sleep. Raw data (not controlling for body mass index [BMI]), split by sex, is presented. B2 = baseline; FR2 = post–2 days of further sleep restriction; RS2 = post–2 days of increased sleep time; SR5 = post–5 nights of partial sleep restriction.
Discussion
The current study demonstrates that morning plasma leptin levels increase significantly following 5 nights of partial sleep restriction with ad libitum access to food. Observed increases in plasma leptin levels were maintained with further sleep restriction and decreased with increased sleep opportunity. These findings were consistent across a diverse sample, although women and heavier (higher BMI) participants were observed to have a significantly greater leptin response to sleep restriction compared to men and participants with lower BMIs. Results from the current study provide new evidence that women are differentially vulnerable to the physiological consequences of sleep restriction. Estimated menstrual phase did not have a significant effect on either baseline leptin levels or their response to sleep restriction; as such, it is unlikely that menstrual phase contributed significantly to the greater, and more variable, leptin response among women compared to men. The observed sex differences may, then, be related to physiological (e.g., gonadal steroids, Rosenbaum, Pietrobelli, Vasselli, Heymsfield, & Leibel, 2001; hypothalamic-pituitary-adrenal axis reactivity, Uhart, Chong, Oswald, Lin, & Wand, 2006) or psychological differences (e.g., differences in food consumption in response to stress; Zellner et al., 2006). In any case, it is likely that these differences resulted from an interaction between biological factors and behavioral outcomes (e.g., food choices and amount consumed) in response to stress.
While the majority of experimental sleep-restriction research has enrolled male-only samples, two prior epidemiologic studies have documented increased cardiovascular risk (incident myocardial infarction, hypertension) associated with short sleep durations among women but not men (Cappuccio et al., 2007; Ikehara et al., 2009), and one additional study has documented associations between short sleep durations and inflammatory markers (interleukin [IL]-6, high sensitivity C-reactive protein [hs-CRP]) among women but not men (Miller et al., 2009). Furthermore, the finding that increases in leptin following sleep restriction were significantly greater among women and heavier individuals also has intriguing parallels with epidemiological evidence that rates of both obesity (BMI > 30) and extreme obesity (BMI > 40) are higher among women compared to men and that increases in rates of obesity and extreme obesity from 1988–1994 to 1999–2000 were larger among women (Flegal et al., 2002). These studies provide additional support for the sex-based difference observed in the current study, which suggests that effects on leptin may be one biological pathway through which women may be more vulnerable to health risks from behavioral factors (e.g., restricted sleep).
Observed increases in leptin during periods of sleep restriction in the current study were similar to percentage changes reported during periods of “overfeeding” (Chin-Chance, Polonsky, & Schoeller, 2000) and could reflect simply an increased food intake due to increased time awake. However, the increases in leptin levels observed during one study of total sleep restriction with controlled food intake (Shea et al., 2005) suggest that the findings of the current study are not a result of increased food intake alone. Several studies have reported increases in hunger during fasting or calorically controlled sleep restriction (Schmid et al., 2008; Spiegel, Tasali, et al., 2004), but reports of food consumption during sleep restriction have been mixed (Nedeltcheva et al., 2009; Schmid, Dilba, Halischmid, Jauch-Chara, & Schultes, 2007). As such, there is some evidence that hunger increases during sleep restriction when access to food is controlled and limited evidence that patterns of food intake may change during sleep restriction. These changes may occur simply as a result of increased time awake (Saper, Chou, & Elmquist, 2002), as a mechanism to moderate boredom or stress (Dallman et al., 2003; Vgontzas et al., 2008), or as part of a more complex interaction with orexin systems associated with maintenance of wakefulness and feeding behaviors (Willie, Chemelli, Sinton, & Yanagisawa, 2001). It is also possible that food consumption, itself, at an adverse circadian phase (e.g., nighttime) may play a role.
It is a limitation of the current study that exact energy intake and expenditures were not assessed, particularly with respect to changes in leptin between differing amounts of sleep opportunity. Another methodological limitation was the use of a single blood draw per sampling day rather than sampling leptin levels over the course of a 24-hr day. While significant relationships between sleep duration and leptin levels based on a single blood draw have previously been reported in the literature (e.g., Taheri et al., 2004; van Leeuwen et al., 2009), this methodology may not adequately capture changes in the diurnal rhythm of leptin in response to sleep restriction (e.g., Mullington et al., 2003). It is less clear why our study findings differ from those of the one laboratory study that also provided free access to food (Nedeltcheva et al., 2009), though differences in measurement parameters (fasting compared to nonfasting, 24-hr profile compared to a single blood draw, differences in sample size) suggest that the neuroendocrine response to sleep restriction and food intake may be sensitive to the experimental conditions under which leptin is assessed. The robustness of the current findings across demographic groups (sex, age, race/ethnicity, BMI), however, demonstrates that observed changes in leptin are relatively consistent within our experimental parameters, which more closely resemble the real-world environment than previous studies that strictly controlled or restricted food intake. Additional research is needed to clarify the respective contributions of short- and long-term sleep restriction and food intake on leptin levels and body weight.
While the current findings differ from previous studies that have restricted or controlled food intake and generally observed decreases in leptin levels (Gomez-Merino et al., 2002, 2005; Guilleminault et al., 2003; Gundersen et al., 2006; Mullington et al., 2003; Nindl et al., 2006; Schmid et al., 2008; Spiegel, Leproult et al., 2004; Spiegel, Tasali, et al., 2004), these disparate findings may still reflect the same epiphenomenon: sleep restriction may cause an initial decrease in leptin levels, which stimulates appetite and results in increased food intake, leading to elevated leptin levels. However, this study is the first to document any differential response across demographic groups within the population.
Findings from the current study are significant because the experimental conditions used more closely resemble the real-world conditions under which sleep restriction occurs—environments where access to food is plentiful and physical activity is limited due to increasingly sedentary lifestyles. Additionally, this study provides novel evidence of a differential vulnerability of women and individuals with higher BMIs to the biological effects of sleep restriction. Results from the current study demonstrate that sleep restriction can result in direct physiological changes that are relevant to obesity, particularly given the prevalence of shortened sleep and increasing rates of obesity in modern society. This research is of relevance to nursing practice as it emphasizes that obtaining adequate sleep is an important health behavior and that inadequate sleep is associated with health risks, as well as identifies populations that may be more vulnerable to the deleterious effects of sleep loss. These findings have both clinical and occupational (e.g., nursing shift work) significance.
Acknowledgment
Leptin assays were conducted by the RIA/Biomarker Core Laboratory at the University of Pennsylvania School of Medicine (Technical Director: Heather Collins, PhD).
Funding The author(s) disclosed receipt of the following financial support for the research and/or authorship of this article: National Institute of Health (NIH NR004281, F31 AG031352) and the National Center for Research Resources (UL1RR024134).
Footnotes
Declaration of Conflicting Interests The author(s) declared no conflicts of interest with respect to the authorship and/or publication of this article.
References
- Cappuccio FP, Stranges S, Kandala NB, Miller MA, Taggart FM, Kumari M, Marmot MG. Gender-specific associations of short sleep duration with prevalent and incident hypertension: The Whitehall II study. Hypertension. 2007;50:693–700. doi: 10.1161/HYPERTENSIONAHA.107.095471. [DOI] [PMC free article] [PubMed] [Google Scholar]
- Cappuccio FP, Taggart FM, Kandala NB, Currie A, Peile E, Stranges S, Miller MA. Meta-analysis of short sleep duration and obesity in children and adults. Sleep. 2008;31:619–626. doi: 10.1093/sleep/31.5.619. [DOI] [PMC free article] [PubMed] [Google Scholar]
- Chaput JP, Despres JP, Bouchard C, Tremblay A. Short sleep duration is associated with reduced leptin levels and increased adiposity. Obesity (Silver Spring) 2007;15:253–261. doi: 10.1038/oby.2007.512. [DOI] [PubMed] [Google Scholar]
- Chin-Chance C, Polonsky KS, Schoeller DA. Twenty-four-hour leptin levels respond to cumulative short-term energy imbalance and predict subsequent intake. Journal of Clinical Endocrinology and Metabolism. 2000;85:2685–2691. doi: 10.1210/jcem.85.8.6755. [DOI] [PubMed] [Google Scholar]
- Collins S, Kuhn CM, Petro AE, Swick AG, Chrunyk BA, Surwit RS. Role of leptin in fat regulation. Nature. 1996;380:677. doi: 10.1038/380677a0. [DOI] [PubMed] [Google Scholar]
- Considine RV, Sinha MK, Heiman ML, Kriaciunas A, Stephens TW, Myce MR, et al. Serum immunoreactive-leptin concentrations in normal-weight and obese humans. New England Journal of Medicine. 1996;334:292–295. doi: 10.1056/NEJM199602013340503. [DOI] [PubMed] [Google Scholar]
- Dallman MF, Percoraro N, Akana SF, la Fleur SE, Gomez F, Houshyar H, et al. Chronic stress and obesity: A new view of “comfort food”. Proceedings of the National Academy of the Sciences U S A. 2003;100:11696–11701. doi: 10.1073/pnas.1934666100. [DOI] [PMC free article] [PubMed] [Google Scholar]
- Ervin RB. Prevalence of metabolic syndrome among adults 20 years of age and over, by sex, age, race, and ethnicity, and body mass index: United States, 2003-2006. National Health Statistics Report. 2009;13:1–7. [PubMed] [Google Scholar]
- Flegal KM, Carroll MD, Ogden CL, Johnson CL. Prevalence and trends in obesity among U.S. adults, 1999-2000. Journal of the American Medical Association. 2002;288:1723–1727. doi: 10.1001/jama.288.14.1723. [DOI] [PubMed] [Google Scholar]
- Gomez-Merino D, Chennaoui M, Drogou C, Bonneau D, Guezennec C. Decrease in serum leptin after prolonged physical activity in men. Medicine and Science in Sports and Exercise. 2002;34:1594–1599. doi: 10.1097/00005768-200210000-00010. [DOI] [PubMed] [Google Scholar]
- Gomez-Merino D, Drogou C, Chennaoui M, Tiollier E, Mathieu J, Guezennec C. Effects of combined stress during intense training on cellular immunity, hormones, and respiratory infections. Neuroimmunomodulation. 2005;12:164–172. doi: 10.1159/000084849. [DOI] [PubMed] [Google Scholar]
- Guilleminault C, Powell NB, Martinez S, Kushida C, Raffray T, Palombini L, Philip P. Preliminary observations on the effects of sleep time in a sleep restriction paradigm. Sleep Medicine. 2003;4:177–184. doi: 10.1016/s1389-9457(03)00061-3. [DOI] [PubMed] [Google Scholar]
- Gundersen Y, Opstad PK, Reistad T, Thrane I, Vaagenes P. Seven days’ around the clock exhaustive physical exertion combined with energy depletion and sleep deprivation primes circulating leukocytes. European Journal of Applied Physiology. 2006;97:151–157. doi: 10.1007/s00421-006-0150-8. [DOI] [PubMed] [Google Scholar]
- Ikehara S, Iso H, Date C, Kikuchi S, Watanabe Y, Wada Y, Tamakoshi A. Association of sleep duration and mortality from cardiovascular disease and other causes for Japanese men and women: The JACC study. Sleep. 2009;32:295–301. doi: 10.1093/sleep/32.3.295. [DOI] [PMC free article] [PubMed] [Google Scholar]
- Lago R, Gomez R, Lago F, Gomez-Reino J, Gualillo O. Leptin beyond body weight regulation—Current concepts concerning its role in immune function and inflammation. Cellular Immunology. 2008;252:139–145. doi: 10.1016/j.cellimm.2007.09.004. [DOI] [PubMed] [Google Scholar]
- Lauderdale DS, Knutson KL, Rathouz PJ, Yan LL, Hulley SB, Liu K. Cross-sectional and longitudinal associations between objectively measured sleep duration and body mass index: The CARDIA sleep study. American Journal of Epidemiology. 2009;170:805–813. doi: 10.1093/aje/kwp230. [DOI] [PMC free article] [PubMed] [Google Scholar]
- Lloyd-Jones D, Adams R, Carnethon M, De Simone G, Ferguson TB, Flegal K, Wylie-Rosett J. Heart disease and stroke statistics—2009 update: A report from the American Heart Association Statistics Committee and Stroke Statistics Subcommittee. Circulation. 2009;119:480–486. doi: 10.1161/CIRCULATIONAHA.108.191259. [DOI] [PubMed] [Google Scholar]
- Miller MA, Kandala NB, Kivimaki M, Kumari M, Brunner EJ, Lowe GD, Cappuccio FP. Gender differences in the cross-sectional relationships between sleep duration and markers of inflammation: Whitehall II study. Sleep. 2009;37:857–864. [PMC free article] [PubMed] [Google Scholar]
- Mullington JM, Chan JL, Van Dongen HPA, Szuba MP, Samaras J, Price NJ, Mantzoros CS. Sleep loss reduces diurnal rhythm amplitude of leptin in healthy men. Journal of Neuroendocrinology. 2003;15:851–854. doi: 10.1046/j.1365-2826.2003.01069.x. [DOI] [PubMed] [Google Scholar]
- National Sleep Foundation [Retrieved June 28, 2007];1997 Sleep in America poll. 1998 from www.sleepfoundation.org.
- National Sleep Foundation [Retrieved June 28, 2007];2005 Sleep in America poll. 2006 from www.sleepfoundation.org.
- Nedeltcheva AV, Kilkus JM, Imperial J, Kasza K, Schoeller DA, Penev PD. Sleep curtailment is accompanied by increased intake of calories from snacks. American Journal of Clinical Nutrition. 2009;89:1–8. doi: 10.3945/ajcn.2008.26574. [DOI] [PMC free article] [PubMed] [Google Scholar]
- Nindl BC, Rarick KR, Castellani JW, Tuckow AP, Patton JF, Young AJ, Montain SJ. Altered secretion of growth hormone and leutenizing hormone after 84h of sustained physical exertion superimposed on caloric and sleep restriction. European Journal of Applied Physiology. 2006;100:120–128. doi: 10.1152/japplphysiol.01415.2004. [DOI] [PubMed] [Google Scholar]
- Rosenbaum M, Pietrobelli A, Vasselli JR, Heymsfield SB, Leibel RL. Sexual dimorphism in circulating leptin concentrations is not accounted for by differences in adipose tissue distribution. International Journal of Obesity. 2001;25:1365–1371. doi: 10.1038/sj.ijo.0801730. [DOI] [PubMed] [Google Scholar]
- Saper CB, Chou TC, Elmquist JK. The need to feed: Homeostatic and hedonic control of eating. Neuron. 2002;36:199–211. doi: 10.1016/s0896-6273(02)00969-8. [DOI] [PubMed] [Google Scholar]
- Schiller JS, Martinez M, Barnes P. [Retrieved June 28, 2006];Early release of selected estimates based on data from the 2005 National Health Interview Survey. 2006 from http://www.cdc.gov/nchs/nhis.htm.
- Schmid SM, Dilba B, Halischmid M, Jauch-Chara K, Schultes B. Short-term sleep restriction does not increase spontaneous food intake in normal-weight men. Experimental and Clinical Endocrinology & Diabetes. 2007;115:547–554. [Google Scholar]
- Schmid SM, Hallschmid M, Jauch-Chara K, Born J, Schultes B. A single night of sleep deprivation increases ghrelin levels and feelings of hunger in normal-weight healthy men. Journal of Sleep Research. 2008;17:331–334. doi: 10.1111/j.1365-2869.2008.00662.x. [DOI] [PubMed] [Google Scholar]
- Shea SA, Hilton MF, Orlova C, Ayers RT, Mantzoros CS. Independent circadian and sleep/wake regulation of adipokines and glucose in humans. Journal of Clinical Endocrinology and Metabolism. 2005;90:2537–2544. doi: 10.1210/jc.2004-2232. [DOI] [PMC free article] [PubMed] [Google Scholar]
- Spiegel K, Leproult R, L’Hermite-Baleriaux M, Copinschi G, Penev PD, Van Cauter E. Leptin levels are dependent on sleep duration: Relationships with sympathovagal balance, carbohydrate regulation, cortisol, and thyrotropin. Journal of Clinical Endocrinology and Metabolism. 2004;89:5762–5771. doi: 10.1210/jc.2004-1003. [DOI] [PubMed] [Google Scholar]
- Spiegel K, Tasali E, Penev P, Van Cauter E. Brief communication: Sleep curtailment in healthy young men is associated with decreased leptin levels, elevated ghrelin levels, and increased hunger and appetite. Annals of Internal Medicine. 2004;141:846–850. doi: 10.7326/0003-4819-141-11-200412070-00008. [DOI] [PubMed] [Google Scholar]
- Taheri S, Lin L, Austin D, Young T, Mignot E. Short sleep duration is associated with reduced leptin, elevated ghrelin, and increased body mass index. PLoS Medicine. 2004;1:210–217. doi: 10.1371/journal.pmed.0010062. [DOI] [PMC free article] [PubMed] [Google Scholar]
- Tune GS. Sleep and wakefulness in normal human adults. British Medical Journal. 1968;2:269–271. doi: 10.1136/bmj.2.5600.269. [DOI] [PMC free article] [PubMed] [Google Scholar]
- Uhart M, Chong RY, Oswald L, Lin PI, Wand GS. Gender differences in hypothalamic-pituitary-adrenal (HPA) axis reactivity. Psychoneuroendocrinology. 2006;31:642–652. doi: 10.1016/j.psyneuen.2006.02.003. [DOI] [PubMed] [Google Scholar]
- van Leeuwen WMA, Lehto M, Karisola P, Lindholm H, Luukkonen R, Sallnen M, Alenius H. Sleep restriction increases the risk of developing cardiovascular diseases by augmenting proinflammatory responses through IL-17 and CRP. PLoS One. 2009;4:e4589. doi: 10.1371/journal.pone.0004589. doi:4510.1371/journal.pone.0004589. [DOI] [PMC free article] [PubMed] [Google Scholar]
- Vgontzas AN, Lin H-M, Calhoun S, Vela-Bueno A, Chrousos GP, Bixler EO. Short sleep duration and obesity: The role of emotional stress and sleep disturbances. International Journal of Obesity. 2008;32:1–9. doi: 10.1038/ijo.2008.4. [DOI] [PubMed] [Google Scholar]
- Willie JF, Chemelli RM, Sinton CM, Yanagisawa M. To eat or sleep? Orexin in the regulation of feeding and wakefulness. Annual Review of Neurocience. 2001;24:429–458. doi: 10.1146/annurev.neuro.24.1.429. [DOI] [PubMed] [Google Scholar]
- Zellner DA, Loaiza S, Gonzalez Z, Pita J, Morales J, Pecora D, Wolf A. Food selection changes under stress. Physiology & Behavior. 2006;87:789–793. doi: 10.1016/j.physbeh.2006.01.014. [DOI] [PubMed] [Google Scholar]
- Zhang Y, Proenca R, Maffei M, Barone M, Leopold L, Friedman JM. Positional cloning of the mouse obese gene and its human homologue. Nature. 1994;372:425–432. doi: 10.1038/372425a0. [DOI] [PubMed] [Google Scholar]