Abstract
Size exclusion chromatography (SEC) is the most commonly used method to separate and quantify monoclonal antibody (mAb) size variants. MAb-A is an IgG1 subtype humanized monoclonal antibody recombinantly produced in Chinese hamster ovary (CHO) cells. SEC analysis of MAb-A resolved a peak, named Peak 1, which elutes between monomer and dimer peaks. MAb-A lots produced from different clones and production scales all have 0.2–0.3% of SEC Peak 1. Electron spray ionization—time of flight mass spectrometry (ESI-TOF MS), microfluidics capillary electrophoresis and sodium dodecyl sulfate-PAGE (SDS PAGE) results demonstrated that SEC Peak 1 contains two structural variants: MAb-A with one extra light chain (2H3L) and MAb-A with two extra light chains (2H4L). The C-terminal Cys of the extra light chain in Peak 1 variants is either a free thiol, capped by glutathione, cysteine, or another light chain. Both electrophoresis and LC/MS analyses of non-reduced and reduced samples suggested that the extra light chains are linked to the MAb-A light chain through disulfide bonds. Isolated SEC Peak 1 fraction had a potency of 50% relative to MAb-A reference material. The 50% potency loss may result from the reduced accessibility to the antigen-binding site caused by the extra light chain(s)’ steric hindrance.
Keywords: monoclonal antibody, antibody size variant, triple light chain antibody variant, light chain dimer, antibody high molecular weight species, Size Exclusion Chromatography
Introduction
Recombinantly produced monoclonal antibody (mAb) products usually contain size variants (e.g., aggregates, fragments) that are generated during manufacture and storage.1-3 Because aggregates and fragments may potentially affect immunogenicity and potency, their levels are typically monitored during lot release, stability, and characterization.4-6
Size exclusion chromatography (SEC) separates size variants primarily based on the hydrodynamic volume of the molecules.7 Antibody size variants are typically monitored with SEC under native conditions. A typical SEC profile shows clear separations between aggregates, antibody monomer, and fragments.2,3 Therefore, SEC is a widely used method for quality control and characterization of antibody therapeutics. Since the amount of light scattered is directly proportional to the product of the weight-average molar mass and the macromolecule concentration, SEC coupled with multi-angle laser light scattering (SEC-MALS) has been used to characterize the molecular mass of individual species, size distribution within the peaks, and extent of aggregation and degradation as evidenced by molecular weight increase or reduction and the change in monomer amount.8,9
Sodium dodecyl sulfate PAGE (SDS PAGE) is a traditional technique used to separate different size proteins according to their electrophoretic mobility differences.10 In 1999, a novel platform based on microfluidics technology with LabChip, the Agilent 2100 Bioanalyzer, was introduced to convert qualitative SDS-PAGE to quantitative electropherogram.11,12, Protein samples labeled with a fluorescence dye prior to the on-chip analysis using High Sensitivity Protein 250 Kit have a linear dynamic range of four orders of magnitude, enabling quantitation of resolved size variants.13
SEC-MALS and gel electrophoresis provide only rough estimations of molecular mass. For more accurate data, electron spray ionization—time of flight mass spectrometry (ESI-TOF MS) can be used to obtain the mass of an intact antibody with an accuracy better than 25 ppm.14,15
MAb-A is a recombinant IgG1 subtype humanized monoclonal antibody produced in CHO cells. Common antibody high molecular weight size variants include dimer, trimer, and tetramer. MAb-A lots produced from different clones and production scales all contain an unusual SEC peak that elutes between MAb-A monomer and dimer. The methods described above were used to characterize this size variant peak and demonstrated that this peak contains MAb-A with one and two extra light chains. This report summarizes the characterization results and proposed structures of these unusual variants.
Results
SEC and SEC-MALS analyses of MAb-A
SEC analysis of MAb-A was used as a characterization and quality control method. Overlaid SEC-UV traces of a typical IgG1 monoclonal antibody (IgG1 mAb), and Lots A, B, and reference material (Ref) of MAb-A are shown in Figure 1. MAb-A Lot A was produced at 400 L scale, while Lot B was produced at 2,000 L scale using slightly different process parameters. As shown in Figure 1, the SEC UV trace of the IgG1 mAb shows a dimer peak and a monomer peak; however, SEC UV traces of the MAb-A lots show dimer and monomer peaks, but also have an unusual peak, Peak 1, that elutes between MAb-A monomer and dimer peaks and is present at approximately 0.2–0.3%. Peaks between 21−25 min are sample formulation buffer components, and their peak profile difference was caused by differences in the formulation buffer. Figure 2 shows the overlaid SEC UV trace with the calculated molar mass by MALS. Based on the MALS calculated results, the molar mass of MAb-A monomer is approximately 1.3 × 10⁵ g/mole, the dimer molar mass is about 3.0 × 10⁵ g/mole, while the Peak 1 has a molar mass in the range of 1.6–2.0 × 10⁵ g/mole. Both SEC and SEC-MALS results suggest that Peak 1 contains a species that is larger than MAb-A monomer, but smaller than MAb-A dimer.
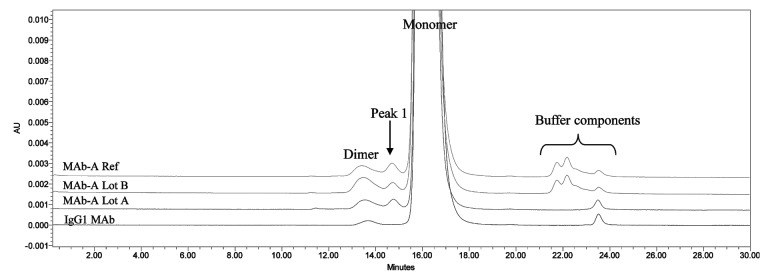
Figure 1. Overlaid SEC UV traces of an IgG1 mAb and three lots of MAb-A materials shown in expanded scale to enable visualization of small peaks. IgG1 mAb sample has a typical SEC profile, while MAb-A contains an unusual peak, labeled Peak 1.
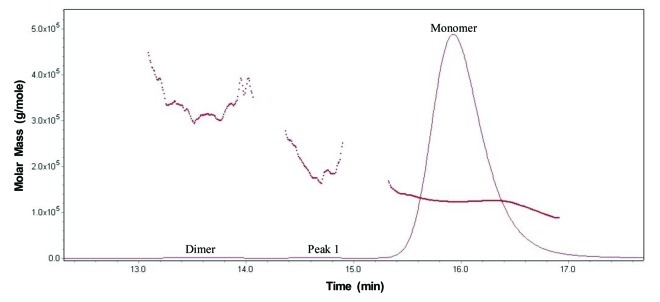
Figure 2. Overlaid SEC UV trace (____) with MALS calculated molar mass (…….) of MAb-A reference material.
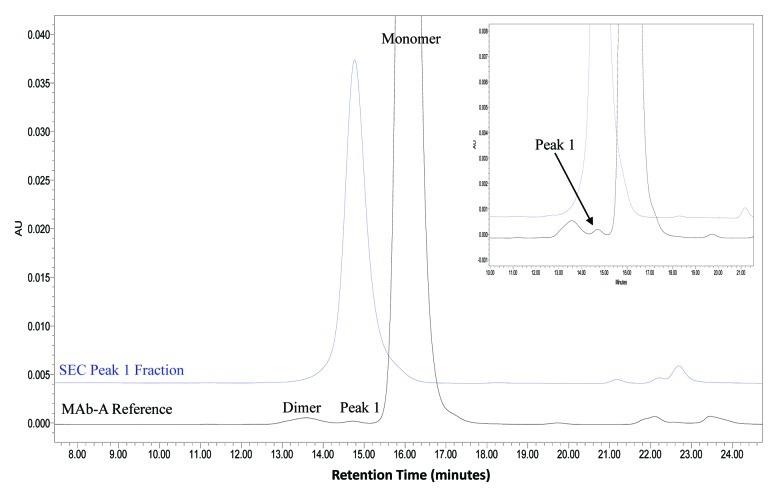
To characterize SEC Peak 1, the SEC Peak 1 fractions were collected, concentrated, and analyzed. The purified Peak 1 fractions were > 90% purity as determined by SEC (Fig. 3). These Peak 1 fractions were characterized by ESI-TOF MS, Bioanalyzer, SDS PAGE, and peptide map analyses. SEC Main peak (the monomer) was also collected and analyzed side-by-side with SEC Peak 1 for comparison.
Figure 3. Overlaid chromatograms of MAb-A reference material and a purified SEC Peak 1 fraction shown in full scale and expanded scale in insert.
ESI-TOF MS analysis of SEC Peak 1
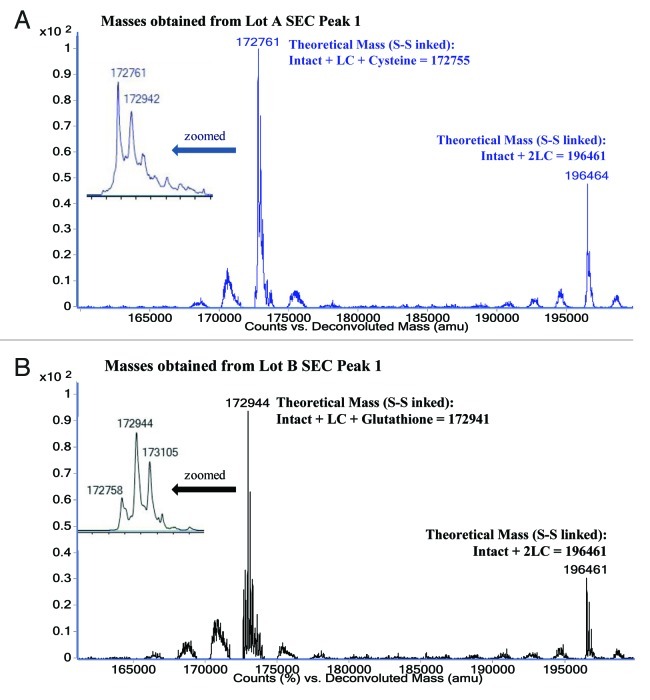
The intact mass of MAb-A SEC Peak 1 from Lots A and B were analyzed with ESI-TOF MS. After deconvolution the non-reduced SEC Peak 1 from Lot A shows two major masses of 172761 Da and 196464 Da (Fig. 4A), and the non-reduced SEC Peak 1 of MAb-A Lot B shows two major masses of 172941 Da and 196461 Da (Fig. 4B). When the reduced SEC Peak 1 fractions were analyzed, only heavy chain and light chain were observed (data not shown). The theoretical MAb-A average intact mass (2H2L with G0F glycan, asialo-, agalacto-, biantennary, core-substituted with fucose) is 148809 Da, and its theoretical light chain (LC) average mass is 23826 Da when cysteine thiols are in the disulfide form. The theoretical mass of the intact antibody plus 2 light chains is 196461 Da, which correlates very well with the measured mass of the larger species observed in both Lot A and Lot B (Table 1). The theoretical mass of intact antibody plus 1 light chain is 172635 Da, which is 126 Da less than Lot A major mass 172761 Da and 306 Da less than Lot B major mass 172941 Da. MAb-A light chain contains 5 cysteinyl residues (Cys, or C) and four of them form two intra-chain disulfide bonds, therefore the 5th Cys could link to a free Cys (adding 121 Da) or glutathione (GSH, adding 307Da). Table 1 shows the comparison of theoretical masses and observed masses of Peak 1 in MAb-A Lot A and Lot B. The ESI-TOF MS results suggest that SEC Peak 1 contains MAb-A with 1 and 2 extra light chains (2H3L or 2H4L). The 2H3L variants in Lot A and Lot B had different major masses because one of five light chain cysteines was capped by Cys or GSH at different levels, which may be caused by cell culture media composition variability. The masses of 2H4L with mono- and di-galactosylated glycans were observed. No masses of 2H4L+ Cys and 2H4L+GSH were found.
Figure 4. ESI-TOF Deconvoluted masses and theoretical masses for A) MAb-A Lot A SEC Peak 1 fraction and B) MAb-A Lot B SEC Peak 1 fraction.
Table 1. Comparison of theoretical masses with ESI-TOF MS observed masses.
| Composition | Theoretical mass (Da) | Observed masses in Lot A Peak 1 (Da) | Observed masses in Lot B Peak 1 (Da) |
|---|---|---|---|
| Intact MAb-A 2H2L |
148809 |
|
|
| 2H3L+Cys |
172755 |
172761 (major) |
172758 |
| 2H3L+GSH |
172941 |
172942 |
172941 (major) |
| 2H3L+GSH+Hexose |
173103 |
|
173105 |
| 2H4L | 196461 | 196464 | 196461 |
L (S-S linked): 23826 Da, Cys: 121 Da, GSH: 307 Da. The intact mass of 148809 Da is the MAb-A containing G0F glycan (asialo-, agalacto-, biantennary, core-substituted with fucose).
CE-SDS and SDS PAGE analyses of SEC Peak 1
The SEC Peak 1 purified from MAb-A Lot B was analyzed using Agilent 2100 Bioanalyzer with High Sensitivity Protein 250 Kit. This CE-SDS Bioanalyzer method can determine the approximate size of the proteins and provide relative abundance of each component. If the SEC Peak 1 contains 2H3L and 2H4L, then the reduced CE-SDS should give higher relative percentage of light chain than that of the 2H2L form.
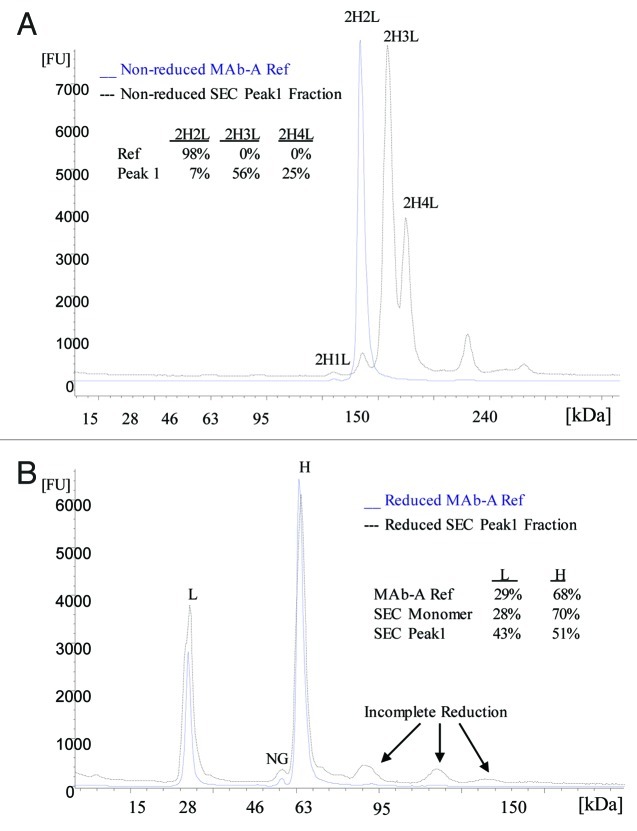
Similar to ESI-TOF MS, the electropherogram of non-reduced SEC Peak 1 fraction also shows two major peaks with calculated molecular weights of 175 kDa and 191 kDa, which are the approximate sizes of 2H3L and 2H4L, respectively (Fig. 5A). Figure 5A also shows the relative percentages of major peaks in MAb-A reference material (Ref) and SEC Peak 1 sample. Typically, when analyzed with Agilent 2100 Bioanalyzer using Protein 250 Kit, the MAb-A Ref and MAb-A final purified bulk samples contain one major peak—the MAb-A monomer 2H2L, 1% of 2H1L, and < 1% of other fragments and high molecular weight species, but no clear peaks at 2H3L or 2H4L region. MAb-A Lot B SEC Peak 1 fraction contains two major peaks, 56% of 2H3L and 25% of 2H4L, and it also contains 7% 2H2L and < 10% high molecular weight species. The high molecular weight species were probably caused by MAb-A dimer that was incompletely separated from Peak 1 on SEC and aggregates formed during Peak 1 fraction collection and concentration. As shown in Figure 5B, the electropherogram of reduced SEC Peak 1 fraction contains mainly light chain and heavy chain. The MAb-A Ref and SEC monomer peak fraction contain about 30% of light chain and 70% of heavy chain; however, the Lot B SEC Peak 1 fraction contains 43% of light chain and 51% heavy chain. The increased relative percentage of light chain in SEC Peak 1 fraction demonstrates that SEC Peak 1 contains more light chain than regular MAb-A monomer.
Figure 5. Electropherograms of non-reduced (A) and reduced (B) MAb-A reference material (Ref) and SEC Peak 1 fraction obtained using Agilent 2100 Bioanalyzer with Protein 250 Kit. NG: non-glycosylated heavy chain.
MAb-A bulk samples analyzed using non-reduced SDS PAGE contain two minor bands migrating just above the monomer band, which are not typically seen in IgG molecules. Non-reduced SEC Peak 1 fraction from Lot B contains two bands that match the two minor bands right above the monomer (2H2L) band in MAb-A bulk samples, marked as 2H3L and 2H4L in Figure 6. Only H and L were observed in reduced SEC Peak 1 fraction (Fig. 6). The band above 2H4L in non-reduced samples and the bands above H in reduced samples are related to the level of aggregates in the sample. SEC monomer fraction presumably contains higher aggregates due to the buffer-exchange and concentration process after fraction collection. The SEC monomer fraction (Lane 8) does not have detectable 2H3L and 2H4L bands, demonstrating the removal of Peak 1 species upon fraction collection. When Peak 1 fraction was loaded at 0.05 μg (1% of 5 μg) and 0.015 μg (0.3% of 5 μg) on the gel, the intensities of the 0.015 μg Peak 1 bands are very similar to the intensities of 2H3L and 2H4L bands in 5 μg Lot B, which is consistent with SEC results of 0.2–0.3% of Peak 1. These observations demonstrate that SDS PAGE is able to detect and resolve 2H3L and 2H4L species in MAb-A bulk materials and SDS PAGE results are consistent with the results of SEC, CE-SDS and ESI-TOF.
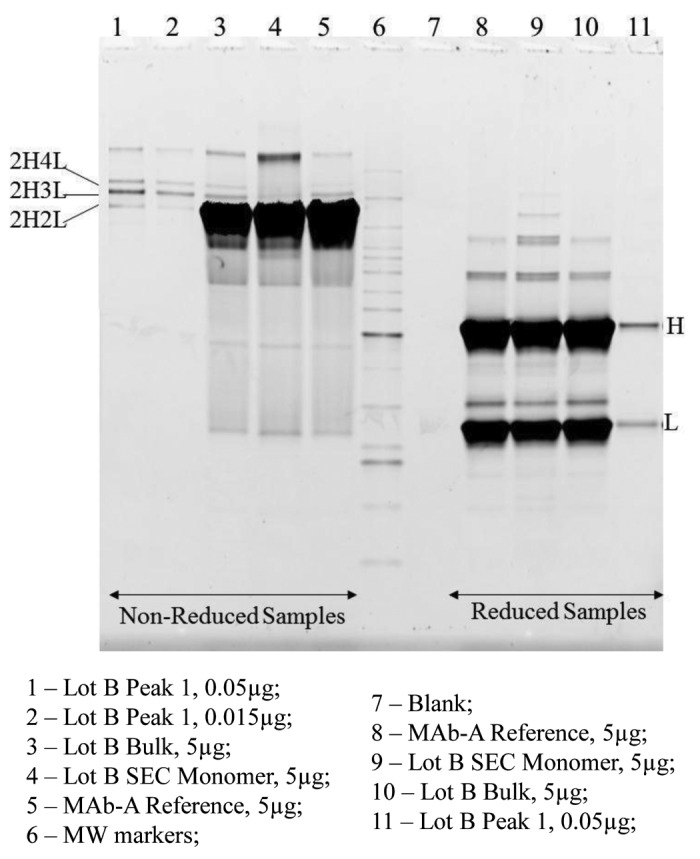
Figure 6. SDS PAGE Sypro Ruby stained gel image of non-reduced and reduced MAb-A samples, SEC monomer and Peak 1 fractions.
Peptide mapping and LC/MS/MS analyses
Because the above experiments demonstrated that MAb-A peak 1 contains extra light chains and the linkage between the extra light chains and MAb-A appears to be through disulfide bonds, LC/MS/MS analysis was conducted to confirm the presence of extra light chains in Peak 1 and locate the linkage site of the extra light chains. Both non-reduced and reduced samples were analyzed in the same sequence. Peptides without disulfide bonds were identified by matching their observed mass with theoretical mass, and then confirmed by their MS/MS fragmentation pattern. Peptides containing disulfide bonds were identified by matching their observed mass with theoretical mass, then confirmed by their disappearance upon reduction of the digested sample using Tris (2-carboxyethyl) phosphine hydrochloride (TCEP).
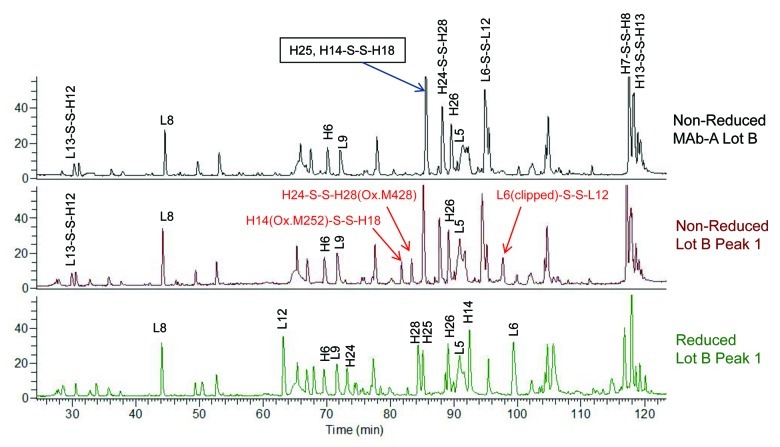
Figure 7 shows the overlaid total ion chromatograms (TIC) of Lys-C peptide maps of non-reduced MAb-A Lot B, non-reduced MAb-A Lot B Peak 1, and reduced Lot B Peak 1. As indicated by arrows, non-reduced Peak 1 sample contains three peaks that are significantly higher than those in non-reduced MAb-A Lot B. Two of those peaks contain oxidized methionine residues M252 and M428 of heavy chain. M252 and M428 are susceptible to oxidation as they located at the solvent-exposed CH2-CH3 interface,16 and the higher levels of oxidized M252 and M428 in Peak 1were probably generated during fraction collection and concentration. The peak containing clipped L6 was unexpected, and the broken peptide bond was between arginine and glutamic acid. All three peaks are disulfide linked peptides and they are not in the reduced Peak 1 TIC.
Figure 7. Overlaid total ion chromatograms (TIC) of Lys-C peptide maps of non-reduced MAb-A Lot B, non-reduced Lot B Peak 1, and reduced Lot B Peak 1. H14(Ox.M252)-S-S-H18 is the disulfide linked heavy chain peptide containing oxidized methionine 252 (Ox. M252). H24-S-S-H28(Ox.M428) is the disulfide linked heavy chain peptide containing oxidized methionine 428 (Ox. M428). L6(clipped)-S-S-L12 is the disulfide linked light chain peptide containing a non-specific clip.
To compare the relative levels of peptides between Peak 1 fraction and unfractionated MAb-A, the normalized extracted ion chromatogram (EIC) peak areas of several peptides and their ratios between the same peptides in Lot B Peak 1 fraction and unfractionated MAb-A Lot B (Peak 1/MAb-A) were calculated (Table 2). The peptides used for this comparison are expected light chain and heavy chain peptides with masses in the range of 1,000−3,000 Daltons and expected disulfide linked peptides with masses < 8,000 Daltons. Peptide H25 was used for normalization because H25 has length and peak area comparable to many peptides of interest. After normalization to heavy chain peptide H25, the peak area ratios of both H6 and H26 between Peak 1 and MAb-A were equal to 1.0, whereas the peak area ratios of light chain peptides L5, L8 and L9 between Peak 1 and MAb-A were 1.4, 1.3 and 1.5, respectively. The ratio of the expected inter-chain disulfide bond linked light chain C-terminal peptide L13 (at C218) and H12 (at C220) was also 1.0, which suggests that all heavy chain C220 are correctly linked to light chain C218. The ratios of intra-heavy chain disulfide linked peptides were in the range of 0.9–1.0. The ratio of sums of expected intra-light chain disulfide linked peptide L6-S-S-L12 and L6 (clipped)-S-S-L12 was 1.5. Although the method has some inherent variability, the overall results show that Peak 1 fraction contains a higher level of light chain, which is consistent with the predicted 2H3L and 2H4L structures. The area ratios of the disulfide containing peptides in both heavy chain and light chain variable domains in Lys-C peptide maps were not calculated because their signals were low due to their high masses (> 9,500 Daltons) and low recoveries.
Table 2. Comparison of peptides’ EIC peak areas of Lys-C digested non-reduced MAb-A Lot B and Lot B Peak 1 Fraction.
| Peptidea | Normalizedb peak area |
||
|---|---|---|---|
| MAb-A Lot B | Lot B Peak 1 |
Peak 1/ MAb-A |
|
| H25 |
1.00 |
1.00 |
1.0 |
| H6 |
1.61 |
1.60 |
1.0 |
| H26 |
1.83 |
1.81 |
1.0 |
| L5 |
1.70 |
2.40 |
1.4 |
| L8 |
0.90 |
1.20 |
1.3 |
| L9 |
1.22 |
1.80 |
1.5 |
| H7-S-S-H8 |
1.28 |
1.31 |
1.0 |
| H13-S-S-H13 (inter-chain) |
0.15 |
0.14 |
0.9 |
| H14-S-S-H18 |
1.01 |
0.78 |
1.0 c |
| H14(ox.M252)-S-S-H18 |
0.02 |
0.22 |
|
| H24-S-S-H28 |
0.50 |
0.41 |
|
| H24-S-S-H28(ox.M428) |
0.01 |
0.11 |
1.0 c |
| L13-S-S-H12 (inter-chain) |
0.58 |
0.57 |
1.0 |
| L6-S-S-L12 |
0.91 |
1.01 |
|
| L6(clipped)-S-S-L12 | 0.00 | 0.33 | 1.5c |
a H, heavy chain, L, light chain, -S-S-, disulfide linked peptides. bNormalized by dividing the peak area of peptide H25 in the same sample. cThe ratio of sums of expected and oxidized or clipped peptides.
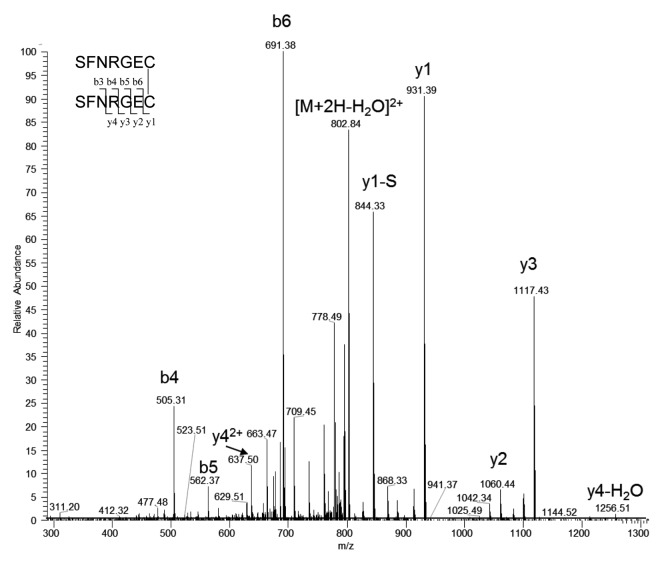
After an extracted ion mass search for all possible light chain C-terminal L13 disulfide linked peptides, besides the expected disulfide-linked peptide L13-S-S-H12, the only unexpected disulfide-linked peptides at > 1% level observed was L13-S-S-L13, two C-terminal light chain peptides linked through a disulfide bond. Figure 8 shows the tandem mass spectrum of the precursor ion of doubly charged -S-S- linked L13 peptides SFNRGEC- SFNRGEC at m/z 811.33. Because the MAb-A and Peak 1 samples were treated with NEM before Lys-C digestion, almost all free thiols were capped with NEM. Low levels of L13-NEM were observed in both MAb-A and Peak 1 fraction. Expected masses that correspond to both disulfide-linked L13-S-S-Cys and L13-S-S-GSH were also observed. Table 3 lists the ratios of EIC peak areas of different L13 forms relative to the expected disulfide linked L13-S-S-H12. Because different L13 forms have different compositions and ionization properties, the relative ratios may be different from their true relative abundance. Expected masses that correspond to both disulfide-linked H12 with Cys or GSH were not observed. These findings suggested that Peak 1 fraction contains extra light chains and the -SH at C218 of the extra light chains could be capped by Cys, GSH or another light chain.
Figure 8. Tandem mass spectrum of the precursor ion of doubly charged disulfide linked L13-S-S-L13 at m/z 811.33. y1-S is the y1 ion without N-terminal serine.
Table 3. Relative EIC peak areas of different forms of light chain C-terminal peptide in non-reduced MAb-A and Peak 1 fraction.
| Peptidea | Extracted ion M2H+ |
Relative EIC peak area (%)b |
|
|---|---|---|---|
| MAb-A Lot B | Lot B Peak 1 | ||
| L13-S-S-H12 |
631.25 |
100 |
100 |
| L13-S-S- L13 |
811.33 |
0.1 |
16.5 |
| L13-S-S-GSH |
559.21 |
0.2 |
9.9 |
| L13-S-S-Cys |
466.17 |
0.0 |
4.9 |
| L13-NEM |
469.19 |
0.5 |
1.1 |
| L13 |
406.67 |
0.0 |
0.0 |
| Sum | 100.8 | 132.4 | |
a The samples were treated with NEM and digested with Lys-C. L13, light chain N-terminal peptide with Cys at the N-terminus; -S-S-, disulfide link. bNormalized by dividing the peak area of peptide L13-S-S-H12 in the same sample.
Potency of SEC Peak 1
Sigmoidal shape dose-response curves, fluorescence absorbance units (proportional to the amount of live cell at the end of incubation) vs. MAb-A concentrations, were generated for potency determination. The slope differences between reference material and samples were ≤ 2%. The MAb-A concentration ratio between sample and reference material at 50% effective dose was used for sample potency determination. The potency test results of MAb-A Lot B, Lot B SEC monomer and Peak 1 fractions are listed in Table 4. The Lot B and its SEC monomer fraction had average potencies of 100% and 99%, respectively. SEC Peak 1 fraction had an average potency of 50%.
Table 4. Potency test results of SEC monomer and peak 1 fractions collected from MAb-A Lot B.
| Sample description | Relative potency (%) |
||
|---|---|---|---|
| Replicate 1 | Replicate 2 | Average | |
| MAb-A Lot B |
100.9 |
99.6 |
99 |
| MAb-A SEC Monomer Peak |
101.8 |
97.6 |
100 |
| MAb-A SEC Peak 1 | 49.4 | 50.2 | 50 |
Discussion
Size-based characterizations
This study used SEC, MALS, ESI-TOF MS, CE-SDS, and SDS PAGE for characterization of an unusual SEC peak referred to here as Peak 1. SEC and MALS suggested the size of Peak 1 is between monomer and dimer, and has an approximate mass of 160–200 kDa. The non-reduced Peak 1 analyses using ESI-TOF MS, CE-SDS, and SDS PAGE all demonstrated that Peak 1 contains two major species. The reduced Peak 1 analyses using ESI-TOF MS, CE-SDS, and SDS PAGE all show that Peak 1 contains only MAb-A heavy chains and light chains, and the relative peak areas obtained by the Agilent 2100 Bioanalyzer gave L:H ratios of 1.0:1.2 (43% L and 51% H) for Peak 1 and 1.0:2.3 (29% L and 68% H) for the reference material. Based on the accurate masses obtained from ESI-TOF, the two major species agree with 2H4L and 2H3L with either a Cys or GSH linked through S-S bonds. Further peptide map LC/MS analysis demonstrated the presence of Cys or GSH-linked light chain C-terminal peptides. All the results are consistent and complementary.
Potency of SEC Peak 1
The potency value of MAb-A materials are determined as the ability to prevent cell killing relative to the MAb-A reference material. MAb-A binds a soluble antigen, thereby preventing the antigen from binding to the cell surface receptor and inducing cell killing. Studies of the isolated MAb-A Fab fraction from papain-treated MAb-A show the Fab alone can bind MAb-A’s antigen and prevent cell-killing in the cell-based potency assay (data not shown). Therefore, each intact MAb-A molecule can bind two antigens because it has two Fab regions. The SEC Peak 1 fraction had 50% relative potency, which implies that one of the two Fab regions lost antigen-binding ability. The loss of Fab region antigen-binding ability of SEC Peak 1 may be caused by the steric hindrance of extra light chain(s) to the binding site.
Potential linkage of the extra light chains
A recombinant IgG1 antibody contains two heavy chains and two light chains that are linked through disulfide bonds. The arrangement of the IgG1 intra-chain and inter-chain disulfide bonds were first established by Edelman et al.17 MAb-A antibody light chain contains 5 cysteines—C23, C92, C138, C198 and C218. Normally, C23-C92 and C138-C198 form intra-chain disulfide bonds, while light chain C218 links to heavy chain C220 to form an inter-chain disulfide bond. ESI-TOF MS, Agilent 2100 Bioanalyzer, and SDS-PAGE analysis results demonstrate that the SEC Peak 1 contains two variants, 2H3L and 2H4L. When treated with disulfide bond reducing agents TCEP or DTT, both 2H3L and 2H4L reduced to H and L. Therefore, the extra light chains in 2H3L and 2H4L are very likely linked to the antibody monomer (2H2L) through disulfide bond(s). To identify the cysteine residue(s) that formed disulfide bonds to the extra light chain(s), LC/MS analyses of both non-reduced and reduced peptide maps were conducted.
The levels of free thiols were determined using NEM pre-treated peptide map. When MAb-A samples were treated with NEM during denaturation, LC/MS results of TECP reduced samples showed that all EIC peak areas of NEM-labeled Cys-containing peptides were < 5% of the EIC peak areas of their corresponding free thiol containing peptides. Specifically, the free thiol levels at C23, C92, C138, C198, and C218 were all < 1%.
Based on the Bioanalyzer results in Figure 5A, SEC Peak 1 contains 56% of 2H3L, 25% of 2H4L, and about 19% of 2H2L, 2H1L and aggregates. Therefore, the average L:H ratio of Peak 1 fraction should be approximately 1.5.
C138 and C198 are in Lys-C peptides L6 and L12, respectively. Although the clipped L6 was observed in Peak 1, the ratio of disulfide linked C138-C198 containing peptides between Peak 1 and MAb-A Lot B was 1.5, which is consistent with the relative ratios of L5, L8, and L9 between Peak 1 and MAb-A Lot B. Therefore, C138 and C198 appear to have the correct disulfide linkage.
Light chain C218 is the C-terminal amino acid of light chain and is in Lys-C peptide L13. The light chain C218 normally links to heavy chain C220 in Lys-C peptide H12 to form the inter-chain disulfide bond. It is known that, among all the disulfide bonds in IgG1, the disulfide bonds between light chain and heavy chain are the most susceptible to scrambling under stressed conditions.18,19 The LC/MS analyses show that the inter-chain peptide L13-S-S-H12 had relative ratio of 1.0 between Peak 1 and Lot B bulk material (Table 2), which suggests that all heavy chain C220 is correctly linked to light chain C218. Extracted ion mass search results showed that except for the expected disulfide-linked peptides L13-S-S-H12 and unexpected disulfide-linked peptides L13-S-S-L13, no other Cys-containing peptides were linked to L13 at > 1% level in Peak 1 fraction. The relative EIC peak areas of the peptides L13-S-S-L13, L13-S-S-GSH, and L13-S-S-Cys in Peak 1 fraction were 16.5%, 9.9% and 4.9%, respectively, relative to the expected peptide L13-S-S-H12. The sum of L13-containing peptides is 100.8% in MAb-A Lot B and the sum of L13-containing peptides is 132.4% in Peak 1 fraction. The ratio of L13-containing peptides between peak 1 and MAb-A Lot B was 1.3, which is consistent with the relative ratios of L5, L8 and L9. The above results demonstrated that light chain C218 is extensively modified in Peak 1 compared with MAb-A reference material. LC C218 is potentially involved in the addition of the extra light chain in Peak 1.
C23 and C92 are in Lys-C peptides L1 and L3, respectively. The peptide L1-S-S-L3 has a molecular weight of 11. Three kDa; it was thus not detected in the Lys-C map. The C23-C92 disulfide bond linked tryptic peptide has a molecular weight of 4.5 kDa and was detected in trypsin digested samples; however, the H25 normalized EIC ratio of C23-C92 linked tryptic peptides between Peak 1 and MAb-A Lot B was only 0.66 (tryptic digestion results are not included in Table 2). This lower than expected level of C23-C92 disulfide linked peptide in Peak1 fraction is inconsistent with other LC peptides, potentially due to incomplete digestion. We speculate that the extra light chain is linked through the variable region, which results in a very compact structure that limits protease accessibility to the cleavage sites; therefore relative low ratio of C23-C92 peptide was observed in Peak1.
The experimental results suggest that the formation of 2H3L and 2H4L is related to disulfide linkage. The potential linkage sites appear to be related to C23 and C92 in the variable region.
Formation of 2H3L and 2H4L
Hundreds of humanized antibody molecules have been produced in the past 20 y. To the authors’ knowledge, with the exception of THIOMABs20 antibodies engineered to contain an additional cysteine, mAbs with 2H3L and 2H4L structures from conventional cell culture process have not been reported. The levels of SEC Peak 1 are in the range of 0.2–0.3% in the MAb-A materials produced from different cell lines, clones from different transfections, different cell culture media and process parameters. This suggests that the formation of 2H3L and 2H4L is probably related to the molecule’s sequence.
During mAb production by CHO cells, affinity purification of light chain containing polypeptides using Protein L adsorbent showed progressive accumulation of free light chain and light chain dimer.21 Stevens et al. reported that amino acids in complementary-determining regions (CDRs) influence light chain dimerization, which is mediated by hydrogen bonds and van der Waals contacts.22 The variable region, more specifically the CDR3, appears to be responsible for the variation of light chain dimerization constant. Dimerization properties of light chains of known sequence suggest that the presence of an aromatic or hydrophobic residue at position 96 enhances dimer formation, whereas the presence of a charged residue at position 96 results in light chains remaining stable monomers.23 Because MAb-A has a tryptophan at its light chain 96 position, it may have more tendency to form light chain dimer. The higher tendency of dimer formation due to the aromatic tryptophan at position 96 is consistent with predicted potential linkage sites of C23 and C92.
Immunoglobulin covalent bond assembly proceeds primarily through a heavy chain dimer intermediate and thereafter a consecutive assembly of two light chains.21 When the heavy chain dimer binds to two light chain monomers, then 2H2L is formed. If the heavy chain dimer links to 1 light chain monomer and 1 light chain dimer, then 2H3L is formed. If the heavy chain dimer links to 2 light chain dimers, then 2H4L forms. Since the extra light chain prevents the Fab from binding antigen, the 2H4L with two light chain dimers should not have any potency. The 50% potency result of Peak 1 implies that one of the two Fab arms is normal and the other arm may have 3 light chains. If the light chain dimer is linked through C23 and C92 and one light chain C218 links to heavy chain H220, then the other LC C218 could be a free thiol, disulfide linked to Cys, GSH, or C218 of another LC. If the C218 of a light chain dimer links to C218 of another light chain, 2H4L structure forms. The proposed 2H3L and 2H4L structures are shown in Figure 9.
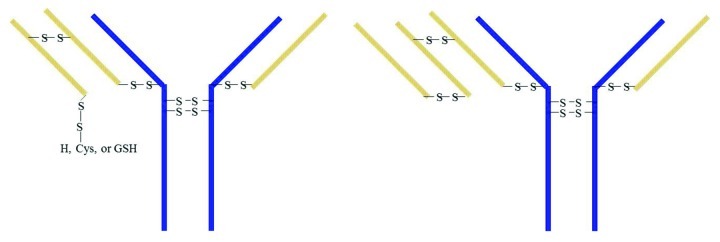
Figure 9. Proposed major structures of SEC Peak 1 components through proposed disulfide linkages (structures due to non-specific binding in LC variable region are not shown). The blue lines represent heavy chains and the orange lines represent light chains.
Conclusions
ESI-TOF MS, Bioanalyzer, and SDS PAGE all demonstrated that MAb-A SEC Peak 1 contains two size variants: the MAb-A with one extra light chain (2H3L) and the MAb-A with two extra light chains (2H4L). The -SH on the extra light chain C-terminal Cys could be free thiol, or capped by glutathione, cysteine, or another light chain; and their relative quantities in Peak 1 are related to cell culture redox environment. The addition of light chains in MAb-A monomer has been demonstrated to be related to disulfide bonds.
In a cell-based potency assay, SEC Peak 1 had 50% potency relative to MAb-A reference material. This decreased potency is presumably due to steric hindrance of the extra light chains in 2H3L or 2H4L and suggests that SEC Peak 1 may have reduced biological activity. Therefore, the level of SEC Peak 1 should be controlled.
Materials and Methods
Materials
Recombinant IgG1 monoclonal antibody MAb-A reference material and Lots A, B and C samples were generated in CHO cells and purified at Genentech. Mono and dibasic potassium phosphate, potassium chloride, calcium chloride, and SDS were obtained from Mallinckrodt. Tris base, TRIS-HCl, sodium bicarbonate, dithiothreitol (DTT), iodoacetamide (IAM), and N-Ethylmaleimide (NEM) were purchased from Sigma. Trifluoroacetic acid (TFA), Tris (2-carboxyethyl) phosphine (TCEP) HCl, urea, and guanidine hydrochloride were obtained from Thermo Fisher. EDTA (EDTA) (disodium, dihydrate) and acetonitrile (HPLC grade) were purchased from J.T. Baker. Formic acid is from EMD Chemicals Inc. Amicon Ultra-15 10,000 MWCO Centrifugal Filter Devices were purchased from Millipore Corporation. Endoproteinase Lys-C and trypsin were obtained from Roche Applied Science.
SEC analysis and fraction collection
SEC was performed on an Agilent 1100 binary pump HPLC system equipped with a TosoHaas TSK G3000SWXL, 7.8 mm ID × 300 mm column (Toso Biosciences). Isocratic flow of a mobile phase consisting of 0.2 M potassium phosphate and 0.25 M potassium chloride (pH 6.2) was at 0.5 mL/min. The separation was conducted at ambient temperature and the column effluent was monitored at 280 nm. MALS analysis of a sample was performed continuously on the SEC column eluate, as it passed through a DAWN-HELEOS MALS photometer (fitted with a solid-state laser operating at 658 nm and a K5-flow cell) in series with an Optilab rEX refractive index detector (both from Wyatt Technologies, Inc.). Data were analyzed using Astra software version 5.3.2.
Same method was used for both sample analysis and fraction collection. For sample analysis, the load was 25 μg; for fraction collection, 1.5 mg of sample (10 μL of 150 mg/mL sample) was injected each run. The collected fractions were pooled and concentrated using Amicon Ultra-15 Centrifugal Filter Devices with 10,000 MWCO membranes.
LC/MS analysis of SEC Main peak and Peak 1
Both non-reduced and reduced SEC Main peak and Peak 1 samples were analyzed with Agilent 6210 electrospray ionization time-of-flight mass spectrometry (ESI-TOF MS) coupled with a nano-Chip-LC-ESI source. The SEC samples were diluted to 0.1 mg/mL with purified water. To reduce the sample, 20 μL of 2 mg/mL TCEP was mixed with 20 μL of the diluted sample and incubated at 60°C for 10 min. About 5 nanograms of proteins were injected onto a custom chip with equivalent analytical column dimension of 43 mm × 75 μm, Zorbax 300SB-C8, 5 μm (Agilent Technologies) for desalting and direct online MS analysis. Mobile phase A and B are 0.1% formic acid in water and 0.1% formic acid in acetonitrile, respectively. A gradient of 25−90% mobile phase B in 7 min was used for the non-reduced samples and a gradient of 10−60% mobile phase B in 7 min was used for the reduced samples with 0.4 μL/min flow rate. The MS spectra were collected at 1 spectrum per second rate, with about 10,000 transients per spectrum. Source capillary gas flow was at 8 L/min and 325°C. Fragmentor voltages of 400 V and 200 V were used for the intact and reduced antibodies, respectively. Molecular masses were derived from multiple charged ions and deconvoluted using the Agilent MassHunter maximum entropy algorithms.
CE-SDS analysis
The CE-SDS analysis was performed on an Agilent 2100 Bioanalyzer using Agilent High Sensitivity Protein 250 Kit. The samples were diluted to 1 mg/mL with labeling reaction buffer (0.1M sodium bicarbonate, pH 8.3). The diluted sample was reacted with labeling dye at ambient temperature for 30 min; then the reaction was stopped by adding ethanolamine (the labeling dye and ethanolamine were provided with the kit). For non-reduced sample analysis, the labeled sample was diluted with 60 mM IAM solution for 25-folds, then mixed with SDS-containing sample buffer and heated at 70°C for 5 min. For reduced sample analysis, the labeled sample was diluted 25-fold with purified water, then mixed with SDS and DTT-containing sample buffer and heated at 70°C for 5 min. The chip preparation was performed according to the manual provided with the kit. Samples were then separated in this chip and detected using a fluorescence detector. The size and relative peak area were calculated using Agilent 2100 Expert software. The graphs in Figure 5 were generated using Agilent ChemStation software with normalization of Y-axis at the highest peak height. The X-axis was labeled based on the position of ladder proteins used in this assay.
SDS-PAGE analysis
Non-reduced samples were denatured by heating at 60°C for 5 min in the presence of SDS and IAM, while reduced samples were heated at 60°C for 15–20 min with SDS and reducing agent DTT. SDS PAGE of the denatured non-reduced and reduced samples were performed on a BioRad 4–12% Bis-Tris gel (1.0 mm × 18 well) using a BioRad Criterion™ Cell, then the bands were visualized by SYPRO Ruby stain. The gel image was generated by a BioRad ChemiDoc XRS system.
Reversed-Phase HPLC and Online Liquid Chromatography-Tandem Mass Spectrometry (LC-MS/MS) analysis
The MAb-A sample was diluted to 20 mg/mL in 100 mM sodium phosphate, pH 7.0 to a final volume of 10 μL. Peak 1 fraction was concentrated to 20 mg/mL. Then 2 μL of 0.1 M NEM and 38 μL of 8 M guanidine HCl were added and the mixture was incubated for 2 h at 37°C. Afterwards, 240 μL of digest buffer (100 mM sodium phosphate, 2 mM EDTA, pH 7.0) was added. Lys-C was added at an enzyme to sample ratio of 1:10 by mass and the sample was incubated overnight at 37°C. To generate reduced sample, 120 μL of the digested sample was mixed with 15 μL of 100 mM TCEP and incubated at room temperature for 30 min. Both the reduced sample and the remaining non-reduced sample were quenched by adjusting the pH to 2 with addition of 10% trifluoroacetic acid solution. Fifty microliters of the non-reduced and reduced sample were injected for analysis by LC/MS/MS. In one experiment, Lys-C digested samples were diluted with 10 mM Tris and further digested with trypsin.
Peptide map analysis was performed on an Agilent 1200 HPLC system using Agilent ZORBAX 300SB-C8 columns. Mobile phase A was water with 0.1% TFA and mobile phase B was acetonitrile with 0.08% TFA. A linear gradient from 0 to 32% B in 106 min with flow rate of 0.2 mL/min was used on a 2.1 mm × 150 mm Zorbax 300SB-C8 (300 Å, 3.5 μm) column. The column temperature was 45°C. Liquid chromatography-mass spectrometry (LC/MS) and LC/MS/MS analyses were performed with Thermo Fisher Scientific LTQ Orbitrap XL mass spectrometers equipped with an electrospray ionization source. Mass spectrometers were operated in a positive ionization mode with the following source conditions: 4.5 kV spray voltage, 300°C capillary temperature, 35 L/min sheath gas flow, and 9 L/min auxiliary gas flow. Collision induced dissociation (CID) experiments were performed with a 4 amu isolation width and a normalized collision energy of 30%. Instruments were tuned and calibrated according to the manufacturer’s recommendations prior to data acquisition. The LTQ Orbitrap XL acquisition conditions were one full-MS survey scan followed with MS/MS scan for the four most abundant ions. The peptide assignments were based on matching observed masses of the intact peptides in the LC/MS analysis to the predicted masses.
Potency analysis
The potency assay is a cell-based assay to measure the MAb-A activity on preventing cell-killing. If MAb-A’s antigen enters the cell, the cell will be killed. MAb-A binds to the antigen and can prevent the antigen from entering the cell and keep the cell alive. In this assay, 0−13 nM of MAb-A samples were incubated with 5 nM of its antigen and H9 cells for 4 d, then the cell proliferation was indirectly quantified using a dye (alamarBlue®, TREK Diagnostic, Inc. 00-100), which is blue and non-fluorescent in its native state but generates a highly fluorescent pink color when reacting with live cells. Therefore, changes in color and fluorescence are proportional to the number of live cells present at the end of 4-d incubation. The results are expressed in relative fluorescent units and plotted against MAb-A concentration. A 4-parameter fit analysis was used to estimate the activity of the MAb-A sample relative to the MAb-A reference material. SEC Peak 1 was analyzed side by side with MAb-A reference material and SEC Main peak fraction in this cell-based potency assay.
Acknowledgments
The authors thank Julie Nishihara for helping on the SDS PAGE analysis, Betty Chan for the helping on the Agilent 2100 Bioanalyzer analysis, Melissa Alvarez for setting up the LC/MS/MS analysis, Charity Bechtel for performing SEC-MALS analysis, Aaron Miller for potency data analysis, Angela Meier for performing free thiol quantification by Elman’s reagent and Parbir Grewal for NEM treated peptide map sample preparation. We also thank John Stults and Reed Harris for their support.
Glossary
Abbreviations:
- SEC
size exclusion chromatography
- CHO
Chinese hamster ovary
- ESI-TOF MS
electron spray ionization-time of flight mass spectrometry
- SDS PAGE
sodium dodecyl sulfate-polyacrylamide gel electrophoresis
- H or HC
heavy chain
- L or LC
light chain
- C or Cys
Cysteine
- GSH
Glutathione
- NR
non-reduced
- Ref
reference material
- kDa
kilo Daltons
- CDR
complementary-determining region
- NEM
N-Ethylmaleimide
Disclosure of Potential Conflicts of Interest
No potential conflicts of interest were disclosed.
Footnotes
Previously published online: www.landesbioscience.com/journals/mabs/article/22965
References
- 1.Cordoba-Rodriguez RV. Aggregates in MAbs and recombinant therapeutic proteins: a regulatory perspective. BioPharm International. 2008;21:44–53. [Google Scholar]
- 2.Cordoba AJ, Shyong BJ, Breen D, Harris RJ. Non-enzymatic hinge region fragmentation of antibodies in solution. J Chromatogr B Analyt Technol Biomed Life Sci. 2005;818:115–21. doi: 10.1016/j.jchromb.2004.12.033. [DOI] [PubMed] [Google Scholar]
- 3.Xiang T, Lundell E, Sun Z, Liu H. Structural effect of a recombinant monoclonal antibody on hinge region peptide bond hydrolysis. J Chromatogr B Analyt Technol Biomed Life Sci. 2007;858:254–62. doi: 10.1016/j.jchromb.2007.08.043. [DOI] [PubMed] [Google Scholar]
- 4.Rosenberg AS. Effects of protein aggregates: an immunologic perspective. AAPS J. 2006;8:E501–7. doi: 10.1208/aapsj080359. [DOI] [PMC free article] [PubMed] [Google Scholar]
- 5.Rosenberg AS, Worobec A. A risk-based approach to immunogenicity concerns of therapeutic protein products, part 2: considering host-specific and product-specific factors impacting immunogenicity. BioPharm International, 2004; http://www.biopharminternational.com/biopharm/21+CFR+Part+11/A-Risk-Based-Approach-to-Immunogenicity-Concerns-o/ArticleStandard/Article/detail/140695
- 6.Schenerman MA, Sunday BR, Kozlowski S, Webber K, Gazzano-Santoro H, Mire-Sluis A. CMC strategy forum report: analytical and structural characterization of monoclonal antibodies. BioProcess International. 2004;2:42–52. [Google Scholar]
- 7.International Union of Pure and Applied Chemistry. Size-exclusion chromatography (SEC). Compendium of Chemical Terminology 1997, 2nd edition. [Google Scholar]
- 8.Wyatt PJ. Light scattering and the absolute characterization of macromolecules. Anal Chim Acta. 1993;272:l–40. doi: 10.1016/0003-2670(93)80373-S. [DOI] [Google Scholar]
- 9.Ye H. Simultaneous determination of protein aggregation, degradation, and absolute molecular weight by size exclusion chromatography-multiangle laser light scattering. Anal Biochem. 2006;356:76–85. doi: 10.1016/j.ab.2006.05.025. [DOI] [PubMed] [Google Scholar]
- 10.Garfin DE. Essential Cell Biology Volume 1: Cell structure, a practical approach. In: Davey J and Lord M, eds. Gel Electrophoresis of Proteins. Oxford, UK: Oxford University Press, 2003:197-268. [Google Scholar]
- 11.Vasilyeva E, Woodard J, Taylor FR, Kretschmer M, Fajardo H, Lyubarskaya Y, et al. Development of a chip-based capillary gel electrophoresis method for quantification of a half-antibody in immunoglobulin G4 samples. Electrophoresis. 2004;25:3890–6. doi: 10.1002/elps.200406084. [DOI] [PubMed] [Google Scholar]
- 12.Hsieh JF, Chen ST. Comparative studies on the analysis of glycoproteins and lipopolysaccharides by the gel-based microchip and SDS-PAGE. Biomicrofluidics. 2007;1:14102. doi: 10.1063/1.2399892. [DOI] [PMC free article] [PubMed] [Google Scholar]
- 13.Performance characteristics of the high sensitivity protein 250 assay for the Agilent 2100 Bioanalyzer. Agilent Technologies Technical Note 2008; 5989-8940EN.
- 14.Zhang Z, Pan H, Chen X. Mass spectrometry for structural characterization of therapeutic antibodies. Mass Spectrom Rev. 2009;28:147–76. doi: 10.1002/mas.20190. [DOI] [PubMed] [Google Scholar]
- 15.Chen L, Gieschen A, Kilby GW, Lau J. Antibody Analysis by ESI-TOF LC/MS. Agilent Technologies Application Note 2007; 5989-5893EN. www.chem.agilent.com/Library/applications/5989-5893EN.pdf
- 16.Eon-Duval A, Broly H, Gleixner R. Quality attributes of recombinant therapeutic proteins: an assessment of impact on safety and efficacy as part of a quality by design development approach. Biotechnol Prog. 2012;28:608–22. doi: 10.1002/btpr.1548. [DOI] [PubMed] [Google Scholar]
- 17.Edelman GM, Cunningham BA, Gall WE, Gottlieb PD, Rutishauser U, Waxdal MJ. The covalent structure of an entire gammaG immunoglobulin molecule. Proc Natl Acad Sci U S A. 1969;63:78–85. doi: 10.1073/pnas.63.1.78. [DOI] [PMC free article] [PubMed] [Google Scholar]
- 18.Liu H, Chumsae C, Gaza-Bulseco G, Hurkmans K, Radziejewski CH. Ranking the susceptibility of disulfide bonds in human IgG1 antibodies by reduction, differential alkylation, and LC-MS analysis. Anal Chem. 2010;82:5219–26. doi: 10.1021/ac100575n. [DOI] [PubMed] [Google Scholar]
- 19.Wang Y, Lu Q, Wu SL, Karger BL, Hancock WS. Characterization and comparison of disulfide linkages and scrambling patterns in therapeutic monoclonal antibodies: using LC-MS with electron transfer dissociation. Anal Chem. 2011;83:3133–40. doi: 10.1021/ac200128d. [DOI] [PMC free article] [PubMed] [Google Scholar]
- 20.Gomez N, Vinson AR, Ouyang J, Nguyen MDH, Chen XN, Sharma VK, et al. Triple light chain antibodies: factors that influence its formation in cell culture. Biotechnol Bioeng. 2010;105:748–60. doi: 10.1002/bit.22580. [DOI] [PubMed] [Google Scholar]
- 21.O’Callaghan PM, McLeod J, Pybus LP, Lovelady CS, Wilkinson SJ, Racher AJ, et al. Cell line-specific control of recombinant monoclonal antibody production by CHO cells. Biotechnol Bioeng. 2010;106:938–51. doi: 10.1002/bit.22769. [DOI] [PubMed] [Google Scholar]
- 22.Stevens FJ, Schiffer M. Chapter 3: Structure and properties of human immunoglobulin light-chain dimers. In: Paul S, ed. Methods m Molecular Biology, Vol 51 Antibody Engineering Protocols. Totowa, NJ: Humana Press Inc. Humana Press Inc. 1995:51-81. [DOI] [PubMed] [Google Scholar]
- 23.Stevens FJ, Westholm FA, Solomon A, Schiffer M. Self-association of human immunoglobulin kappa I light chains: role of the third hypervariable region. Proc Natl Acad Sci U S A. 1980;77:1144–8. doi: 10.1073/pnas.77.2.1144. [DOI] [PMC free article] [PubMed] [Google Scholar]


