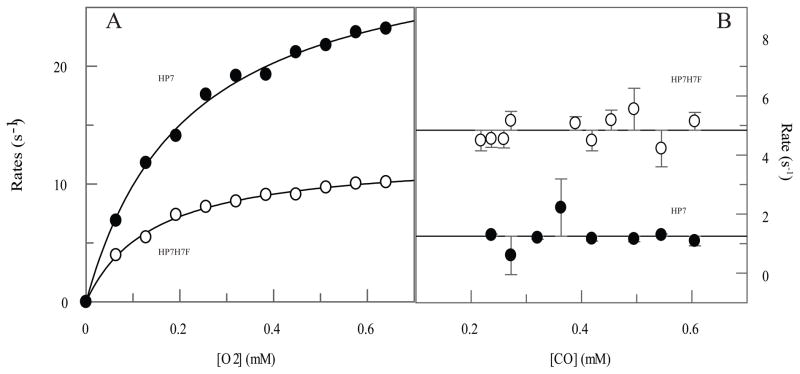
Figure 2.
Comparison of the on- and off-rates of molecular oxygen to both heme binding sites in HP7. (A) On-rates as a function of oxygen concentration. Reduced protein (20 μM), prepared by carefully titrating with a slight excess of dithionite, was mixed with oxygen in a stopped-flow and the rate of oxyferrous state formation followed spectroscopically. Lines shown are fits to the data with equation 1. (B) Off-rates as a function of carbon monoxide concentration. Lines drawn are the average rates of oxygen displacement.

