

Abstract
Objective
Experimental and observational studies suggest a role for uric acid in non-alcoholic fatty liver disease (NAFLD). We examined the association between serum uric acid levels and NAFLD in a large population-based study from the United States.
Materials/Methods
A cross-sectional analysis of 10,732 nondiabetic adults who participated in the National Health and Nutrition Examination Survey 1988–1994. Sex specific uric acid quartiles were defined: ≤5.2, 5.3–6.0, 6.1–6.9, and >6.9 mg/dL for men and ≤3.7, 3.8–4.5, 4.6–5.3, and >5.3 mg/dL for women. NAFLD presence and severity were defined by ultrasonographic detection of steatosis in the absence of other liver diseases. We modeled the probability that more severe NAFLD would be associated with the highest quartiles of uric acid.
Results
Compared to the 1st quartile, the odds ratio for NAFLD was 1.79 (95% C.I. 1.49–2.15, p < 0.001) and 3.14 (95% C.I. 2.63–3.75, p < 0.001) for the 3rd and 4th quartiles, respectively. After adjusting for demographics, hypertension, waist circumference, triglycerides, high-density lipoprotein-cholesterol, homeostasis model assessment-estimated insulin resistance, estimated glomerular filtration rate, and aspartate aminotransferase, uric acid (4th quartile) was significantly associated with NAFLD (odds ratio 1.43; 95% C.I. 1.16–1.76, p < 0.001). Positive parameter estimates suggest increasing uric acid is associated with greater severity of NAFLD.
Conclusions
Elevated uric acid level is independently associated with ultrasound-diagnosed NAFLD in a nationally representative sample of United States nondiabetic adults. Increasing uric acid is associated with increasing severity of NAFLD on ultrasonography. These findings warrant further studies on the role of uric acid in NAFLD.
Keywords: hyperuricemia, NHANES, metabolic syndrome
INTRODUCTION
Non-alcoholic fatty liver disease (NAFLD) is the result of hepatic fat accumulation in patients without an history of excessive alcohol consumption.[1] NAFLD encompasses a spectrum of diseases ranging from simple steatosis to non-alcoholic steatohepatitis (NASH) and cirrhosis.[2] Given its close relationship to the metabolic syndrome and insulin resistance,[3] NAFLD prevalence has been rising rapidly in parallel with these pathologic conditions,[4] making it the most common chronic liver disease in the developed world today. Its prevalence in the United States is estimated at 20–30%, and it is associated with significant morbidity and mortality.[5] Reported mortality rates for NASH, for example, exceed 30%.[6] In addition to the mortality accrued from cirrhosis, NAFLD is also linked to an increased risk for cardiovascular disease.[7]
Like NAFLD, hyperuricemia has been linked to both metabolic syndrome and cardiovascular disease.[8–10] Also similar to NAFLD, hyperuricemia is associated with insulin resistance and compensatory hyperinsulinemia.[11] Uric acid has antioxidant properties in the extracellular environment, raising the possibility that it may have a protective role against disease.[12–13] Yet, multiple studies show that when uric acid enters cells via specific transporters it has a pro-inflammatory role. Intracellularly, uric acid can act as a pro-oxidant, inducing the release of inflammatory mediators and growth factors.[14–15] Furthermore, uric acid has been shown to contribute to lipoprotein oxidation and inflammation,[16–17] two “stressors” which are thought to play important roles in the development and progression of NAFLD. In keeping with this mechanistic understanding, preliminary evidence suggests that hypouricemic therapy can ameliorate the degree of hepatic steatosis in animal models of NAFLD.[18]
Consistent with a link between uric acid and NAFLD, Lonardo et al. firstly described an association between NAFLD and serum uric acid levels in a small case-control study of Italian patients with ultrasound-diagnosed NAFLD.[19] Since then, several observational studies have demonstrated a significant relationship between elevated serum uric acid levels and NAFLD.[20–25] The majority of these studies, however, were conducted in Asian populations, where manifestations of the metabolic syndrome may differ from the United States (US). Notably, the prevalence of obesity in such countries is significantly lower than the prevalence of obesity in the US [26–28], and certain features of metabolic syndrome, such as waist circumference are defined differently. [29–30] As such, their results should not be extrapolated to the adult US population. In addition, the observed association between increased uric acid levels and NAFLD in these studies could be attributed, at least in part, to the link between uric acid and insulin resistance as the majority of these analyses did not adjust for a measure of insulin resistance.
The National Health and Nutrition Examination Survey (NHANES) represents a well designed population- based study with a large sample size of US adults. In addition to the large number of available covariates including homeostasis model assessment of insulin resistance (HOMA-IR), recently released data by NHANES1988–1994 includes ultrasound data for NAFLD. We hypothesized that higher serum uric acid levels are independently associated with a higher prevalence NAFLD, and that serum uric acid elevation is associated with greater severity of NAFLD by ultrasonography in nondiabetic US adults.
MATERIALS AND METHODS
Study population
Our analysis is based upon data from NHANES, a 40 year-old research program run by the National Center for Health Statistics. Cross-sectional demographic, socioeconomic, dietary, and medical data were collected through surveys, physical examination, and laboratory testing, with over-sampling of African Americans, Hispanics, and those over 60 years of age in order to obtain a representative sample of the US adult population.
Overall, the database contained 14,797 participants aged 20–74 years who had undergone liver ultrasonography. Patients with ungradable or inadequate imaging were excluded from analysis (n=941). In addition, we excluded patients with established diabetes (n=859), those with positive serology testing for viral hepatitis B or C (n=484), and individuals who reported alcohol intake ≥ 2 drinks/day (n=289).[32] Of the remaining subjects, 1478 had incomplete laboratory or clinical data and were therefore excluded. As a result, of the 14,797 subjects initially eligible for analysis, 10,732 subjects met our criteria and were included in final analysis.
Predictors and outcome measure
The independent variable used in this analysis was serum uric acid level, measured by oxidization with the specific enzyme uricase to form allantoin and H2O2 (Hitachi model 737 Multichannel Analyzer; Roche Diagnostics, Indianapolis, IN). Blood collected from fasting subjects as part of the NHANES III program was centrifuged, and aliquots of serum were frozen and shipped to the White Sands Research Center in Alamogordo, NM for analysis. The intra-assay variability was periodically evaluated and ranged from 1.2–1.3%. The inter-assay coefficient of variation was determined by measuring ten samples 2 separate times and was found to be < 1%.[33]
The dependent variable of interest was the presence and severity of NAFLD as detected by means of ultrasonography. As part of the NHANES program, ultrasonography had been performed through longitudinal and transverse scanning of the right upper quadrant with the patient in both the supine and left lateral decubitus positions. In 2009–2010, trained ultrasound readers examined the archived video recordings of these ultrasounds, specifically evaluating the liver imaging for evidence of steatosis based on standardized criteria (i.e., liver parenchymal brightness, liver-to-kidney contrast, deep beam attenuation, brightness of vessel walls, and definition of the gallbladder wall). The presence and severity of hepatic steatosis was recorded using a numbered scoring system (1 = absent; 2 = mild; 3 = moderate; and 4 = severe). Ultrasound readers were trained by an expert radiologist in three 8-hour sessions, each reading a minimum of 200 ultrasounds until the supervising radiologist was satisfied with their competence and an acceptable standard of intra- and inter-rater reliability was achieved. The intra-rater reliability for the composite scoring of NAFLD was assessed in 978 patients, with a kappa value of 0.65 (95% CI 0.62–0.69) and 79.5% agreement. The inter-rater reliability in 772 assessments had a kappa value of 0.58 (95% CI 0.54–0.62) and 75.5% agreement.[33]
Other covariates
Covariates were chosen based on prior studies and their biological plausibility. The following covariates were included in multivariable logistic regression analysis: age, sex, race, history of hypertension, waist circumference, triglycerides, high-density lipoprotein cholesterol (HDL-C), estimated glomerular filtration rate (eGFR), the homeostasis model assessment of insulin resistance (HOMA-IR). In addition, to eliminate the potentially residual confounding effect of alcoholic liver disease, we adjusted for aspartate aminotransferase (AST) levels.
History of hypertension was defined as physician diagnosis of hypertension or use of anti-hypertensive medications. Physicians measured blood pressure at the mobile examination centers with mercury sphygmomanometers using a standard protocol. Waist circumference was chosen as opposed to body mass index based on prior studies showing that it is a better predictor of obesity-related comorbidity in NHANES.[34] Waist circumference was measured according to the NHANES manual of procedures.[35] Briefly, tape was applied just above the upper border of the right ilium horizontally, the tape was then tightened slightly and the waist circumference was recorded in centimeters to the nearest millimeter. Fasting levels of triglycerides and HDL-C were measured enzymatically with a Hitachi 704 analyzer (Roche Diagnostics, Indianapolis, IN). eGFR was estimated using the abbreviated Modification of Diet in Renal Disease (MDRD) study formula as follows: eGFR = 186.3 × (serum creatinine in mg/dl)−1.154 × age−0.203 × (0.742 if female) × (1.21 if black). Fasting glucose was measured by the hexokinase method, and fasting insulin levels were measured using the Merocodia Insulin ELISA; this data was then entered into the HOMA-IR formula [HOMA-IR = fasting insulin (mU/l) × fasting glucose (mmol/l)/22.5]. Serum AST levels were measured using a Hitachi 737 Chemistry Analyzer (Roche Diagnostics, Indianapolis, IN)
Statistical analysis
Due to the complex sample strategy of NHANES 1988–1994, appropriate 6-year weights and strata were applied. Clinical and biochemical characteristics of the study population were compared across sex- specific serum uric acid quartiles, which were defined as follows: quartile 1: ≤ 5.2 mg/dL; quartile 2: 5.3–6.0 mg/dL; quartile 3: 6.1–6.9 mg/dL; and quartile 4: > 6.9 mg/dL for males and quartile 1: ≤ 3.7 mg/dL; quartile 2: 3.8–4.5 mg/dL; quartile 3: 4.6–5.3 mg/dL; and quartile 4: > 5.3 mg/dL for females. Analysis was performed using the Rao-Scott Chi squared test for categorical variables, and one-way ANOVA analysis was performed comparing the highest quartile of uric acid to quartiles 1, 2, and 3. Additional analysis was performed using serum uric acid as a continuous variable as well. Additional analyses were conducted separately for men and women.
A post-hoc power calculation was conducted and indicates that with a sample size of 10,732 patients (721 of whom had severe NAFLD on ultrasound), we had 99% power to detect an odds ratio (OR) as small as 1.21, with a two sided alpha of 0.05. After adjusting for other covariates explaining at least 25% of the variability in NAFLD, we had 80% power to detect an OR as small as 1.13.
Ordinal logistic regression analysis was applied to examine whether serum uric acid levels were associated with the ultrasonographic severity of NAFLD (mild, moderate and severe). We modeled the probability that more severe NAFLD would be associated with those in the highest quartiles of uric acid. Results are presented as the OR with 95% confidence interval (CI). Logistic regression analysis was performed without adjustment (unadjusted model) and with adjustment for age, sex, race, history of hypertension, waist circumference, triglycerides, HDL-C, eGFR, HOMA-IR, and AST (adjusted model). Additionally, uric acid as a continuous variable was subjected to logistic regression using these models. All p-values presented are two-tailed. All statistical analyses were performed using SAS 9.2 software.
RESULTS
Clinical characteristics of participants
Mean (SE) serum uric acid level was 5.28 ± 0.02 mg/dL for all participants. Demographics, clinical and biochemical characteristics of the study participants stratified according to serum uric acid quartiles are summarized in Table 1. Compared to subjects in the lower quartiles of uric acid level, those with serum uric acid in quartile 4 were older; more likely to be male, hypertensive and centrally obese; they were also more likely to have higher triglycerides, lower HDL-C, higher HOMA-IR scores, and lower eGFR. AST was also found to increase with increasing uric acid quartiles. The overall prevalence of NAFLD on ultrasonography increased from 27.3 to 46.6% across the uric acid quartiles (Figure 1).
Table 1.
Characteristics of the population by quartiles of serum uric acid (mg/dL)
| Quartile 1 | Quartile 2 | Quartile 3 | Quartile 4 | |
|---|---|---|---|---|
| Men | (≤ 5.2) | (5.3–6.0) | (6.1–6.9) | (> 6.9) |
| Women | (≥ 3.7) | (3.8–4.5) | (4.5–5.3) | (> 5.3) |
| n = 2781 | n = 2846 | n = 2558 | n = 2547 | |
| Age (years) | 40.3 ± 0.4 | 40.0 ± 0.4 | 41.7 ± 0.4 | 45.6 ± 0.4* |
| Sex (% male) | 47.8 | 44.1 | 51.1 | 46.5 |
| Race | ||||
| White (%) | 86.4 | 86.3 | 85.2 | 83.6 |
| Black (%) | 10.0 | 9.7 | 10.0 | 12.0 |
| Other (%) | 3.6 | 4.0 | 4.8 | 4.4 |
| History of hypertension (%) | 13.1 | 15.0 | 21.6 | 35.8 |
| HDL-C (mg/dL) | 53.5 ± 0.5 | 51.6 ± 0.4 | 50.0 ± 0.5 | 47.3 ± 0.5† |
| Triglycerides (mg/dL) | 106.0 ± 2.1 | 122.0 ± 2.3 | 145.3 ± 3.0 | 186.5 ± 4.7† |
| Waist circumference (cm) | 85.4 ± 0.4 | 88.2 ± 0.4 | 93.5 ± 0.4 | 99.8 ± 0.4† |
| eGFR | 74.4 ± 0.4 | 71.7 ± 0.3 | 70.0 ± 0.4 | 64.8 ± 0.4† |
| Alcoholic beverages/month | 6.6 ± 0.3 | 6.9 ± 0.3 | 8.1 ± 0.3 | 7.2 ± 0.3 |
| HOMA-IR | 1.8 ± 0.04 | 2.1 ± 0.1 | 2.4 ± 0.1 | 3.3 ± 0.1† |
| Fasting insulin (uU/mL) | 7.6 ± 0.1 | 9.1 ± 0.2 | 10.2 ± 0.2 | 13.6 ± 0.3† |
| Fasting glucose (mmol/L) | 5.0 ± 0.04 | 5.0 ± 0.02 | 5.2 ± 0.03 | 5.3 ± 0.02* |
| AST (U/L) | 19.7 ± 0.2 | 19.8 ± 0.2 | 20.9 ± 0.3 | 23.4 ± 0.4† |
P value < 0.05 for quartile 4 compared to quartiles 1, 2, and 3
P value < 0.0001 for quartile 4 compared to quartiles 1, 2, and 3
HDL-C = high density lipoprotein cholesterol, eGFR = estimated glomerular filtration rate, HOMA-IR = homeostatic model assessment of insulin resistance, AST = aspartate aminotransferase
Serum uric acid levels are expressed in mg/dL and correspond to the following μmol/L: quartile 1: ≤5.2 mg/dL (≤ 309 μmol/L); quartile 2: 5.3–6.0 mg/dL (315–357 μmol/L) ; quartile 3: 6.1–6.9 mg/dL (363–410 μmol/L) ; and quartile 4: > 6.9 mg/dL (> 410 μmol/L) for males and quartile 1: ≤ 3.7 mg/dL (≤ 220 μmol/L); quartile 2: 3.8–4.5 mg/dL (226–268 μmol/L); quartile 3: 4.6–5.3 mg/dL (274–315 μmol/L); and quartile 4: > 5.3 mg/dL (> 315 μmol/L) for females
Figure 1. Prevalence of NAFLD according to serum uric acid quartiles.
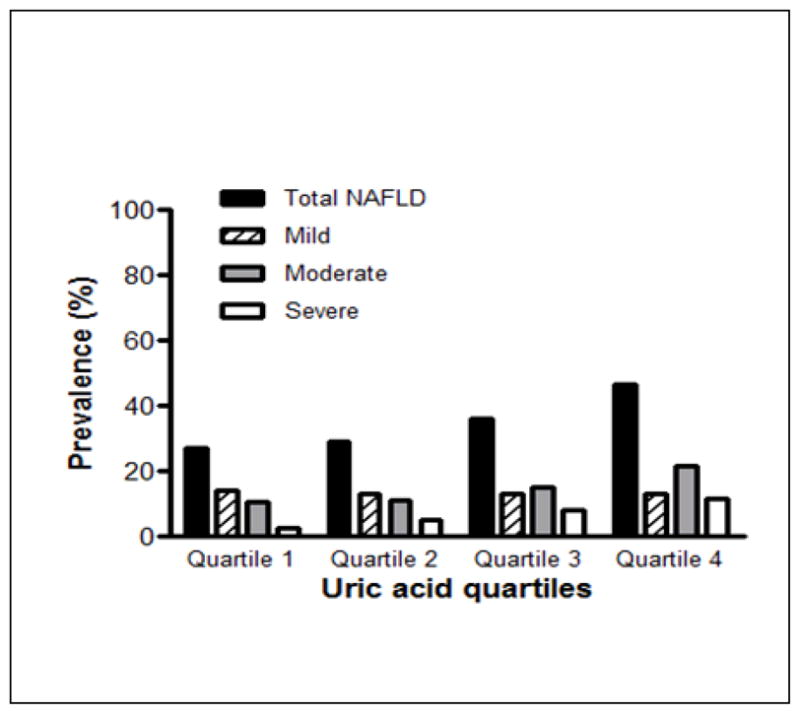
The prevalence of any grade of NAFLD on ultrasound increased with increasing serum uric quartile (p < 0.0001 for quartile 4 compared to quartiles 1,2, and 3). In addition, the p value for the Rao-Scott Chi Square test was < 0.0001 indicating that NAFLD grade was dependent on serum uric acid quartiles.
Relationship between serum uric acid and NAFLD prevalence and severity
Descriptive statistics
Mean (SE) uric acid levels were 5.09 ± 0.02 mg/dL in the absence of NAFLD and increased significantly with increased severity of NAFLD; mean uric acid levels were 5.19 ± 0.06, 5.89 ± 0.06, and 6.35 ± 0.10 mg/dL for mild, moderate, and severe NAFLD respectively (p < 0.0001). Hyperuricemia (defined as serum uric acid level > 7.0 mg/dL for males and > 5.7 mg/dL for females) was present in 16% of all the women and 20.5% of the men. The frequency of men and women with hyperuricemia increased with increasing severity of NAFLD (as shown in Table 2).
Table 2.
Percentage of those with hyperuricemia according to ultrasound severity of NAFLD
| NAFLD grade by Ultrasound | ||||
|---|---|---|---|---|
| None n (%) | Mild n (%) | Moderate n (%) | Severe n (%) | |
| Males (n=4924) | 517 (16.5%) | 129 (21%) | 232 (30%) | 132 (33%) |
| Females (n=5808) | 482 (12%) | 131 (16%) | 213 (27%) | 117 (36%) |
Hyperuricemia was defined as > 7.0 mg/dL for males and > 5.7 mg/dL for females.
Figure 1 illustrates the prevalence of NAFLD across serum uric acid quartiles. The prevalence of any grade of NAFLD was higher in the 4th quartile of uric acid compared to quartiles 1,2, and 3 (p <0.0001 for all comparisons). In addition, the Rao-Scott Chi Square test confirmed that the severity of NAFLD was dependent on the quartiles of serum uric acid (p <0.0001).
Results of the Regression Analysis
We examined the relationship of NAFLD with serum uric acid quartiles. In unadjusted analysis, NAFLD was associated with higher sex-specific quartiles of uric acid (i.e., quartiles 2, 3, and 4) when compared to quartile 1 (Table 3). Using quartile 1 as a reference, the OR for NAFLD was 1.17 (95% CI 0.97–1.40, p = 0.10), 1.79 (95% CI 1.49–2.15, p < 0.001), and 3.14 (95% CI 2.63–3.75, p < 0.001) for quartiles 2, 3, and 4, respectively. Adjusting for covariates (age, sex, race, history of hypertension, waist circumference, triglycerides, HDL-C, eGFR, HOMA-IR, and AST), the relationship between serum uric acid and NAFLD remained statistically significant in quartiles 3 and 4 with OR of 1.29 (95% CI 1.06–1.57, p = 0.01) and 1.43 (95% CI 1.16–1.76, p <0.001), respectively (Table 3). The full multivariate model is shown in supplementary table (Table 3S). The 4th quartile of uric acid was similarly associated with a higher odds of NAFLD when the analysis was stratified by sex, and are shown separately for men and women in Table 4.
Table 3.
Ordinal logistic regression of stages of NAFLD on quartiles of serum uric acid
| uric acid as a categorical variable (mg/dL) | uric acid as a continuous variable (per 1 mg/dL) | ||||
|---|---|---|---|---|---|
| Quartile 1 | Quartile 2 | Quartile 3 | Quartile 4 | ||
| Males | < 5.2 | 5.3–6.0 | 6.1–6.9 | > 6.9 | |
| Females | < 3.7 | 3.8–4.5 | 4.6–5.3 | > 5.3 | |
| Unadjusted OR (95% C.I.) P value |
1 [REF] | 1.17 (0.97–1.40) p = 0.10 |
1.79 (1.49–2.15) p <0.001 |
3.14 (2.63–3.75) p <0.001 |
1.38 (1.33–1.45) p <0.001 |
| Adjusted OR* (95% C.I.) P value |
1 [REF] | 1.01 (0.83–1.23) p = 0.92 |
1.29 (1.06–1.57) p = 0.01 |
1.43 (1.16–1.76) p <0.001 |
1.15 (1.09–1.22) p <0.001 |
adjusted for: age, gender, race, history of hypertension, waist circumference, triglycerides, high density lipoprotein cholesterol, estimated glomerular filtration rate, homeostatic model of insulin resistance, aspartate aminotransferase
Table 4.
Ordinal logistic regression of NAFLD stages on uric acid quartiles stratified by sex
| uric acid as a categorical variable (mg/dL) | uric acid as a continuous variable (per 1 mg/dL) | ||||
|---|---|---|---|---|---|
| Quartile 1 | Quartile 2 | Quartile 3 | Quartile 4 | ||
| Males | < 5.2 | 5.3–6.0 | 6.1–6.9 | > 6.9 | |
| Unadjusted OR (95% C.I.) P value |
1 [REF] | 1.35 (1.02–1.78) p = 0.036 |
1.99 (1.53–2.58) p = <0.001 |
3.10 (2.37–4.06) p <0.001 |
1.43 (1.33–1.54) p <0.001 |
| Adjusted OR* (95% C.I.) P value |
1 [REF] | 1.21 (0.90–1.62) p = 0.21 |
1.53 (1.14–2.05) p = 0.004 |
1.54 (1.11–2.13) p = 0.009 |
1.17 (1.07–1.28) p <0.001 |
| Females | < 3.7 | 3.8–4.5 | 4.6–5.3 | > 5.3 | |
| Unadjusted OR (95% C.I.) P value |
1 [REF] | 1.03 (0.81–1.32) p = 0.80 |
1.59 (1.24–2.04) p = <0.001 |
3.20 (2.53–4.06) p <0.001 |
1.50 (1.41–1.60) p <0.001 |
| Adjusted OR* (95% C.I.) P value |
1 [REF] | 0.89 (0.69–1.15) p = 0.38 |
1.16 (0.89–1.51) p = 0.28 |
1.50 (1.15–1.95) p = 0.003 |
1.10 (1.09–1.28) p <0.001 |
adjusted for: age, race, history of hypertension, waist circumference, triglycerides, high density lipoprotein cholesterol, estimated glomerular filtration rate, homeostatic model of insulin resistance, aspartate aminotransferase
Table 3 also shows the results of a logistic regression analysis in which serum uric acid was modeled as a continuous variable. In unadjusted analysis, increasing uric acid was found to have an OR of 1.38 (95% CI 1.33–1.45, p < 0.001) for NAFLD, representing a 38% increase in the odds of NAFLD for every 1.0 mg/dL increase in serum uric acid. Adjustment for all covariates resulted in an OR of 1.15 (95% CI 1.09–1.22, p < 0.001). Analysis of uric acid as a continuous variable is also shown separately for men and women in Table 4.
DISCUSSION
To our knowledge, this is the first and the largest study specifically aimed at evaluating the association between high serum uric acid levels and NAFLD on ultrasonography in a nationally representative sample of nondiabetic US adults. A prior study in the US had suggested that serum uric acid levels were increased in those with NASH compared with those with simple steatosis, but it only included children.[31] Our data indicate that there is a strong association between increased serum uric acid levels and the presence of NAFLD in adult men and women, and that this association persists after adjustment for demographics and several potential confounders, including insulin resistance and other components of the metabolic syndrome. Consistent with these findings, mean ALT levels were 15.0 ± 0.3, 16.1 ± 0.3, 17.9 ± 0.4, and 20.9 ± 0.5 U/L in uric acid quartiles 1, 2, 3, and 4, respectively (p < 0.0001). Notably, our data also reveal that there is a stepwise increase in NAFLD prevalence and severity with increasing levels of serum uric acid even within the normal range. In addition, we used the descending option to model the probability of more severe steatosis, so the ultrasonographic severity of NAFLD could be assessed for each uric acid quartile. This analysis yielded positive parameter estimates (Table 3), suggesting that increased serum uric acid was associated with a greater risk of more severe NAFLD on ultrasonography, independently of several risk factors and potential confounders.
Collectively, the present findings confirm and extend to the nondiabetic US adult population the results of recent epidemiological studies, which were performed on smaller cohorts of Asian individuals, and showed a significant association between elevated serum uric acid levels and the prevalence and incidence of NAFLD [20–22, 36–38]. We believe that our finding of a positive association between serum uric acid levels and NAFLD prevalence and severity that remains significant after adjustment for insulin resistance and other metabolic syndrome features in both sexes further strengthen the relevance of uric acid in NAFLD.
One possible explanation for the relationship between serum uric acid and NAFLD is that the observations are simply confounded by the shared background of metabolic syndrome. Supporting this theory are the observations that hyperinsulinemia can induce hyperuricemia by decreasing urinary excretion of uric acid,[39] and that hyperuricemia can result from the oxidative stress seen in metabolic syndrome.[33] Our study however, identifies a strong association between serum uric acid levels and NAFLD independently of insulin resistance and other features of metabolic syndrome. These findings raise the question of whether uric acid may be involved in the pathogenesis of NAFLD. Supporting this hypothesis are the observations that uric acid has been shown to exert pro-inflammatory and pro-oxidant effects both in adipose tissue[16–17] and in other cell lines such as vascular smooth muscle cells [14–15] where uric acid has been shown to act as an intracellular pro-oxidant activating the mitogen activated protein kinase pathway and nuclear factor κ-B. Whether such downstream effects of uric acid play a pathogenic role in NAFLD requires further investigation in the appropriate animal and cell culture models.
As mentioned above, a major finding of this study is that increased serum uric acid levels are associated with greater severity of NAFLD by ultrasonography both in men and in women. Prior literature on the matter has been conflicted; in one report hyperuricemia independently predicted the severity of NAFLD histology (mainly hepatic steatosis and inflammation) in 166 patients with biopsy-proven NAFLD who were seen at a tertiary care referral center in Italy.[24] Preliminary data from the Polistena project (involving 61 biopsied NAFLD patients) showed that serum uric acid levels were significantly higher in patients with severe fibrosis than in those with mild fibrosis.[40] However, in a sub-analysis of another published report, involving 263 Italian patients with biopsy-proven NAFLD (89 of whom who had serum uric acid measurements), Bugianesi et al. did not find a significant association between serum uric acid levels and the presence and severity of hepatic fibrosis.[41]
Our study represents the first report that elevated serum uric acid levels are associated with more severe NAFLD in a large population-based cohort of nondiabetic US adults, using ultrasound as a tool for detecting and characterizing NAFLD. While the gold standard for diagnosing and staging of NAFLD remains liver biopsy, ultrasonography is the most widely used screening tool for diagnosing hepatic steatosis in clinical practice,[6, 42] and new scoring systems have bolstered the reliability of ultrasonography in this disease.[43–44] In addition, the histological severity of NAFLD has been shown to correlate well with the ultrasonographic severity of NAFLD,[43] and quantitative assessments of some biochemical markers of NAFLD have also been shown to correlate with the ultrasonographic severity of NAFLD.[45] This, combined with the non-invasive nature of ultrasonography, renders it an attractive tool for screening for hepatic steatosis on a widespread, population-level basis.
Some limitations of our study merit comment. First, as mentioned above, the design of our study is cross-sectional and cannot determine any causality between uric acid and NAFLD. Rather, such data should be viewed as hypothesis generating. Second, the sensitivity of liver ultrasonography may vary depending on the hepatic fat content, [46] although as discussed above, liver ultrasonography offers several strengths including the non-invasive nature of the test. In addition, although the sensitivity of liver ultrasonography may vary with the hepatic fat content, when performed properly, ultrasonography has been reported to detect as little as ≥ 5% hepatic fat content. [46] Third, some selection bias also may be present because individuals with more severe forms of disease are less likely to participate in NHANES, however, this bias would result in the underestimation of the observed association between serum uric acid and NAFLD. Fourth, although we adjusted our results for waist circumference and HOMA-estimated insulin resistance, more direct and accurate measures of visceral adiposity and insulin resistance were not available in this study. Finally, we did not adjust for lifestyle or dietary factors, such as meat and fructose intake that may contribute to increased uric acid levels and NAFLD. For example, fructose intake increases serum uric acid levels,[47] and has been linked to the pathogenesis of NAFLD as well.[48] And lowering uric acid levels cannot be advocated as a therapeutic alternative to healthy lifestyle modifications.
Notwithstanding these limitations, this analysis has several important strengths. First, it is the largest and most comprehensive national survey to examine the association between serum uric acid levels and the presence and severity of NAFLD on ultrasound among the adult US population. Second, NHANES used uniform methods to collect data on serum uric acid levels and NAFLD. Third, the availability of extensive and complete data on a wide range of risk factors allowed us to ensure giving an unbiased estimate of the relationship between serum uric acid and NAFLD.
In conclusion, our findings demonstrate an independent association between increased serum uric acid levels and the prevalence and severity of ultrasound-diagnosed NAFLD in a large population of nondiabetic US adults. These findings are consistent with the reported trends in other countries and are supported by some experimental evidence that uric acid may have a pro-inflammatory and pro-oxidant role intracellularly. Further studies are needed to understand whether such mechanisms contribute to the relation between uric acid and NAFLD and to evaluate whether specific dietary or pharmacological strategies aimed at lowering serum uric acid levels would be of benefit in NAFLD.
Supplementary Material
Acknowledgments
FUNDING
Dr. Kim McFann is supported in part by NIH/NCRR Colorado CTSI Grant Number UL1 RR025780. Dr. Richard Johnson is supported in part by NIH grant RO1 HL-68607. Dr. Michel Chonchol is supported by NIDDK grant R01DK081473-01A1 and NIDDK grant R01DK078112-01A2. Dr. Diana Jalal is supported by grants 1K23DK088833, R03DK094484, and by the Veteran’s Administration Eastern Colorado Health Care System. These funding sources were not involved with the design and conduct of the study; collection, management, analysis, and interpretation of the data; and preparation, review, or approval of the manuscript
ABBREVIATIONS USED
- NAFLD
non-alcoholic fatty liver disease
- NASH
non-alcoholic steatohepatitis
- NHANES
National Health and Nutrition Examination Survey
- HDL-C
high density lipoprotein cholesterol
- eGFR
estimated glomerular filtration rate
- HOMA-IR
homeostasis model assessment of insulin resistance
- AST
aspartate aminotransferase
- ALT
alanine aminotransferase
- MDRD
Modification of Diet in Renal Disease
- OR
odds ratio
- C.I
confidence interval
Footnotes
DISCLOSURES
Dr. Richard Johnson has several patent applications with the University of Florida related to lowering uric acid as a means to prevent or treat metabolic complications of obesity including fatty liver disease. There are no other disclosures or conflicts of interest to declare.
AUTHOR CONTRIBUTIONS
Dr. Jeffrey Sirota – data analysis, data interpretation, manuscript writing
Dr Kim McFann – statistical analysis, data analysis, manuscript writing
Dr. Giovanni Targher – data analysis, data interpretation, manuscript writing
Dr. Richard Johnson – data analysis, data interpretation, manuscript writing
Dr. Michel Chonchol – study design, data analysis, data interpretation, manuscript writing
Dr. Diana Jalal – study design, data analysis, data interpretation, manuscript writing. Dr. Diana Jalal had full access to all the data in the study and takes responsibility for the integrity of the data and the accuracy of the data analysis.
Publisher's Disclaimer: This is a PDF file of an unedited manuscript that has been accepted for publication. As a service to our customers we are providing this early version of the manuscript. The manuscript will undergo copyediting, typesetting, and review of the resulting proof before it is published in its final citable form. Please note that during the production process errors may be discovered which could affect the content, and all legal disclaimers that apply to the journal pertain.
References
- 1.Day CP, Saksena S. Non-alcoholic steatohepatitis: definitions and pathogenesis. J Gastroenterol Hepatol. 2002;17(Suppl 3):S377–84. doi: 10.1046/j.1440-1746.17.s3.31.x. [DOI] [PubMed] [Google Scholar]
- 2.Sanyal AJ. AGA technical review on nonalcoholic fatty liver disease. Gastroenterology. 2002;123(5):1705–25. doi: 10.1053/gast.2002.36572. [DOI] [PubMed] [Google Scholar]
- 3.Rector RS, Thyfault JP, Wei Y, et al. Non-alcoholic fatty liver disease and the metabolic syndrome: an update. World J Gastroenterol. 2008;14(2):185–92. doi: 10.3748/wjg.14.185. [DOI] [PMC free article] [PubMed] [Google Scholar]
- 4.Amarapurkar D, Kamani P, Patel N, et al. Prevalence of non-alcoholic fatty liver disease: population based study. Ann Hepatol. 2007;6(3):161–3. [PubMed] [Google Scholar]
- 5.Adams LA, Lymp JF, St Sauver J, et al. The natural history of nonalcoholic fatty liver disease: a population-based cohort study. Gastroenterology. 2005;129(1):113–21. doi: 10.1053/j.gastro.2005.04.014. [DOI] [PubMed] [Google Scholar]
- 6.de Alwis NM, Day CP. Non-alcoholic fatty liver disease: the mist gradually clears. J Hepatol. 2008;48(Suppl 1):S104–12. doi: 10.1016/j.jhep.2008.01.009. [DOI] [PubMed] [Google Scholar]
- 7.Targher G, Day CP, Bonora E. Risk of cardiovascular disease in patients with nonalcoholic fatty liver disease. N Engl J Med. 2010;363(14):1341–50. doi: 10.1056/NEJMra0912063. [DOI] [PubMed] [Google Scholar]
- 8.Gagliardi AC, Miname MH, Santos RD. Uric acid: A marker of increased cardiovascular risk. Atherosclerosis. 2009;202(1):11–7. doi: 10.1016/j.atherosclerosis.2008.05.022. [DOI] [PubMed] [Google Scholar]
- 9.Tsouli SG, Liberopoulos EN, Mikhailidis DP, et al. Elevated serum uric acid levels in metabolic syndrome: an active component or an innocent bystander? Metabolism. 2006;55(10):1293–301. doi: 10.1016/j.metabol.2006.05.013. [DOI] [PubMed] [Google Scholar]
- 10.Godsland IF, Johnston DG. Co-associations between insulin sensitivity and measures of liver function, subclinical inflammation, and hematology. Metabolism. 2008;57(9):1190–7. doi: 10.1016/j.metabol.2008.04.010. [DOI] [PubMed] [Google Scholar]
- 11.Cirillo P, Sato W, Reungjui S, et al. Uric acid, the metabolic syndrome, and renal disease. J Am Soc Nephrol. 2006;17(12 Suppl 3):S165–8. doi: 10.1681/ASN.2006080909. [DOI] [PubMed] [Google Scholar]
- 12.Ames BN, Cathcart R, Schwiers E, et al. Uric acid provides an antioxidant defense in humans against oxidant- and radical-caused aging and cancer: a hypothesis. Proc Natl Acad Sci U S A. 1981;78(11):6858–62. doi: 10.1073/pnas.78.11.6858. [DOI] [PMC free article] [PubMed] [Google Scholar]
- 13.Stocker R, Keaney JF., Jr Role of oxidative modifications in atherosclerosis. Physiol Rev. 2004;84(4):1381–478. doi: 10.1152/physrev.00047.2003. [DOI] [PubMed] [Google Scholar]
- 14.Kang DH, Han L, Ouyang X, et al. Uric acid causes vascular smooth muscle cell proliferation by entering cells via a functional urate transporter. Am J Nephrol. 2005;25(5):425–33. doi: 10.1159/000087713. [DOI] [PubMed] [Google Scholar]
- 15.Kanellis J, Watanabe S, Li JH, et al. Uric acid stimulates monocyte chemoattractant protein-1 production in vascular smooth muscle cells via mitogen-activated protein kinase and cyclooxygenase-2. Hypertension. 2003;41(6):1287–93. doi: 10.1161/01.HYP.0000072820.07472.3B. [DOI] [PubMed] [Google Scholar]
- 16.Baldwin W, McRae S, Marek G, et al. Hyperuricemia as a mediator of the proinflammatory endocrine imbalance in the adipose tissue in a murine model of the metabolic syndrome. Diabetes. 2011;60(4):1258–69. doi: 10.2337/db10-0916. [DOI] [PMC free article] [PubMed] [Google Scholar]
- 17.Sautin YY, Nakagawa T, Zharikov S, et al. Adverse effects of the classic antioxidant uric acid in adipocytes: NADPH oxidase-mediated oxidative/nitrosative stress. Am J Physiol Cell Physiol. 2007;293(2):C584–96. doi: 10.1152/ajpcell.00600.2006. [DOI] [PubMed] [Google Scholar]
- 18.Xu CF, Yu CH, Xu L, et al. Hypouricemic therapy: a novel potential therapeutic option for nonalcoholic fatty liver disease. Hepatology. 2010;52(5):1865–6. doi: 10.1002/hep.23798. [DOI] [PubMed] [Google Scholar]
- 19.Lonardo A, Loria P, Leonardi F, et al. Fasting insulin and uric acid levels but not indices of iron metabolism are independent predictors of non-alcoholic fatty liver disease. A case-control study. Dig Liver Dis. 2002;34(3):204–11. doi: 10.1016/s1590-8658(02)80194-3. [DOI] [PubMed] [Google Scholar]
- 20.Li Y, Xu C, Yu C, et al. Association of serum uric acid level with non-alcoholic fatty liver disease: a cross-sectional study. J Hepatol. 2009;50(5):1029–34. doi: 10.1016/j.jhep.2008.11.021. [DOI] [PubMed] [Google Scholar]
- 21.Lee YJ, Lee HR, Lee JH, et al. Association between serum uric acid and non-alcoholic fatty liver disease in Korean adults. Clin Chem Lab Med. 2010;48(2):175–80. doi: 10.1515/CCLM.2010.037. [DOI] [PubMed] [Google Scholar]
- 22.Yamada T, Suzuki S, Fukatsu M, et al. Elevated serum uric acid is an independent risk factor for nonalcoholic fatty liver disease in Japanese undergoing a health checkup. Acta Gastroenterol Belg. 2010;73(1):12–7. [PubMed] [Google Scholar]
- 23.Ferreira VS, Pernambuco RB, Lopes EP, et al. Frequency and risk factors associated with non-alcoholic fatty liver disease in patients with type 2 diabetes mellitus. Arq Bras Endocrinol Metabol. 2010;54(4):362–8. doi: 10.1590/s0004-27302010000400004. [DOI] [PubMed] [Google Scholar]
- 24.Petta S, Camma C, Cabibi D, et al. Hyperuricemia is associated with histological liver damage in patients with non-alcoholic fatty liver disease. Aliment Pharmacol Ther. 2011;34(7):757–66. doi: 10.1111/j.1365-2036.2011.04788.x. [DOI] [PubMed] [Google Scholar]
- 25.Ryu S, Chang Y, Kim SG, et al. Serum uric acid levels predict incident nonalcoholic fatty liver disease in healthy Korean men. Metabolism. 2011;60(6):860–6. doi: 10.1016/j.metabol.2010.08.005. [DOI] [PubMed] [Google Scholar]
- 26.Flegal KM, Carroll MD, Kit BK, et al. Prevalence of obesity and trends in the distribution of body mass index among US adults, 1999–2010. JAMA. 307(5):491–7. doi: 10.1001/jama.2012.39. [DOI] [PubMed] [Google Scholar]
- 27.Reynolds K, Gu D, Whelton PK, et al. Prevalence and risk factors of overweight and obesity in China. Obesity (Silver Spring) 2007;15(1):10–8. doi: 10.1038/oby.2007.527. [DOI] [PubMed] [Google Scholar]
- 28.Tsujimoto T, Sairenchi T, Iso H, et al. Impact of obesity on incident hypertension independent of weight gain among nonhypertensive Japanese: the Ibaraki Prefectural Health Study (IPHS) J Hypertens. 30(6):1122–8. doi: 10.1097/HJH.0b013e328352b879. [DOI] [PubMed] [Google Scholar]
- 29.IDF. Internation Diabetes Federation; 2006. http://www.idf.org/webdata/docs/IDF_Meta_def_final.pdf. [Google Scholar]
- 30.Grundy SM, Brewer HB, Jr, Cleeman JI, et al. Definition of metabolic syndrome: report of the National Heart, Lung, and Blood Institute/American Heart Association conference on scientific issues related to definition. Arterioscler Thromb Vasc Biol. 2004;24(2):e13–8. doi: 10.1161/01.ATV.0000111245.75752.C6. [DOI] [PubMed] [Google Scholar]
- 31.Vos MB, Colvin R, Belt P, et al. Correlation of vitamin E, uric acid, and diet composition with histologic features of pediatric NAFLD. J Pediatr Gastroenterol Nutr. 2012;54(1):90–6. doi: 10.1097/MPG.0b013e318229da1a. [DOI] [PMC free article] [PubMed] [Google Scholar]
- 32.Ruhl CE, Everhart JE. Joint effects of body weight and alcohol on elevated serum alanine aminotransferase in the United States population. Clin Gastroenterol Hepatol. 2005;3(12):1260–8. doi: 10.1016/s1542-3565(05)00743-3. [DOI] [PubMed] [Google Scholar]
- 33.Waring WS, Webb DJ, Maxwell SR. Systemic uric acid administration increases serum antioxidant capacity in healthy volunteers. J Cardiovasc Pharmacol. 2001;38(3):365–71. doi: 10.1097/00005344-200109000-00005. [DOI] [PubMed] [Google Scholar]
- 34.Janssen I, Katzmarzyk PT, Ross R. Waist circumference and not body mass index explains obesity-related health risk. Am J Clin Nutr. 2004;79(3):379–84. doi: 10.1093/ajcn/79.3.379. [DOI] [PubMed] [Google Scholar]
- 35.http://www.cdc.gov/nchs/data/nhanes/nhanes3/cdrom/nchs/manuals/anthro.pdf
- 36.Kuo CF, Yu KH, Luo SF, et al. Gout and risk of non-alcoholic fatty liver disease. Scand J Rheumatol. 2010;39(6):466–71. doi: 10.3109/03009741003742797. [DOI] [PubMed] [Google Scholar]
- 37.Xu C, Yu C, Xu L, et al. High serum uric acid increases the risk for nonalcoholic Fatty liver disease: a prospective observational study. PLoS One. 2010;5(7):e11578. doi: 10.1371/journal.pone.0011578. [DOI] [PMC free article] [PubMed] [Google Scholar]
- 38.Lee JW, Cho YK, Ryan M, et al. Serum uric Acid as a predictor for the development of nonalcoholic Fatty liver disease in apparently healthy subjects: a 5-year retrospective cohort study. Gut Liver. 2010;4(3):378–83. doi: 10.5009/gnl.2010.4.3.378. [DOI] [PMC free article] [PubMed] [Google Scholar]
- 39.Marangella M. Uric acid elimination in the urine. Pathophysiological implications. Contrib Nephrol. 2005;147:132–48. doi: 10.1159/000082551. [DOI] [PubMed] [Google Scholar]
- 40.Loria P, Lonardo A, Carulli N. Relative Contribution of Iron Burden, HFE Mutations, and Insulin Resistance to Fibrosis in Nonalcoholic Fatty Liver. Hepatology. 2004;39(6):1748. doi: 10.1002/hep.20252. [DOI] [PubMed] [Google Scholar]
- 41.Bugianesi E, Marchesini G. Uric acid levels and liver fibrosis in nonalcoholic fatty liver disease. Hepatology. 2004;39(6):1749. doi: 10.1002/hep.20023. [DOI] [PubMed] [Google Scholar]
- 42.Vuppalanchi R, Chalasani N. Nonalcoholic fatty liver disease and nonalcoholic steatohepatitis: Selected practical issues in their evaluation and management. Hepatology. 2009;49(1):306–17. doi: 10.1002/hep.22603. [DOI] [PMC free article] [PubMed] [Google Scholar]
- 43.Hamaguchi M, Kojima T, Itoh Y, et al. The severity of ultrasonographic findings in nonalcoholic fatty liver disease reflects the metabolic syndrome and visceral fat accumulation. Am J Gastroenterol. 2007;102(12):2708–15. doi: 10.1111/j.1572-0241.2007.01526.x. [DOI] [PubMed] [Google Scholar]
- 44.Ballestri S, Lonardo A, Romagnoli D, et al. Ultrasonographic fatty liver indicator, a novel score which rules out NASH and is correlated with metabolic parameters in NAFLD. Liver Int. 2012 doi: 10.1111/j.1478-3231.2012.02804.x. [DOI] [PubMed] [Google Scholar]
- 45.Holt HB, Wild SH, Wood PJ, et al. Non-esterified fatty acid concentrations are independently associated with hepatic steatosis in obese subjects. Diabetologia. 2006;49(1):141–8. doi: 10.1007/s00125-005-0070-x. [DOI] [PubMed] [Google Scholar]
- 46.Dasarathy S, Dasarathy J, Khiyami A, et al. Validity of real time ultrasound in the diagnosis of hepatic steatosis: a prospective study. J Hepatol. 2009;51(6):1061–7. doi: 10.1016/j.jhep.2009.09.001. [DOI] [PMC free article] [PubMed] [Google Scholar]
- 47.Lanaspa MA, Tapia E, Soto V, et al. Uric acid and fructose: potential biological mechanisms. Semin Nephrol. 2011;31(5):426–32. doi: 10.1016/j.semnephrol.2011.08.006. [DOI] [PubMed] [Google Scholar]
- 48.Lim JS, Mietus-Snyder M, Valente A, et al. The role of fructose in the pathogenesis of NAFLD and the metabolic syndrome. Nat Rev Gastroenterol Hepatol. 2010;7(5):251–64. doi: 10.1038/nrgastro.2010.41. [DOI] [PubMed] [Google Scholar]
Associated Data
This section collects any data citations, data availability statements, or supplementary materials included in this article.