Abstract
Microfluidics is emerging as a promising platform for cell culture, enabling increased microenvironment control and potential for integrated analysis compared to conventional macroculture systems such as well plates and petri dishes. To advance the use of microfluidic devices for cell culture, it is necessary to better understand how miniaturization affects cell behavior. In particular, microfluidic devices have significantly higher surface-area-to-volume ratios than conventional platforms, resulting in lower volumes of media per cell, which can lead to cell stress. We investigated cell stress under a variety of culture conditions using three cell lines: parental HEK (Human Embryonic Kidney) cells and transfected HEK cells that stably express wild type (WT) and mutant (G601S) human ether-a-go-go related gene (hERG) potassium channel protein. These three cell lines provide a unique model system through which to study cell-type-specific responses in microculture because mutant hERG is known to be sensitive to environmental conditions, making its expression a particularly sensitive readout through which to compare macro- and microculture. While expression of WT-hERG was similar in microchannel and well culture, the expression of mutant G601S-hERG was reduced in microchannels. Expression of the endoplasmic reticulum (ER) stress marker Immunoglobulin Binding Protein (BiP) was upregulated in all three cell lines in microculture. Using BiP expression, glucose consumption, and lactate accumulation as readouts we developed methods for reducing ER stress including properly increasing the frequency of media replacement, reducing cell seeding density, and adjusting the serum concentration and buffering capacity of culture medium. Indeed, increasing the buffering capacity of culture medium or frequency of media replacement partially restored the expression of the G601S-hERG in microculture. This work illuminates how biochemical properties of cells differ in macro- and microculture and suggests strategies that can be used to modify cell culture protocols for future studies involving miniaturized culture platforms.
INTRODUCTION
Microfluidics is becoming a widely-used tool for cell-based assays, enabling experiments with increased throughput, greater sensitivity, and controlled microenvironments that more closely represent in vivo conditions compared to conventional macroscale culture.1–4 With the burgeoning use of microfluidics for cell culture, it has become increasingly important to consider how aspects inherent to microfluidics affect cell viability and behavior. Several groups have undertaken studies to investigate the effects of microfluidic device material5–7 and factors such as gas exchange,8,9 evaporation,10,11 dielectrophoresis,12,13 and mechanical stress14–17 on microfluidic cell culture. In addition to these physical factors, it is also important to consider the biochemical effects of miniaturization on cell metabolism and stress. Previous studies have identified significant differences between micro- and macroscale culture with respect to cell proliferation, glucose metabolism, protein expression, and cells stress.18,19 These initial studies demonstrate the need for further characterization of the factors affecting cell behavior in microchannels. In particular, elucidating how stress responses differ in micro- and macroculture under a range of different culture conditions will provide insight that is transferable across a variety of microfluidic cell culture applications. Herein we use cardiotoxicity assays as a model microfluidic assay system through which to study some of the key factors affecting cell stress and assay performance, leading to improved culture conditions for microfluidic cardiotoxicity assays. The present study focuses on the static culture of adherent cells, where cells are seeded in microchannels using passive pumping,20 adhere on the bottom surface of the microfluidic channel, and are maintained in culture without continuous flow. Protocols for culturing adherent cells on surfaces typically utilize a fixed surface seeding density, i.e., fixed number of cells per unit area. Surface-area-to-volume ratios are inherently higher in microfluidic channels than conventional cultureware such as well plates or flasks. Hence, if the same surface cell density is used in microchannel and well plate culture, the volume per cell is significantly reduced in microculture. In some studies,21–23 the reduced culture volume in microscale has been beneficial, preventing the dilution of signaling molecules and in some cases enabling the development of in vitro models for paracrine signaling that have not been possible in larger volume well plate cultures. However, reduced culture volume may also be deleterious for cell health due to reduction of nutrients, growth factors, and media buffering capacity.19 The rapid accumulation of metabolic waste can also pose a problem in microchannel cell culture.
Drug associated cardiotoxicity can be lethal, and efficient methods for cardiotoxicity screening are crucial for pharmaceutical development. Among the targets for cardiotoxicity is the human ether-a-go-go related gene which encodes the hERG potassium channel that is key to normal cardiac repolarization. hERG-related cardiotoxicity occurs by two key mechanisms; 1) direct block of hERG channels, and 2) inhibition of hERG protein trafficking from the endoplasmic reticulum (ER) to the cell surface.24 Both mechanisms result in a reduction in hERG current to increase risk for drug-induced long QT syndrome and lethal cardiac arrhythmias.
We have previously adapted a known cell-based cardiotoxicity assay for microculture to boost throughput and reduce reagent consumption.25 This previous high-throughput microfluidic assay used live-cell Western analysis to target compounds that act through trafficking inhibition using human embryonic kidney (HEK) cells stably transfected with wild type (WT) hERG.25 Additional macroscale assays have been developed by other groups that employ mutant trafficking-deficient hERG channel proteins, such as the G601S (glycine to serine at amino acid 601) missense mutation, to identify direct hERG channel blockers that act to correct the protein trafficking abnormality.26–28 Furthermore, previous work has shown that G601S-hERG channel protein trafficking is also sensitive to environmental conditions such as temperature.29,30 Hence, one goal of this work was to determine if culture conditions that modulate cell stress in microchannels could alter the expression of G601S-hERG in microculture. By better understanding cell stress in micro- vs. macroculture, we aimed to develop culture conditions that would permit expression of both G601S-hERG and WT-hERG in microculture so that high-throughput microfluidic assays could be used to identify and discriminate between drugs that act through the two key mechanisms of cardiotoxicity described above, or by both mechanisms; such an assay would advance the capabilities of microfluidic cardiotoxicity screening and provide an approach complimentary to other recent microfluidic assays.31–33
Herein we used parental HEK cells and HEK cells expressing hERG (WT and G601S mutant) as a unique model to characterize cell stress in microchannel culture and its influence on cellular behavior. We considered a number of factors such as serum concentration, glucose concentration, and lactate accumulation (Figure 1) and additionally characterized the effects of culture time and cell seeding density on ER stress. A number of environmental stimuli, such as nutrient deprivation, can lead to ER stress, where unfolded protein builds up at the ER, triggering the unfolded protein response (UPR).34 As part of the UPR, expression of chaperones that prevent protein aggregation and help facilitate protein folding is increased. Immunoglobulin Binding Protein (BiP), a HSP70 class chaperone, recognizes and binds unfolded proteins, keeping them in a folding-competent state so they can advance on the folding pathway.34 Hence, we used BiP mRNA expression as a marker for ER stress.35 Our studies of ER stress and waste accumulation suggested that media buffering capacity and the frequency of media replenishment should be increased when adapting conventional cell culture procedures for microchannels. These culture condition modifications will enable future microfluidic cardiotoxicity studies that distinguish between two common mechanisms of toxicity: direct block of hERG and interference with hERG protein trafficking. Furthermore, our investigation provides general insight into some of the factors that cause cell stress in microculture and will enable better design of future microfluidic cell culture experiments for other applications.
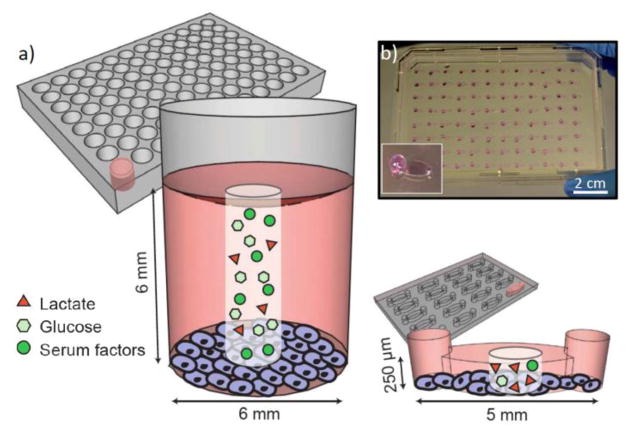
Figure 1.
a) Schematic diagram of 96-well and microchannel culture. The surface area-to-volume ratio differs by a factor of approximately seven between micro- and macroculture (1.1 mm2/μl in microchannels versus 0.15 mm2/μl in 96-well plates). When the same media is used in microchannels and 96-wells there is a seven-fold reduction in the available nutrients, such as glucose and serum factors, per cell. Conversely, the concentration of metabolic waste, such as lactate, increases more rapidly in microchannels than 96-well plates since there is less volume per cell to dilute waste products. b) Photograph illustrating an array of microchannels; inset shows one channel in detail with an aqueous drop at the channel output to facilitate passive pumping.
EXPERIMENTAL SECTION
Microchannel device preparation
Polydimethylsiloxane (PDMS) microchannels were prepared as described in our previous work25 using soft lithography methods.36 Briefly, SU-8 photoresist (Microchem) was spin-coated on a silicon wafer, soft-baked, exposed to UV light through a photomask to define channel features, baked, and developed with propylene glycol monomethyl ether acetate. PDMS channels were prepared using Sylgard 184 (Dow Corning) base silicone elastomer and the corresponding curing agent in a 10:1 weight ratio, which was poured on the SU-8 mold. After curing at 85 °C for 4 h on a hot plate, the PDMS channels were removed from the mold, extracted with ethanol using a Soxhlet extractor, dried, and autoclaved. The PDMS channels were passively bonded to tissue culture treated polystyrene trays (Omnitray, Nunc, Thermo Fisher Scientific) or tissue culture polystyrene petri dishes (Becton, Dickinson and Company).
Cell culture
Human embryonic kidney 293 (HEK) cells and transfected HEK cells that stably expressed wild type hERG protein (WT-hERG-HEK), and mutant hERG (G601S-hERG-HEK) were cultured as described previously.25 WT-hERG-HEK and G601S-hERG-HEK cells were previously described by Zhou et al.37,38 and Furutani et al.,39 respectively. HEK cells were cultured in complete minimum essential media (MEM) (Gibco) containing 1 g/L glucose, 10% fetal bovine serum (FBS), 0.1 mM non-essential amino acids (NEAA), penicillin (100 units/ml) and streptomycin (100 μg/ml), and 1 mM sodium pyruvate, and incubated at 37 °C with 5% CO2. When culturing WT-hERG-HEK and G601S-hERG-HEK cells, 400 μg/ml of the selective antibiotic geneticin (Gibco) was added to the culture media. The media described above was used to maintain cells in culture and for all experiments unless alternate glucose and FBS concentrations are indicated. Cells used in this work were below passage 30.
Cell culture in microchannels
Microchannels were incubated with 6 μl of serum-free MEM overnight at 37 °C; the media was replaced with complete media containing serum 30 min prior to cell seeding. As described previously,25 HEK, WT-hERG-HEK, and G601S-hERG-HEK cells from flasks were trypsinized, counted, and resuspended in culture media at 1000 to 4000 cells/μl. 3.2 μl of cell suspension was added to each microchannel via passive pumping. For all experiments except where indicated in Figures 4 and 7c and d, cells were seeded at a density of approximately 630 cells/mm2. To prevent evaporation, the omnitray or petri dish containing the microchannel devices was placed in a humidified tray containing distilled water and incubated at 37 °C with 5% CO2.
Figure 4.
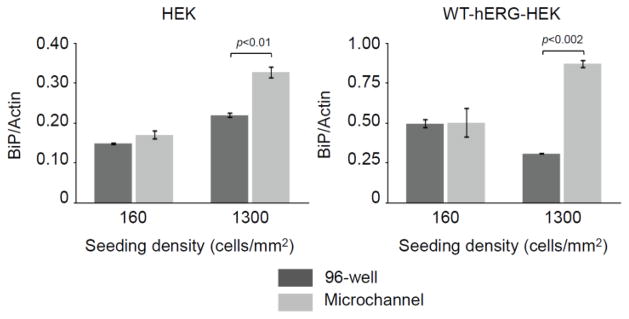
The effects of cell seeding density on BiP mRNA transcription. RT-qPCR analysis indicated that BiP expression was significantly higher in cells cultured in microchannels than in 96-well plates at high seeding density (1300 cells/mm2), whereas no significant difference was observed between BiP expression in microchannels and 96-well plate culture at 160 cells/mm2. Cells were cultured for 24 h in media containing 10% FBS and 1 g/L glucose. Data are the mean ± SE; n=3.
Figure 7.
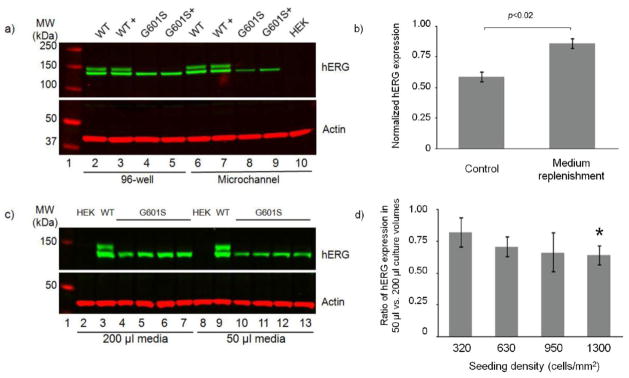
Western blot analysis of hERG protein expression from cell lysates from microchannels and wells after 24 h in culture. a) hERG protein expression in WT-hERG-HEK cells is similar in microchannels and 96-well culture, yielding bands corresponding to the immature core glycosylated form (135 kDa) and the complex glycosylated form (155 kDa) as expected. G601S-hERG-HEK cells express only the immature core glycosylated G601S mutant hERG, and expression of this protein was down-regulated in microchannels compared to 96-well culture. Frequent medium replenishment (12–24 h) (denoted with +) partially restored G601S-hERG expression in microchannels. As expected, parental HEK cells did not express hERG. The cell seeding density was 630 cells/mm2, and cells were cultured in media containing 10% FBS and 1 g/L glucose. Actin served as loading control. Each lane includes samples combined from 2–3 wells and 3–4 channels; an equal amount of protein was loaded on to the gel in each lane as described in the methods section. b) Quantification of hERG expression shown in part a from control G601S-hERG-HEK cells (corresponding to lane 8 in part a) and G601S-hERG-HEK cells cultured with medium replenishment (corresponding to lane 9 in part a) normalized to WT-hERG-HEK cell expression (corresponding to lane 7 in part a). (hERG expression was first normalized to actin and then normalized to WT-hERG-HEK cell expression.) Medium replenishment significantly increases hERG expression. Data are the mean ± SE from 4 independent experiments. c) In 96-well plates, hERG expression was reduced in G601S-hERG-HEK cells cultured in 50 μl of cell culture media compared to 200 μl of media. Lanes 2–7 and 8–13 show analysis of cells cultured in 200 and 50 μl of media, respectively. The cell seeding density for parental HEK and WT-hERG-HEK cells was 950 cells/mm2. G601S-hERG-HEK cells were seeded at 320 (lanes 4 and 10), 630 (lanes 5 and 11), 950 (lanes 6 and 12), and 1300 cells/mm2 (lanes 7 and 13). Actin was used as a loading control. Each lane includes samples combined from 2–3 wells; an equal amount of protein was loaded on to the gel in each lane as described in the methods section. d) Quantification of hERG expression shown in part c. The ratio of hERG expression (normalized to actin) from cells cultured in 50 μl of media to that from cells cultured in 200 μl media is plotted for four seeding densities. In each case the ratio is less than 1, indicating a trend of reduced hERG expression in 50 μl culture volumes; * indicates that the ratio is significantly different from 1 (p<0.05). Data are the mean ± SE from 2 independent experiments for 950 cells/mm2 and 3 independent experiments all other seeding densities.
Analysis of glucose concentration
Glucose concentration in recovered culture media was determined using the QuantiChrom Glucose Assay Kit (BioAssay Systems). Briefly, the media from either 96-well or microchannel culture was transferred to a low retention microcentrifuge tube and then centrifuged at 12000 rpm to remove cell debris. Then 2.5 μl of the supernatant was mixed with 500 μl of glucose assay reagent and boiled for 8 min. After cooling on ice, samples were transferred to a 96-well plate, analyzed via plate reader (SpectraMax® Plus384) colorimetric assay at 630 nm and compared to a standard curve.
Analysis of lactate concentration
Lactate concentration in the culture media was determined using EnzychromTM L-Lactate Assay Kit (Bioassay Systems). Samples were collected and centrifuge clarified as above in the glucose assay. 2.0 μl of sample was added to 96-well plate containing 18 μl of serum-free MEM, and then mixed with 80 μl of working reagent containing enzymes, NAD, and MTT. The differences in OD565 between time zero and 20 min incubation at RT were used to determine the sample L-lactate concentration from the standard curve.
Analysis of gene transcription by reverse-transcription polymerase chain reaction (RT-qPCR)
mRNA was isolated from cells cultured in 96-well plates or microchannels using Oligo-dT Dynabeads (Invitrogen). To keep the amount of mRNA consistent, the entire mRNA sample isolated from channels was used to prepare cDNA, whereas one third of the mRNA isolated from 96-well plate culture was used. To prepare cDNA, mRNA was incubated with 250 ng random primers (Promega, C1181), 40 U RNasin® Plus RNase inhibitor (Promega), 1 μl of 10 mM dNTP mix (Promega, C1141), and 200 U Superscript III reverse transcriptase (Invitrogen, 18080) at 50 °C for 1 h following supplier instructions. Real-time qPCR was performed on ABI StepOne sequence detection system (Applied Biosystem) using TaqMan qPCR master mix (Applied Biosystems) along primer/probe sets from Applied Biosystems for BiP (Hs99999174_m1) and β-Actin (Hs99999903_m1), which was used as a housekeeping gene to normalize the total number of molecules in each sample. Results are reported as BiP expression relative to the expression of actin. All PCR products had a denaturing step of 95 °C for 15 s and an annealing/extension step at 65 °C for 1 min for a total of 40 cycles. Quantification of mRNA was calculated using five serial dilutions of the same gene over a range that encompassed the values observed in the biological samples.
Western blot analysis
Western blotting was performed as described previously.25,37,38 Briefly, cells were lysed with lysis buffer and collected from microchannels. To facilitate equal protein loading, protein concentration in the cell lysates was first measured with a micro-BCA protein assay reagent kit (Pierce, Thermo Scientific). Protein was subjected to electrophoresis on a 4–12% NuPAGE gel (Invitrogen) and subsequently transferred electrophoretically onto nitrocellulose membranes. Primary antibody rabbit anti-hERG (Cruz, sc-20130, 1:1000) and mouse anti-actin monoclonal antibody (MP Biomedicals, 69100, 1:10000) were incubated with the membrane overnight at room temperature. Then, the membrane was incubated for an hour with IR Dye 800 CW-conjugated donkey anti-rabbit IgG (Rockland, 611-731-127) and IR Dye 680-conjugated goat anti-mouse IgG (LI-COR, 926-32220) secondary antibodies both at 1:10,000 dilution. Finally, protein bands were visualized by scanning the membrane at 700 and 800 channels using LI-COR Odyssey scanner (LI-COR). For quantification of Western blots shown in Figures 7b and d and 8 b, ImageJ was used to determine the integrated density of the bands.
Figure 8.
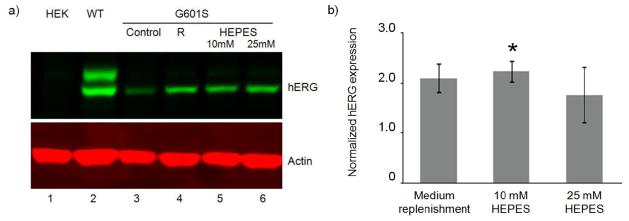
Addition of HEPES buffer partially restored G601S-hERG expression in microchannels. HEK, WT-hERG-HEK, and G601S-hERG-HEK cells were seeded at 630 cells/mm2 and cultured for 48 h in microchannels. Media contained 10% FBS and 1 g/L glucose. a) Western blot analysis indicated very low expression of G601S-hERG protein in G601S-hERG-HEK cells without medium replenishment (control, lane 3). G601S-hERG expression was partially restored with frequent medium replenishment (12–24 h) (R, lane 4), and with media modified by addition of 10 mM or 25 mM HEPES buffer (lanes 5 and 6, respectively). Each lane includes samples combined from 4 channels; an equal amount of protein was loaded on to the gel in each lane as described in the methods section. b) Quantification of hERG expression from G601S-hERG-HEK cells shown in part a (lanes 4–6) normalized to expression in control (lane 3 in part a). (hERG expression was first normalized to actin and then normalized to control.) In each case the ratio is greater than 1, indicating a trend of increased hERG expression with medium replenishment and HEPES addition compared to control; * indicates that the ratio is significantly different from 1 (p<0.05). Data are the mean ± SE from 3 independent experiments.
Imaging
Cells were seeded at the density of 630 cells/mm2 in 24-well or PDMS microchannels sitting inside a 24-well. Phase contrast images were taken at 10× magnification using an Olympus IX70 microscope equipped with an ORCA-AG CCD camera (Hamamatsu).
Statistics
In each figure caption, n refers to the number of channels and wells used in each experiment. For all figures, except those indicated below, statistical significance was determined using two-tailed t-tests, with p<0.05 indicated as significant. One sample t-tests were used in Figures 7d and 8b to compare the experimental values with the value 1. For analysis of data presented in Figure 3a, analysis of variance (ANOVA) tests were performed to evaluate if BiP expression differed significantly within the 96-wells and within the microchannels treated with different serum concentrations; in cases where p<0.05, further cross-comparisons were evaluated for significance using the Tukey’s multiple comparison test.
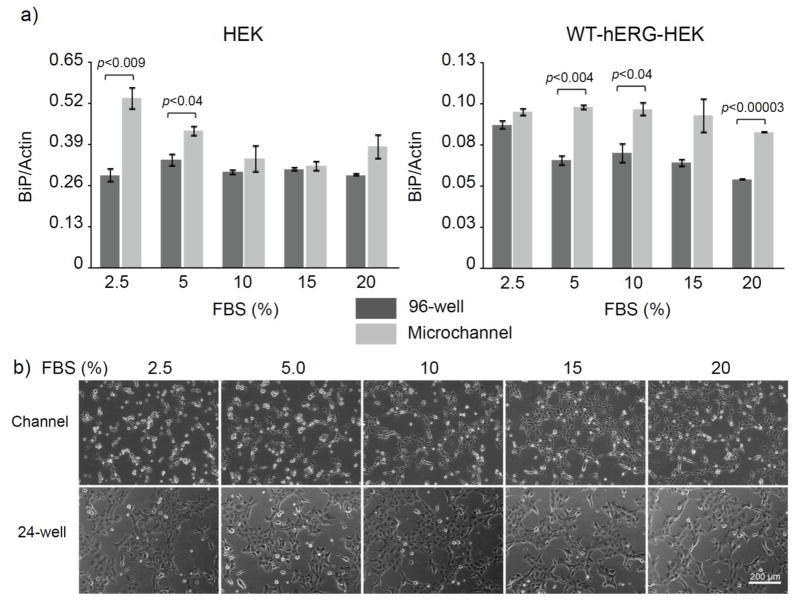
Figure 3.
The effects of FBS concentration on BiP mRNA transcription and cell attachment. a) RT-qPCR analysis of BiP mRNA transcription in HEK and WT-hERG-HEK cells cultured in microchannels and 96-well plates for 24 h in media containing 2.5–20% serum. Cells were seeded at a density of 630 cells/mm2, and media contained 1 g/L glucose. BiP expression in HEK cells was elevated at low serum concentrations (2.5 and 5%) in microchannels compared to 96-well culture, whereas BiP expression in WT-hERG-HEK cells remained high across all serum levels tested. Data are the mean ± SE; n=3. b) Phase contrast images of HEK cells after 24 h in microchannel or 24-well culture across a range of serum concentrations. Cell spreading is reduced in microculture under low serum conditions and partially recovers when 20% serum is used. Cells were seeded at a density of 630 cells/mm2 and cultured in media containing 1 g/L glucose. The images are representative of 2 wells and 4 channels from 2 independent experiments.
RESULTS AND DISCUSSION
BiP is upregulated in static microchannel culture
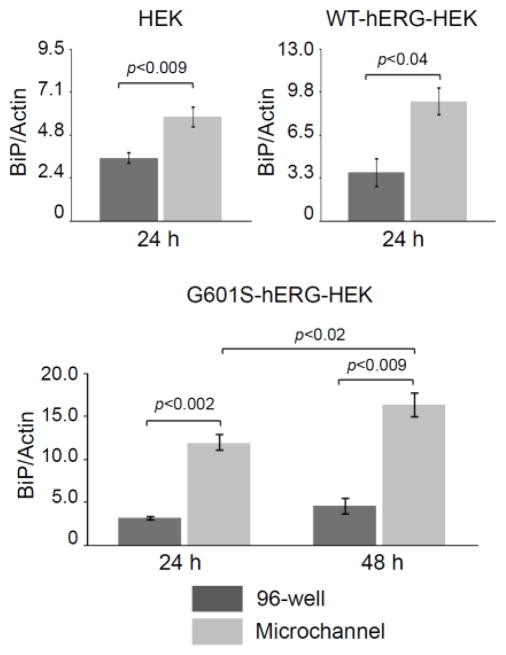
In microculture less volume is available for nutrient storage and waste accumulation per cell, potentially causing cell stress. We used parental HEK and HEK cell lines expressing WT- and G601S-hERG to investigate the effects of different microfluidic culture conditions using BiP as a molecular marker for ER stress. In all three cell lines, BiP transcription (determined by RT-qPCR) was significantly upregulated in cells cultured in microfluidic channels compared with those cultured in the 96-well plate, after 24 h in culture (Figure 2). In G601S-hERG-HEK cells, we monitored BiP expression after 24 and 48 h in culture. Notably, levels of BiP mRNA were significantly higher at 48 h than those at 24 h in microchannel culture, suggesting increased cell stress over time, potentially caused by nutrient reduction and/or waste accumulation. A similar trend of BiP upregulation in microculture was seen in both MMF (mouse mammary fibroblasts)19 and NMuMG (normal murine mammary gland epithelial) cells (see SI, Figure S-1) when they were cultured in the microfluidic channels, indicating that these results may be generalizable to other cell types.
Figure 2.
BiP mRNA expression is upregulated in microchannel cell culture compared to 96-well cell culture under standard culture conditions. HEK and WT-hERG-HEK cells were cultured for 24 h, and G601S-hERG-HEK cells were cultured for 24 h or 48 h in media containing 10% FBS and 1 g/L glucose. Cells were seeded at a density of 630 cells/mm2. RT-qPCR analysis showed BiP mRNA expression was significantly higher in microchannels than 96-wells for all three cell lines. Results are the average ± standard error (SE); n=3 (wells) and n=3–4 (microchannels).
Effects of medium replenishment, serum, and seeding density on cell stress
Serum used to supplement cell culture media contains hormones and growth factors, which play critical roles in regulation of cell growth and function. To investigate whether reduced nutrient availability in microchannels contributes to the mechanism inducing increased ER stress, we studied the effect of medium replenishment and different initial concentrations of serum on BiP expression. Media was changed after 21 h in culture, and BiP mRNA levels were measured 3 h after the media was replenished. Medium replenishment resulted in a decrease in BiP levels in comparison to cells cultured without medium replenishment, indicating that replenishing the media alleviates cell stress (see SI, Figure S-2a). However, subsequent experiments with increased frequency of medium replenishment (6–12 h intervals) indicated that overfeeding can lead to abnormal cellular morphology (see SI, Figure S-2b).
Changing the culture media both replenishes serum components and removes waste products and secreted factors. To specifically address the effect of serum supply on the cell stress in microfluidic culture, HEK and WT-hERG-HEK cells were cultured in media containing concentrations of serum ranging from 2.5 to 20% (Figure 3a). In HEK cells, levels of BiP mRNA were significantly upregulated in the microfluidic culture system compared with well culture at 2.5% and 5% serum. In these experiments, BiP expression in HEK cells cultured in channels was not significantly upregulated compared to well culture when 10–20% FBS was used. In the WT-hERG-HEK cells, BiP was significantly upregulated in microculture compared with well culture at 5%, 10%, and 20% serum.
In addition to the macro versus microscale comparisons indicated above, we also observed trends within the 96-well data and within the microculture data shown in Figure 3a; in data sets with significant variation (p<0.05 by ANOVA) individual data points were compared using the Tukey’s test, with p<0.05 indicated as significant in the following discussion. In the 96-well culture system, levels of BiP mRNA in parental HEK and WT-hERG-HEK cells were comparable across serum concentrations. A notable exception is that BiP mRNA was significantly higher in the WT-hERG-HEK cells cultured with 2.5% than 5, 15, and 20% serum. Within the microchannel data, levels of BiP mRNA were significantly upregulated in HEK cells cultured with 2.5% serum in comparison to 10% and 15% serum. BiP expression in microcultured WT-hERG-HEK cells was not significantly reduced across the different serum conditions tested. That BiP expression remained high in WT-hERG-HEK cells in microculture even at high serum concentrations might be attributed to the fact that chaperone activities at the ER are elevated in this cell line compared to parental HEK cells as hERG protein is processed at the ER.
Serum contains factors that help facilitate initial attachment and survival. Varying the serum concentration from 2.5% to 20% FBS seemed to have little effect on the cell attachment and spreading in the HEK cells seeded in a 24-well plate (Figure 3b). In contrast, a change in serum concentration from 2.5% to 20% had obvious effects on HEK attachment and spreading in microfluidic channels (Figure 3b), which might be attributed to the reduced culture volume and concomitant reduction in serum per cell in microculture versus well culture. HEK cell attachment and spreading in microchannels improved at 15% and 20% serum compared to 10% serum, however spreading was still reduced compared to the well plate culture. The recovery at higher serum concentrations in microculture suggests that the changes in cell attachment and morphology result from a concentration effect and are not necessarily inherent to microculture. Indeed, when HEK cells were cultured in 24-well plates using a further reduced serum concentration (0.125% serum) the attachment was reduced and cell morphology was affected (see SI, Figure S-3a). The attachment and spreading of WT-hERG-HEK and G601S-hERG-HEK cells showed a similar trend to parental HEK cells at the varied concentrations of serum when they were cultured in the microfluidic channels, compared to the well culture (Figure S-3 b, c). In general, cells adhered and spread better in well-flask culture, even at a 2.5% serum. However, cell attachment and spreading was relatively poor in the microfluidic channels, particularly at lower serum concentrations. Interestingly, the serum concentrations affected cell spreading to different degrees in a cell type-dependent manner. The WT-hERG-HEK cells exhibited the most pronounced difference, with reduced cell size when cultured in microfluidic channels compared to well-flask culture. WT-hERG-HEK cells were also the most sensitive to very low serum concentration (0.125%) in well culture.
The reduction in serum available per cell in microculture should be considered in experimental design, especially in future work requiring low-serum conditions as is necessitated by many experiments in order to observe specific biological responses. Experimental conditions for low-serum culture have already been developed for a variety of conventional assays in well plate culture, but these conditions often need to be modified when adapting an assay for microculture. For example, the mouse myofibroblast cell line UGSM-240 can be cultured under low-serum conditions (0.5% FBS) in 96-well plates, but to optimize conditions for microculture Domenech and co-workers employed slightly elevated serum concentrations (3.5% FBS) for low-serum assays with UGSM-2 cells in microchannels.22 For many low serum assays, increasing the serum concentration several fold may be necessary to maintain cells in microculture.
Increasing cell density in microfluidic culture further limits the amount of media per cell, making it challenging for cells to obtain nutrients and growth factors. This effect is particularly relevant in media containing low levels of serum. To determine the effect of cell seeding density on cell stress, the HEK and WT-hERG-HEK cells were cultured with standard media with 10% serum in microfluidic devices and a 96-well plate. The cells were seeded at densities of 160 or 1300 cells/mm2. At the low seeding density there was not a significant difference between BiP expression in microchannels and wells. In contrast, at the higher seeding density, BiP expression was significantly higher in microchannels than in wells (Figure 4). Overall, our results support the hypothesis that increased cell seeding density increases cell stress when cells are cultured in low-volume conditions such as microculture.
Glucose is rapidly depleted in microculture
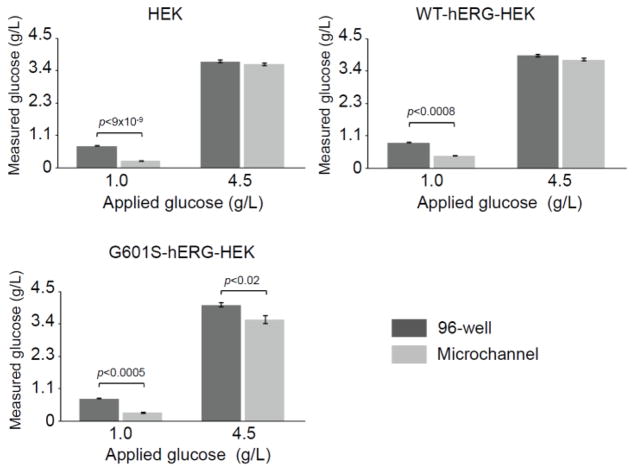
Glucose is a source of energy in cell culture media, and glucose depletion can lead to increased ER stress. In fact, the ER stress marker BiP was first identified in glucose-deprived cells and was originally named Grp78 (glucose regulated protein).41 Our previous studies with MMF cells have indicated that the glucose depletion rate is higher in cells cultured in microfluidic devices than macroscale cultureware.19 We hypothesized that the upregulation of BiP may be connected to glucose starvation in the microfluidic system. To address this hypothesis, we determined if the glucose depletion from the media was faster in parental HEK and WT- and G601S-hERG-HEK cells cultured in microchannels than in 96-well plate culture (Figure 5). The cells were cultured with media containing either standard (1 g/L) or high (4.5 g/L) glucose concentrations. In the three cell lines, rapid glucose consumption was seen in the microfluidic device after 24 h culture when the standard glucose-containing media was used, resulting in significantly lower levels of residual glucose in microculture compared with well culture. When the higher glucose-containing media was used, a significant difference between residual glucose in microculture and well culture was only observed in the G601S-hERG-HEK cells, not in HEK or WT-hERG-HEK cells. Surprisingly, increasing the glucose concentration did not alter the transcription of the BiP gene in microfluidic culture (see SI, Figure S-4). It is worth noting, however, that due to the increased surface-area-to-volume ratio in microculture (1.1 mm2/μl in microchannels versus 0.15 mm2/μl in 96-well plates), the number of glucose molecules available per cell varies by a factor of approximately seven, meaning that the number of glucose molecules available per cell is higher at the standard glucose concentration in wells than at the high glucose concentration in microchannels.
Figure 5.
Effect of initial glucose concentration on glucose level in cell culture supernatant after 24 h cell culture. Cells were cultured in media containing standard (1 g/L) and high (4.5 g/L) glucose concentrations. Cells were seeded at a density of 630 cells/mm2 and cultured in media containing 10% FBS. At 24 h post seeding, the cell culture supernatant contained significantly less glucose in microchannels than 96-wells when media containing 1 g/L glucose was used. When a higher initial glucose concentration (4.5 g/L) was used, the glucose concentration in microchannels was only significantly lower than that in wells for the G601S-hERG-HEK cells. Data are the mean ± SE; n=3 (wells) and n=5 (microchannels).
Accumulation of metabolic waste is more rapid in microfluidic cell culture
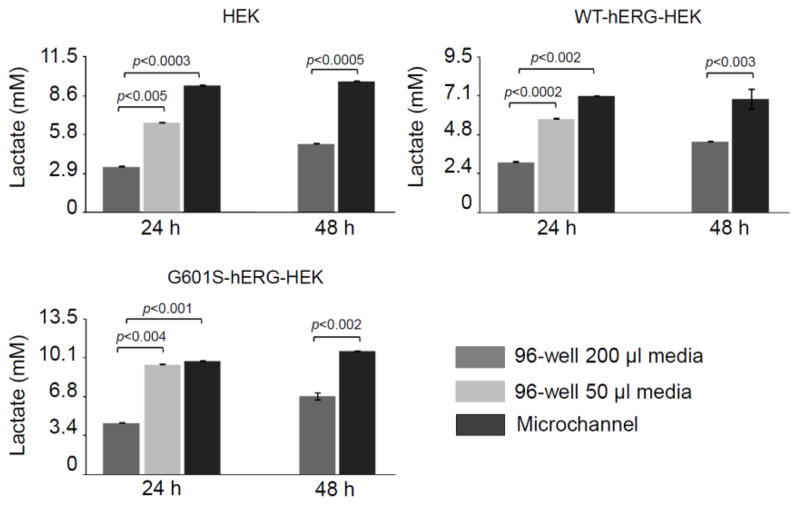
To determine if waste accumulation is faster in microfluidic culture, the concentration of lactate, one of the main metabolic waste products in the media, was measured. The cell culture media was collected from microfluidic and well culture at 24 and 48 h post seeding (Figure 6). Lactate accumulated rapidly in microfluidic culture, reaching high levels after just 24 h in culture. There was no further increase in lactate concentration between 24 and 48 h in microfluidic culture. In contrast, for all three cell lines, a significant increase (p<0.005) in lactate concentration was observed in well culture from 24 to 48 h when 200 μl of culture media was used. For all three cell lines, the lactate concentrations were significantly lower in the 96-well plate than in the microchannel at both 24 h and 48 h when 200 μl of culture media was used. Interestingly, when 50 μl of culture media was used in 96-well plate culture, significantly higher concentrations of lactate were observed after 24 h than when 200 μl of culture media was used. The volume of media used in cell culture has a clear effect on the final media concentration of metabolic waste generated by living cells.
Figure 6.
Lactate accumulates rapidly in microculture. Cell culture media from the same surface seeding density contained significantly higher concentrations of lactate in microchannels than 96-wells supplied with 200 μl media/well at both 24 h and 48 h. The lactate concentration was also significantly higher in 96-well supplied with 50 μl of media than in wells supplied with 200 μl of media after 24 h in culture. Cells were seeded at a density of 630 cells/mm2 and cultured in media containing 10% FBS and 1 g/L glucose. Data are the mean ± SE; n=3 (wells) and n=4 (microchannels).
Other groups have observed a reduction in cell culture performance due to accumulation of lactate in large scale batch culture systems.42–44 Lactate accumulation adversely affected growth in Chinese hamster ovary (CHO) cells.43 Duval and colleagues showed that lactic acid concentrations generated in hybridoma cell culture were cytotoxic and that in their system lactate toxicity results from its effect on medium pH. When lactic acid was neutralized, its toxicity to hybridoma cell cultures was essentially eliminated.42
Medium replenishment increases the expression of mutant G601S-hERG protein in microfluidic culture
The parental HEK and HEK cells stably expressing WT- and G601S-hERG were seeded at 630 cells/mm2 in microfluidic channels or in a 96-well plate and cultured for 48 h. Western blot analysis of the cell lysates from WT-hERG-HEK cells showed two protein bands, representing two forms of hERG protein—the immature core-glycosylated form that remains at the ER (135 kDa) and the functional N-linked glycosylated mature form that is exported to the cell membrane (155 kDa), as expected based on previous characterization of this cell line.37,38 The G601S-hERG-HEK cells expressed trafficking deficient mutant hERG, only showing the 135 kDa form of the protein (Figure 7a) as demonstrated in previous work.39 As expected, HEK parental cells did not express hERG protein. There was no apparent change in WT-hERG expression between the 96-well plate and microfluidic channels (Figure 7a). However, the expression of G601S-hERG was obviously downregulated in the microfluidic channels compared with that in the 96-well plate at 48 h post seeding. To determine if serum replenishment could enhance the G601S-hERG expression, we increased the frequency of medium replenishment (12–24 h interval). With frequent medium replenishment, G601S-hERG expression was partially restored in the microfluidic channels (Figure 7a, b), with no apparent change in expression in 96-well plate culture.
To further determine if the effect of culture volume on the G601S-hERG expression was device-independent, the parental HEK cells and WT- and G601S-hERG-HEK cells were seeded in a 96-well plate and cultured with either 200 μl or 50 μl of culture media for 48 h. Western blot analysis showed downregulation of G601S-hERG expression in the 96-well culture with 50 μl/well culture media compared with 200 μl/well culture media (Figure 7c, d). Our results suggest that the four-fold reduction in volume of culture media was sufficient to alter the expression of G601S-hERG in the 96-well plate, further supporting the hypothesis that decreased expression of G601S-hERG in the microfluidic channels was attributed to the limited volume of culture media.
Addition of HEPES to culture media partially restored the expression of mutant G601S-hERG protein in microfluidic culture
Since our results showed that lactate accumulated rapidly in microchannels (Figure 6), we determined if increasing the buffering capacity of the culture media affects G601S-hERG expression in the microfluidic channels. HEPES buffer is not included in the standard media for these cells, so we added HEPES buffer to increase media buffering capacity. Figure 8 shows that introducing HEPES buffer at concentrations as low as 10 mM to the cell culture media allowed for partially restored G601S-hERG expression in the microfluidic channels after 48 h in culture. Interestingly, increasing the buffering capacity of the culture media resulted in similar levels of G601S-hERG expression to those observed with medium replenishment. Taken together with the measured accumulation of lactate in channels (Figure 6) these results suggest that the reduced expression of G601S-hERG in the microfluidic culture might be partially attributed to pH change and can therefore be partially rescued by properly adjusting the buffering capacity of the culture media. This also suggests that metabolic waste accumulation may not be negligible in microchannel culture even if waste accumulation is negligible in flask/well culture under our experimental conditions.
CONCLUSION
Microfluidic technologies for cell culture bring to bear the control of microfabrication and the sensitivity of integrated analytical methods on fundamental biological questions. To advance the use of microculture techniques, further characterization of how cell behavior differs in microscale and macroscale systems is required. The work presented herein provides an investigation of how cell stress is affected by different microscale culture parameters particularly important for improving microfluidic cardiotoxicity assays, providing insight needed to help design further microfluidic approaches for cell biology. Studies of additional factors that affect cell behavior, such as oxidative stress, are ongoing within our laboratory.
We have previously shown that HEK and WT-hERG-HEK cells could be cultured in microchannels and used for cell-based cardiotoxicity assays.25 WT-hERG-HEK cells express a comparable amount of hERG protein in microchannel culture and in 96-wells and hold great promise for usage in microfluidic based high-throughput drug toxicity screening.25 In contrast, when G601S-hERG-HEK cells were cultured in microchannels, trafficking deficient G601S-hERG expression was significantly reduced, limiting the use of microculture for testing drug toxicity. Interestingly, frequent medium replenishment partially restored G601S-hERG expression, potentially indicating that shortage of nutrients in microchannels or the rapid accumulation of metabolic waste affects protein expression, especially for longer culture times (>24 h). It is known that G601S-hERG in stably transfected HEK cells is sensitive to environment temperature.29,30 Considering the known sensitivity of mutant hERG and the observed reduction in G601S-hERG levels in microchannel culture, HEK, WT-hERG-HEK, and G601S-hERG-HEK cell lines served as a good model system to investigate the differences between microchannel culture and macroscale culture, particularly with regard to cell stress. This study developed improved microculture conditions that can be applied to both future experiments with other cell lines and can also be used to increase the repertoire of available microfluidic cardiotoxcity assays. Specifically, the culture conditions developed in this study facilitate expression of G601S-hERG in microculture, potentially enabling microfluidic technology to be used in the future for assays that rely on the mutant G601S-hERG to distinguish between hERG blockers and compounds that inhibit hERG trafficking.26–28
This work elucidates important differences between micro- and macroscale cell culture and demonstrates methods for improving culture conditions in microchannels. Due to the elevated culture density in microchannels, cells are more susceptible to nutrient shortage and build up of metabolic waste as evidenced by differences in cell attachment and morphology and increased expression of the cell stress marker BiP. Depending on the application, cell culture protocols need to be modified during miniaturization. Based on our findings, feeding cells more frequently (~24 h) is recommended for sensitive cell types. Our results also indicate that adjusting the serum concentration and/or buffering capacity of the cell culture media is necessary for some biological applications. Microculture is being used increasingly to conduct experiments where enhanced control over cell microenvironment, reduced cell and reagent consumption, or higher throughput is required. This work advances our understanding of how cells behave in microculture and will inform the design of future microculture experiments, helping to refine culture conditions for this evolving platform technology.
Supplementary Material
Acknowledgments
This research was supported by NIH-NCI R33 CA137673 and R01 HL60723. ABT was supported by the UW-Madison Molecular and Environmental Toxicology Center, NIH grant T32ES007015. We thank Dr. Zhanhai Li for assistance with statistical analysis and Dr. Keil J. Regehr for microchannel design and master fabrication.
Footnotes
Supporting Information. Additional phase contrast images of cells cultured in media with varied levels of serum and further data on the effects of medium replenishment and glucose concentration are provided in the Supporting Information. This material is available free of charge via the Internet at http://pubs.acs.org.
References
- 1.El-Ali J, Sorger PK, Jensen KF. Nature. 2006;442:403–411. doi: 10.1038/nature05063. [DOI] [PubMed] [Google Scholar]
- 2.Young EWK, Beebe DJ. Chem Soc Rev. 2010;39:1036–48. doi: 10.1039/b909900j. [DOI] [PMC free article] [PubMed] [Google Scholar]
- 3.van Midwoud PM, Verpoorte E, Groothuis GM. Integr Biol. 2011;3:509–21. doi: 10.1039/c0ib00119h. [DOI] [PubMed] [Google Scholar]
- 4.Kovarik ML, Gach PC, Ornoff DM, Wang Y, Balowski J, Farrag L, Allbritton NL. Anal Chem. 2012;84:516–40. doi: 10.1021/ac202611x. [DOI] [PMC free article] [PubMed] [Google Scholar]
- 5.Regehr KJ, Domenech M, Koepsel JT, Carver KC, Ellison-Zelski SJ, Murphy WL, Schuler LA, Alarid ET, Beebe DJ. Lab Chip. 2009;9:2132–9. doi: 10.1039/b903043c. [DOI] [PMC free article] [PubMed] [Google Scholar]
- 6.Wlodkowic D, Faley S, Skommer J, McGuinness D, Cooper JM. Anal Chem. 2009;81:9828–33. doi: 10.1021/ac902010s. [DOI] [PubMed] [Google Scholar]
- 7.van Midwoud PM, Janse A, Merema MT, Groothuis GM, Verpoorte E. Anal Chem. 2012;84:3938–44. doi: 10.1021/ac300771z. [DOI] [PubMed] [Google Scholar]
- 8.Mehta G, Mehta K, Sud D, Song JW, Bersano-Begey T, Futai N, Heo YS, Mycek MA, Linderman JJ, Takayama S. Biomed Microdevices. 2007;9:123–34. doi: 10.1007/s10544-006-9005-7. [DOI] [PubMed] [Google Scholar]
- 9.Bose N, Das T, Chakraborty D, Maiti TK, Chakraborty S. Lab Chip. 2012;12:69–73. doi: 10.1039/c1lc20888h. [DOI] [PubMed] [Google Scholar]
- 10.Heo YS, Cabrera LM, Song JW, Futai N, Tung YC, Smith GD, Takayama S. Anal Chem. 2007;79:1126–34. doi: 10.1021/ac061990v. [DOI] [PMC free article] [PubMed] [Google Scholar]
- 11.Berthier E, Warrick J, Yu H, Beebe DJ. Lab Chip. 2008;8:852–859. doi: 10.1039/b717422e. [DOI] [PMC free article] [PubMed] [Google Scholar]
- 12.Desai SP, Voldman J. Integr Biol. 2011;3:48–56. doi: 10.1039/c0ib00067a. [DOI] [PMC free article] [PubMed] [Google Scholar]
- 13.Lu J, Barrios CA, Dickson AR, Nourse JL, Lee AP, Flanagan LA. Integr Biol. 2012 doi: 10.1039/C2IB20171B. In press. [DOI] [PMC free article] [PubMed] [Google Scholar]
- 14.Yin H, Zhang X, Pattrick N, Klauke N, Cordingley HC, Haswell SJ, Cooper JM. Anal Chem. 2007;79:7139–44. doi: 10.1021/ac071146k. [DOI] [PubMed] [Google Scholar]
- 15.Yin H, Pattrick N, Zhang X, Klauke N, Cordingley HC, Haswell SJ, Cooper JM. Anal Chem. 2008;80:179–85. doi: 10.1021/ac701958z. [DOI] [PubMed] [Google Scholar]
- 16.Toh YC, Voldman J. FASEB J. 2011;25:1208–17. doi: 10.1096/fj.10-168971. [DOI] [PMC free article] [PubMed] [Google Scholar]
- 17.Douville NJ, Zamankhan P, Tung YC, Li R, Vaughan BL, Tai CF, White J, Christensen PJ, Grotberg JB, Takayama S. Lab Chip. 2011;11:609–19. doi: 10.1039/c0lc00251h. [DOI] [PubMed] [Google Scholar]
- 18.Yu H, Alexander CM, Beebe DJ. Lab Chip. 2007;7:726–730. doi: 10.1039/b618793e. [DOI] [PubMed] [Google Scholar]
- 19.Paguirigan AL, Beebe DJ. Integr Biol. 2009;1:182–195. doi: 10.1039/b814565b. [DOI] [PMC free article] [PubMed] [Google Scholar]
- 20.Walker G, Beebe DJ. Lab Chip. 2002;2:131–134. doi: 10.1039/b204381e. [DOI] [PubMed] [Google Scholar]
- 21.Domenech M, Yu H, Warrick J, Badders NM, Meyvantsson I, Alexander CM, Beebe DJ. Integr Biol. 2009;1:267–274. doi: 10.1039/b823059e. [DOI] [PMC free article] [PubMed] [Google Scholar]
- 22.Domenech M, Bjerregaard R, Bushman W, Beebe DJ. Integr Biol. 2012;4:142–152. doi: 10.1039/c1ib00104c. [DOI] [PMC free article] [PubMed] [Google Scholar]
- 23.Przybyla L, Voldman J. Annu Rev Anal Chem. 2012;5:293–315. doi: 10.1146/annurev-anchem-062011-143122. [DOI] [PMC free article] [PubMed] [Google Scholar]
- 24.Hancox JC, McPate MJ, El Harchi A, Zhang YH. Pharmacol Ther. 2008;119:118–32. doi: 10.1016/j.pharmthera.2008.05.009. [DOI] [PubMed] [Google Scholar]
- 25.Su X, Young EWK, Underkofler HAS, Kamp TJ, January CT, Beebe DJ. J Biomol Screen. 2011;16:101–111. doi: 10.1177/1087057110386218. [DOI] [PMC free article] [PubMed] [Google Scholar]
- 26.Wible BA, Hawryluk P, Ficker E, Kuryshev YA, Kirsch G, Brown AM. J Pharmacol Toxicol Methods. 2005;52:136–45. doi: 10.1016/j.vascn.2005.03.008. [DOI] [PubMed] [Google Scholar]
- 27.Ficker E, Obejero-Paz CA, Zhao S, Brown AM. J Biol Chem. 2002;277:4989–98. doi: 10.1074/jbc.M107345200. [DOI] [PubMed] [Google Scholar]
- 28.Zhou Z, Gong Q, January CT. J Biol Chem. 1999;274:31123–6. doi: 10.1074/jbc.274.44.31123. [DOI] [PubMed] [Google Scholar]
- 29.Li P, Ninomiya H, Kurata Y, Kato M, Miake J, Yamamoto Y, Igawa O, Nakai A, Higaki K, Toyoda F, Wu J, Horie M, Matsuura H, Yoshida A, Shirayoshi Y, Hiraoka M, Hisatome I. Circ Res. 2011;108:458–68. doi: 10.1161/CIRCRESAHA.110.227835. [DOI] [PubMed] [Google Scholar]
- 30.Anderson CL, Delisle BP, Anson BD, Kilby JA, Will ML, Tester DJ, Gong Q, Zhou Z, Ackerman MJ, January CT. Circulation. 2006;113:365–373. doi: 10.1161/CIRCULATIONAHA.105.570200. [DOI] [PubMed] [Google Scholar]
- 31.Pihl J, Sinclair J, Sahlin E, Karlsson M, Petterson F, Olofsson J, Orwar O. Anal Chem. 2005;77:3897–903. doi: 10.1021/ac050218+. [DOI] [PubMed] [Google Scholar]
- 32.Kim MJ, Lee SC, Pal S, Han E, Song JM. Lab Chip. 2011;11:104–14. doi: 10.1039/c0lc00110d. [DOI] [PubMed] [Google Scholar]
- 33.Golden AP, Li N, Chen Q, Lee T, Nevill T, Cao X, Johnson J, Erdemli G, Ionescu-Zanetti C, Urban L, Holmqvist M. Assay Drug Dev Technol. 2011;9:608–19. doi: 10.1089/adt.2010.0362. [DOI] [PubMed] [Google Scholar]
- 34.Schröder M, Kaufman RJ. Annu Rev Biochem. 2005;74:739–89. doi: 10.1146/annurev.biochem.73.011303.074134. [DOI] [PubMed] [Google Scholar]
- 35.Lee AS. Methods. 2005;35:373–381. doi: 10.1016/j.ymeth.2004.10.010. [DOI] [PubMed] [Google Scholar]
- 36.Duffy D, McDonald J, Schueller O, Whitesides G. Anal Chem. 1998;70:4974–4984. doi: 10.1021/ac980656z. [DOI] [PubMed] [Google Scholar]
- 37.Zhou Z, Gong Q, Epstein ML, January CT. J Biol Chem. 1998;273:21061–21066. doi: 10.1074/jbc.273.33.21061. [DOI] [PubMed] [Google Scholar]
- 38.Zhou Z, Gong Q, Ye B, Fan Z, Makielski JC, Robertson GA, January CT. Biophys J. 1998;74:230–241. doi: 10.1016/S0006-3495(98)77782-3. [DOI] [PMC free article] [PubMed] [Google Scholar]
- 39.Furutani M, Trudeau MC, Hagiwara N, Seki A, Gong Q, Zhou Z, Imamura S, Nagashima H, Kasanuki H, Takao A, Momma K, January CT, Robertson GA, Matsuoka R. Circulation. 1999;99:2290–4. doi: 10.1161/01.cir.99.17.2290. [DOI] [PubMed] [Google Scholar]
- 40.Shaw A, Papadopoulos J, Johnson C, Bushman W. Prostate. 2006;66:1347–1358. doi: 10.1002/pros.20357. [DOI] [PMC free article] [PubMed] [Google Scholar]
- 41.Lee AS. Trends Biochem Sci. 2001;26:504–510. doi: 10.1016/s0968-0004(01)01908-9. [DOI] [PubMed] [Google Scholar]
- 42.Duval D, Demangel C, Miossec S, Geahel I. Hybridoma. 1992;11:311–322. doi: 10.1089/hyb.1992.11.311. [DOI] [PubMed] [Google Scholar]
- 43.Lao MS, Toth D. Biotechnol Prog. 1997;13:688–691. doi: 10.1021/bp9602360. [DOI] [PubMed] [Google Scholar]
- 44.Mulukutla BC, Khan S, Lange A, Hu WS. Trends Biotechnol. 2010;28:476–484. doi: 10.1016/j.tibtech.2010.06.005. [DOI] [PubMed] [Google Scholar]
Associated Data
This section collects any data citations, data availability statements, or supplementary materials included in this article.


