Abstract
Diffusional kurtosis imaging (DKI), which measures the non-Gaussianity of water diffusion, has been demonstrated to be a sensitive biomarker in many neuropathologies. The goal of this study was to longitudinally examine the spatiotemporal dynamics of DKI in cerebral ischemia in an animal model of permanent and transient (45 min) middle cerebral artery occlusion (MCAO) during the hyperacute, acute and chronic phases. Diffusional kurtosis showed different spatiotemporal dynamics. In particular, mean kurtosis (MK) was sensitive to hyperacute and acute stroke changes, and exhibited different contrast than mean diffusivity (MD) and higher contrast than fractional anisotropy (FA) and T2. MK contrast persisted 1 to 7 days post-occlusion, whereas MD showed renormalization at day 1–2 and reversed contrast at day 7. The current study showed that DKI has the potential to complement existing stroke imaging techniques, particularly in the assessment of subacute to early chronic stroke evolution.
Keywords: Diffusional kurtosis imaging, Mean kurtosis, Cerebral ischemia, MCAO, Perfusion, Diffusion
1. Introduction
The anatomical mismatch between diffusion-weighted (DWI) and perfusion-weighted imaging (PWI) abnormality offers remarkable sensitivity to ischemic brain injury (Schlaug et al., 1999). However, some mismatch tissue are oligemic, some are salvageable and some are not, depending on the duration and nature of ischemic injury, and proximity of patent vessels, among other factors. Thus, the perfusion–diffusion mismatch only approximates the ischemic penumbra. Despite its shortcomings (Kidwell et al., 2003), the mismatch is commonly used to guide clinical decision making in acute stroke management. By contrast, conventional T2-weighted (T2W) images and computed tomography could not detect ischemic injury until at least 6 hours after stroke onset, coinciding with vasogenic edema at which point the tissue has already become infarct (Baird and Warach, 1998). Other methods are being explored to improve characterization of ischemic brain injury.
Diffusional kurtosis is a measure of the non-Gaussianity of water diffusion (Jensen et al., 2005). Free, unrestricted water diffusion has a Gaussian distribution, and thus a zero diffusional kurtosis. Restricted water diffusion has a distribution that is sharper than Gaussian, hence positive diffusional kurtosis. Tissue microstructures that restrict water diffusion include cell membranes, organelles and tissue compartments, among other factors. In other words, diffusional kurtosis characterizes the complexity or heterogeneity of the tissue microenvironment (Jensen et al., 2005). In diseases, such as ischemic brain injury, diffusional kurtosis could change due to: i) cytotoxic edema, ii) progressive alteration in cell packing geometry, iii) cell membrane permeability changes, and/or iv) change in cell size distribution as a result of cell necrosis (Baird and Warach, 1998; Fung et al., 2011). Diffusional kurtosis imaging (DKI) has some advantages over conventional DTI because of its sensitivity to tissue heterogeneity, especially isotropic grey matter (GM) (Jensen and Helpern, 2010; Jensen et al., 2005). DKI thus has the potential to provide additional insights of tissue microstructure (Jensen and Helpern, 2010).
DKI has recently been used to study human ischemic stroke. Diffusional kurtosis increased at 1 to 5 days after stroke onset (Helpern et al., 2009; Jensen et al., 2010; Latt et al., 2009b; Peeters et al., 2010; van Westen et al., 2010) and exhibited distinct abnormalities that were not apparent on conventional DWI/DTI or apparent diffusion coefficient (ADC) map (Helpern et al., 2009). Latt et al. investigated the presence of water exchange in ischemic lesion by varying the diffusion time in DKI acquisition in humans (Latt et al., 2009b). Diffusional kurtosis of both white matter (WM) and, to a lesser extent, GM lesions varied with diffusion time at 1 to 5 days after stroke onset, while mean diffusivity (MD) and normal tissue did not. DKI has also been used to study normal WM and GM microstructures (Cheung et al., 2009; Falangola et al., 2008; Fieremans et al., 2010; Hui et al., 2008), brain glioma (Raab et al., 2010), attention-deficit hyperactivity disorder (Helpern et al., 2011), and traumatic brain injury (Grossman et al., in press). DKI studies in animal stroke models, however, have not been reported, and the temporal evolution of DKI-derived metrics with respect to DWI and PWI changes in animal models has yet to be systematically investigated. Animal models where focal ischemia can be reproducibly studied under controlled conditions would be important for characterizing DKI contrast, which could ultimately lead to better characterization and staging of human stroke.
The goal of this study was to longitudinally examine the spatiotemporal dynamics of diffusional kurtosis in cerebral ischemia in an animal model of permanent and transient (45 min) middle cerebral artery occlusion (MCAO) during the hyperacute, acute and chronic phases (up to 7 days post-occlusion). Comparisons were longitudinally made with MD, fractional anisotropy (FA), T2W MRI, and perfusion changes in the same animals.
2. Results
2.1. Permanent MCAO
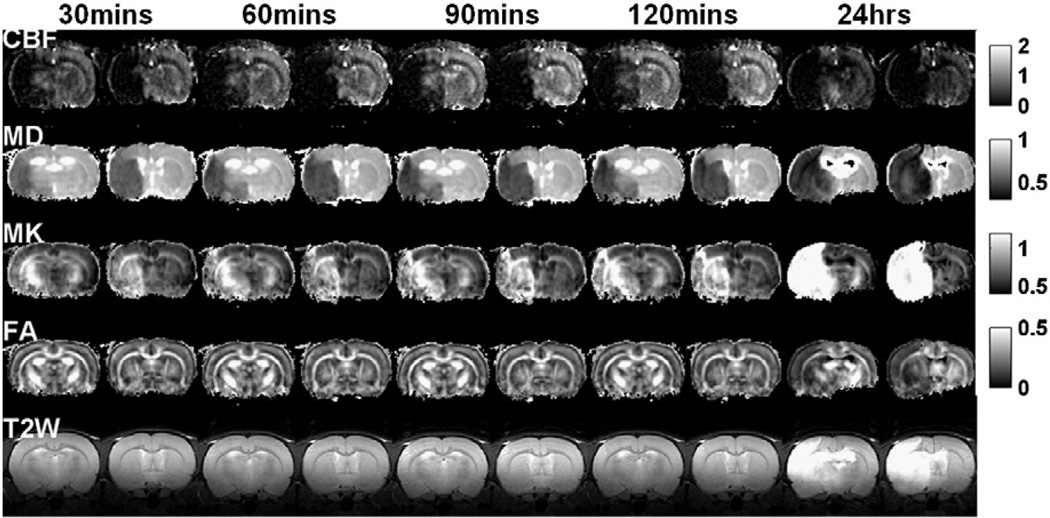
Fig. 1 shows the spatiotemporal dynamics of the absolute CBF, MD, MK, FA maps and T2W images of an animal subjected to permanent MCAO. CBF of the ischemic lesion was markedly reduced and did not change over time. MD reduction and MK increase were apparent in hyperacute (0–2 hrs) and acute (24 hrs post-occlusion) phases. FA and T2W images did not change until 24 hrs post-occlusion.
Fig. 1.
CBF, MD, MK, FA maps and T2W images (two brain slices) of a rat subjected to permanent MCAO obtained at 30, 60, 90, 120 min and 1 day after occlusion. Maps across all time points were displayed with the same scale. Units for CBF and MD are ml/g/min and µm2/ms, respectively. FA and T2W are unitless.
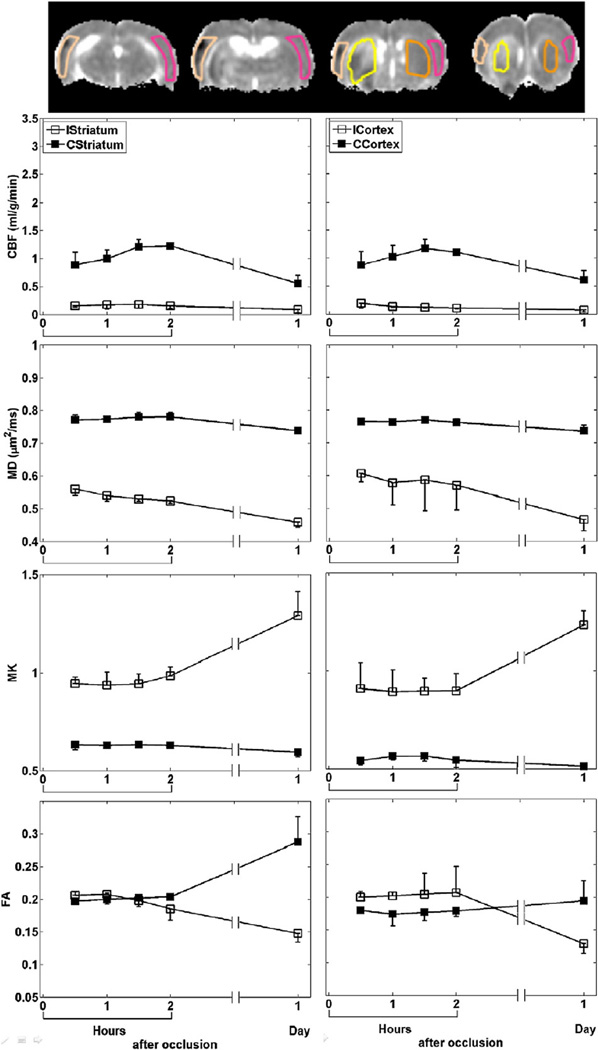
The group-averaged temporal evolution of CBF, MD, MK and FA were analyzed for the cortex and striatum ROIs (Fig. 2). CBF of the ischemic tissue dropped by ~ 79% immediately after MCAO and did not change with time. MD reduced by ~ 24% at 30 min post-occlusion and further decreased with time, while MK elevated by ~ 59% but did not further increase until after 2 hrs post-occlusion. ICortex FA increased by ~ 11% up to 1 hr post-occlusion and gradually decreased with time, whereas IStriatum FA did not decrease until 2 hrs post-occlusion. Notice that the CBF and FA of the contralateral ROIs also changed at 24 hrs post-occlusion.
Fig. 2.
ROI definitions of cortex and striatum on ipsi- (ICortex and IStriatum) and contra-lateral (CCortex and CStriatum) hemispheres overlaid on MD maps (top row). ROI measurements (mean±SD) of CBF, MD, MK and FA of cortex and striatum of all animals with permanent MCAO.
The analysis of CNR showed that MD was more sensitive to ischemic changes than MK and CBF during the hyperacute phase (Fig. 3). FA showed no significant contrast till 24 hrs after MCAO.
Fig. 3.
Group-averaged (mean±SD) CNR of CBF, MD, MK and FA in the cortex and striatum of all animals subjected to permanent MCAO.
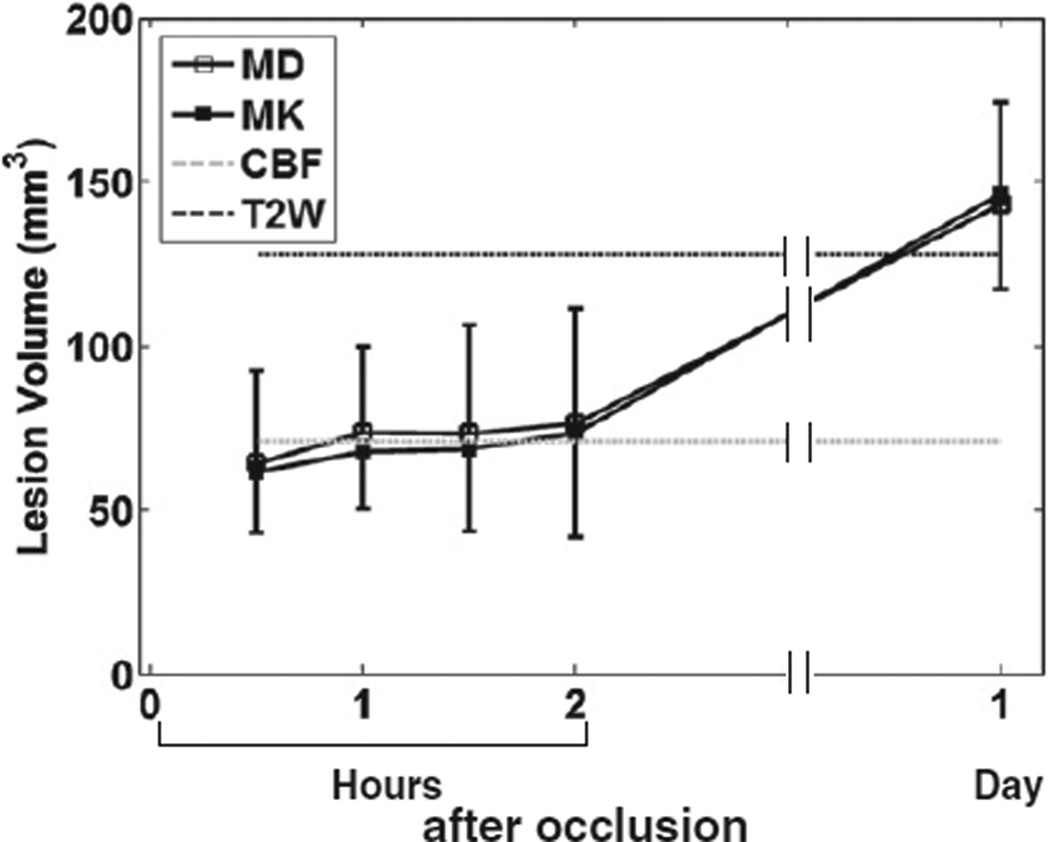
Fig. 4 shows the evolution of LV determined from MD and MK abnormalities that were 3 SDs away from the mean of normal tissue. Note that only LV from CBF immediately and T2W 24 hrs after occlusion are shown and extrapolated to other time points. LV determined from MD and MK increased slightly during the first 2 hrs post-occlusion, and increased further at 24 hrs post-occlusion. LVs of MD and MK were largely similar across all time points, and were comparable to that of T2W at 24 hrs after MCAO.
Fig. 4.
LV estimated from MD and MK of all animals subjected to permanent MCAO versus time after occlusion. Note that only LV from CBF immediately and T2W 24 hrs after occlusion were shown and extrapolated to other time points.
2.2. Transient MCAO
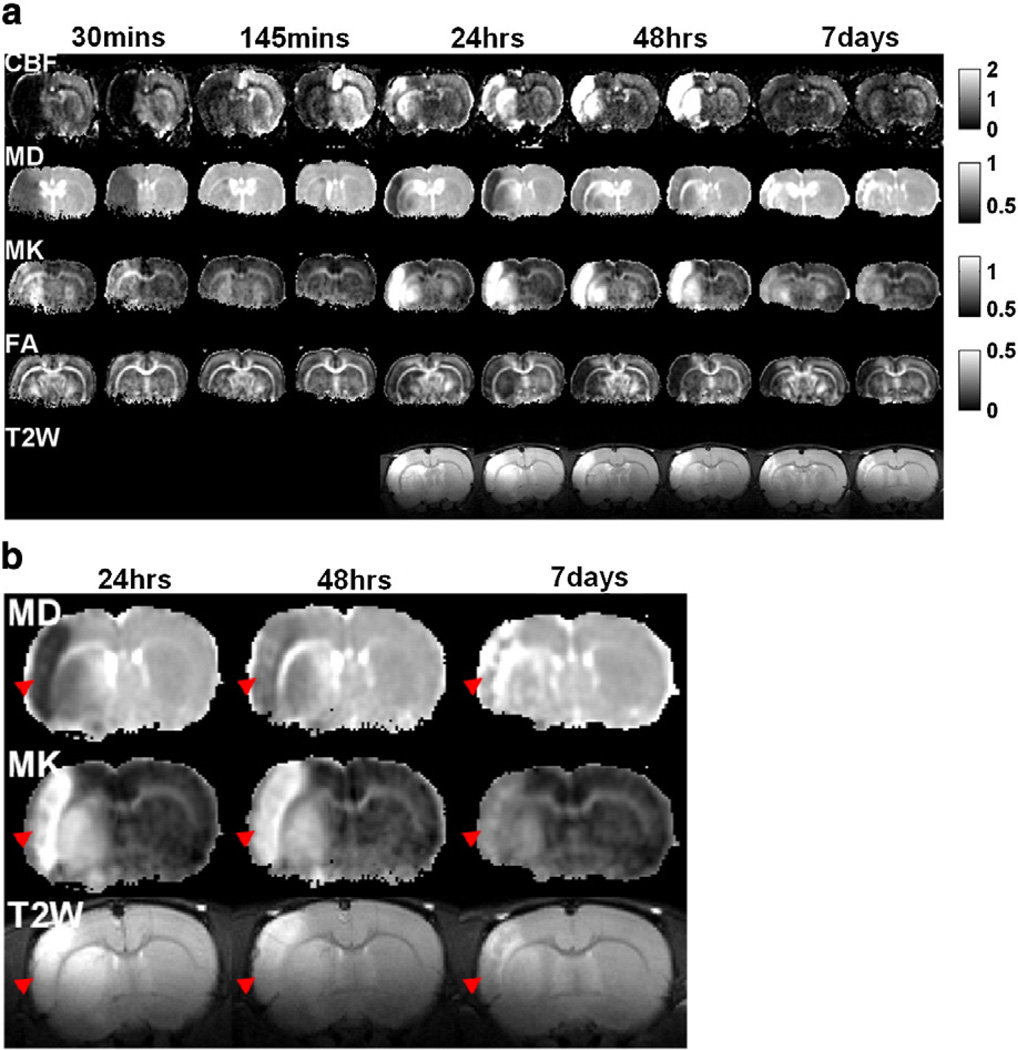
Fig. 5a shows the spatiotemporal dynamics of the absolute CBF, MD, MK, FA maps and T2W images of an animal subjected to transient MCAO. CBF markedly reduced in the ischemic lesion during occlusion and partially restored after reperfusion. Hyperperfusion was detected at 1 and 2 days, and CBF returned to normal value at 7 days after stroke. MD substantially reduced during occlusion and returned toward normal value upon reperfusion. Lesion reappeared at 1 to 2 days post-occlusion. Notice the distinct contrast between ICortex and IStriatum at 24 hrs post-occlusion. At day 7, MD of lesion increased to a level higher than that of normal tissue. MK increased substantially during occlusion and returned toward normal upon reperfusion. Lesion reappeared at 1 to 2 days post-occlusion. At day 7, MK remained elevated but with less contrast. FA change was not apparent until 24 hrs post-occlusion. Notice that T2W images were not acquired in the first two time points due to experimental time constraints. Fig. 5b shows a detailed comparison among MD, MK and T2W for one image slice from Fig. 5a. MK clearly pseudonormalized slower than MD and T2W signals (indicated by red arrow heads).
Fig. 5.
(a) CBF, MD, MK, FA maps and T2W images (two brain slices) of a rat subjected to transient MCAO obtained at 30, 145 min, 24, 48 hrs and 7 days after occlusion. The MCAO duration was 45 min. (b) Enlarged MD, MK maps and T2W images of one slice in (a) at 24, 48 hrs and 7 days after occlusion. Red arrowheads indicate the area of the cortex which showed the much slower pseudonormalization of MK than MD and T2W signal. Maps across all time points were displayed with the same scale. Units for CBF and MD are ml/g/min and µm2/ms.
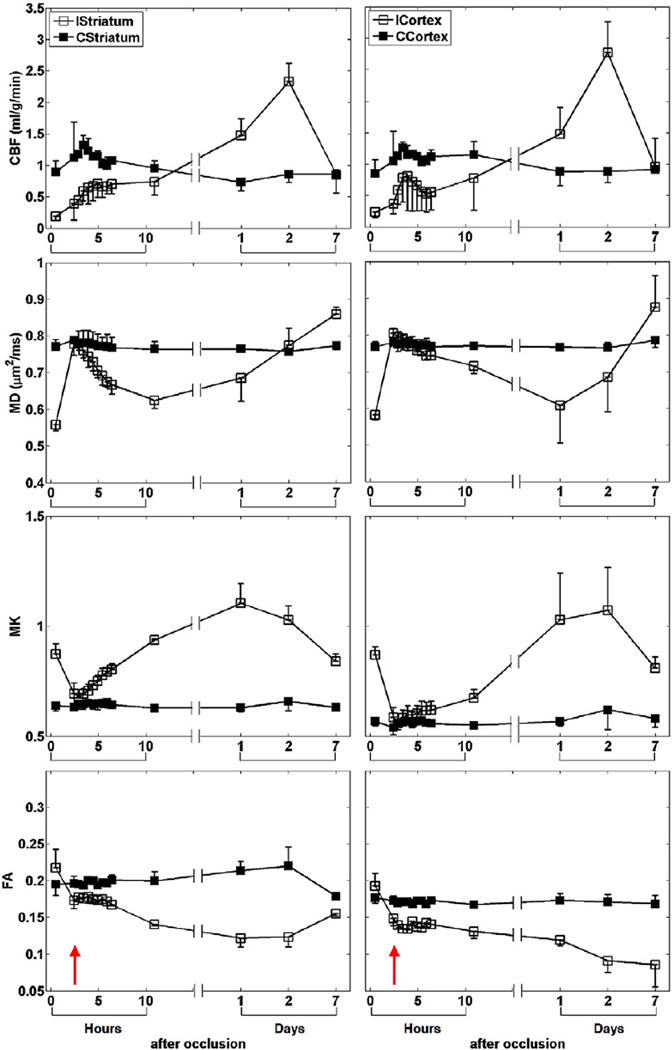
The group-averaged temporal evolution of CBF, MD, MK and FA of the transient MCAO group was analyzed for the cortex and striatum ROIs (Fig. 6). The parameters of the contralateral tissue were largely time invariant in relation to the ischemic tissue changes. In the ischemic ROIs, CBF dropped by ~ 75% immediately after occlusion and gradually increased after reperfusion. CBF exceeded normal values, peaked (~ 194%) and returned to normal values at 1, 2 and 7 days after stroke, respectively. MD decreased by ~ 26% after occlusion, recovered to normal value after reperfusion, and subsequently declined with time. MD of IStriatum and ICortex reached minimum at 11 (~ 18%) and 24 hrs (~ 21%) after stroke, respectively, and gradually pseudonormalized and reached a value higher than normal thereafter. MK increased by ~ 45%after stroke and returned to normal value after reperfusion. MK progressively increased and peaked (~ 75%) at 1 day and (~ 72%) at 2 days after stroke, and decreased but remained higher (~ 36%) than normal thereafter. FA was elevated by ~ 10% immediately after stroke. FA of ICortex gradually decreased but that of IStriatum reached minimum (~ 57%) at 24 hrs post-occlusion and renormalized to ~ 87% of normal value at 7 days.
Fig. 6.
ROI measurements (mean±SD) of CBF, MD, MK and FA of cortex and striatum of all animals subjected to transient MCAO. Red arrow indicates the time after reperfusion.
The CNR characteristics (Fig. 7) were overall similar to those of the permanent MCAO group, where MD was more sensitive to ischemic changes than MK and CBF during the hyperacute phase, and FA showed no significant contrast until 24 hrs after MCAO.
Fig. 7.
Group-averaged (mean±SD) CNR of CBF, MD, MK and FA in the cortex and striatum of all animals subjected to transient MCAO.
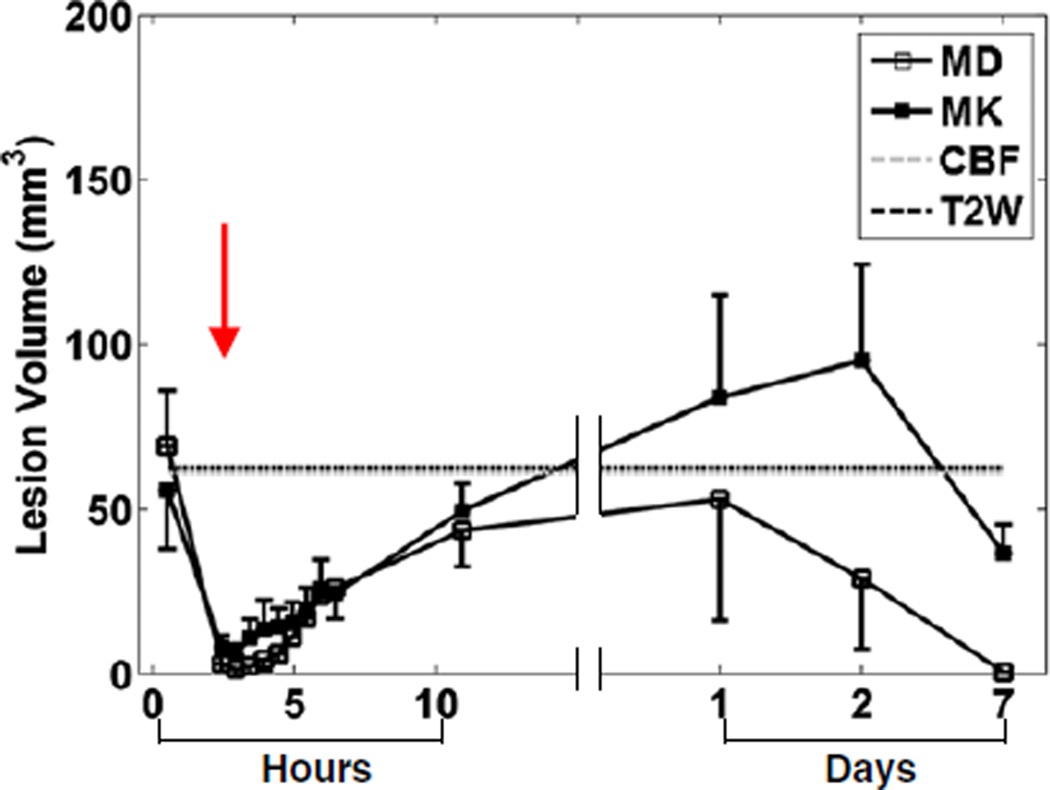
Fig. 8 shows the evolution of LV determined from MD and MK abnormalities that were 3 SDs away from the mean of normal tissue. Note that only LV from CBF immediately and T2W 24 hrs after occlusion are shown and extrapolated to other time points. LV determined from MD immediately after occlusion was ~ 69mm3 and became close to zero immediately after reperfusion. LV gradually increased and reached a peak value of ~ 53mm3 at 24 hr post-occlusion, and gradually decreased thereafter. Evolution of LV determined from MK was similar to that of MD up to 24 hr post-occlusion. LV peaked (~ 95 mm3) at 2 days after occlusion and returned to a value close to immediately after occlusion at 7 days post-occlusion. Notice that LV determined from MD was similar to that of T2W signals at 24 hrs post occlusion, but the LV from MK was apparently larger.
Fig. 8.
LV estimated from MD and MK of all animals subjected to transient MCAO versus time after occlusion. Note that only LV from CBF immediately and T2W 24 hrs after occlusion were shown and extrapolated to other time points.
3. Discussions
This study documented the spatiotemporal dynamics of diffusional kurtosis in a rat stroke model of permanent and transient MCAO. MK offers unique contrasts to probe biophysical changes associated with stroke. MK shows different spatiotemporal dynamics than MD and FA. MK is sensitive to hyperacute and acute stroke changes albeit difference in relative changes and CNR than MD, but higher contrast than FA and T2. MK contrast persists 1 to 7 days post-occlusion, whereas MD shows renormalization at days 1–2 and reversed contrast at day 7.
The biophysical mechanisms of MK contrast are related but not necessarily the same as those of MD. Diffusional kurtosis metrics offer some unique advantages as compared to conventional DTI (Cheung et al., 2009; Falangola et al., 2008; Grossman et al., in press; Helpern et al., 2009; Helpern et al., 2011; Hui et al., 2008; Jensen et al., 2010; Latt et al., 2009b; Peeters et al., 2010; Raab et al., 2010; van Westen et al., 2010). DKI could provide better characterization of normal and pathological tissue at various time points, and is less susceptible to free fluid contamination compared to MD and FA. It is a clinically feasible technique in contrast to q-space (Cohen and Assaf, 2002), Q-ball (Tuch, 2004) and diffusion spectrum imaging (DSI) (Wedeen et al., 2000) which has high demand on scanner hardware and long acquisition time.
3.1. Characterization of ischemic injury using DKI
3.1.1. Permanent MCAO
Diffusional kurtosis of the ischemic lesion was elevated during the hyperacute phase (up to 2 hrs post-occlusion). Increased diffusional kurtosis suggests that water molecules are more restricted within tissue compartments after MCAO, consistent with the hypotheses in the literature (Baird and Warach, 1998; Fung et al., 2011). At 24 hrs post-occlusion (acute phase), the extent of MK increase was larger. Note that the temporal evolutions of MK and MD of the lesion under permanent ischemia are largely similar, albeit difference in percent changes and CNR. Unlike transient ischemia, MD has not yet pseudonormalized at 24 hrs after permanent MCAO. This difference likely occurs because the timeline of pathophysiological events occurring in permanent ischemia are different compared to those of transient ischemia during the chronic (>= 24 hrs post-occlusion) phase (Li et al., 2000; Zhang et al., 1994). One of the hypotheses is that the time of maximal accumulation of neutrophil, indicative of irreversible neuronal damage (Knight et al., 1994), in permanent occlusion is later than that of transient occlusion (72 vs. 6–24 hrs post-occlusion) (Zhang et al., 1994). Therefore, MD pseudonormaliation should likely occur in permanent MCAO at a time later than 24 hrs. It is worth noting that the CBF and FA of the contralateral ROIs also changed at 24 hrs post-occlusion. This suggests that unilateral occlusion did have an effect on the contralateral hemisphere in the permanent MCAO model.
3.1.2. Transient MCAO
Diffusional kurtosis of the ischemic tissue gradually increased during hyperacute phase (post-reperfusion to 6 hrs post-occlusion), suggesting that the diffusion environment in ischemic tissue becomes more restricted again, similar to immediately after occlusion despite restoration of blood flow to the MCA territory. MK and MD had similar and complementary temporal characteristics during this time, albeit difference in percent changes and CNR. The fact that MK and MD showed similar spatiotemporal characteristics during hyperacute phase suggest that there was no significant change in structural heterogeneity as reflected by MK, despite the presence of other biophysical events aforementioned.
MK continued to increase during the acute phase (6–24 hrs post-occlusion). It is worth noting that despite expanded extracellular spaces and presence of excess fluid as a result of vasogenic edema at 24 hrs post-occlusion, MK of ischemic tissue remained higher than normal tissue while MD started pseudonormalizing. It was shown by Hu et al. that MK is a robust and more specific indicator of microstructural alterations than MD because it is much less susceptible to partial volume contamination from gross brain volume change such as vasogenic edema (Hu et al., 2008). They showed that MD of GM decreased by 31.3% upon suppression of cerebral spinal fluid using inversion recovery, while MK increased by only 7.6%. In other words, microstructural information offered by MK is likely less susceptible to free fluid contamination. Therefore, the observed MD pseudonormalization could simply be due to vasogenic edema per se rather than microstructural alterations. On the contrary, despite of the extra fluid present in the ischemic tissue as a result of vasogenic edema, MK remains very sensitive and specific to the underlying microstructural environment. Apart from the distinct lesion contrast of MK at 24 hrs post-occlusion as compared to MD, abnormality exhibited by MK seemed to be also different from that of T2W MRI in terms of LV. This might suggest diffusional kurtosis could perhaps detect specific structural changes during the degeneration process that other techniques cannot. It is important to distinguish the pseudonormalization after reperfusion from that in the chronic phase. One noticeable difference is the time span of these biophysical events, with the former occurring on the order of hours whereas the latter on the order of days.
During the chronic phase (1–7 days post-occlusion), MK remained elevated up to 2 days post-occlusion but started to pseudonormalize at 7 days. Because of the high tolerance of MK to contamination from free fluid, the elevated MK during 1–2 days post-occlusion likely indicates that ischemic cell membranes remain a significant source of diffusion restriction despite the presence of vasogenic edema. MK started to pseudonormalize at 7 days post-occlusion.
3.2. Difference in the dynamics of cortical and subcortical injuries
The temporal dynamics of MD and MK of cortex and striatum subjected to permanent ischemia were largely similar. However, those of IStriatum subjected to transient MCAO displayed distinctly different dynamics during the acute phase than those of ICortex. For instance, the IStriatum MD pseudonormalized earlier than that of ICortex. A number of studies (Garcia et al., 1995; Wang et al., 2001) have shown that blood vessels supplying the cortex were often reperfused earlier than those of striatum, thereby causing significantly less necrotic neurons in cortex than striatum in transient MCAO. Moreover, the arterial collaterals to striatum are less well developed as compared to cortex (Wang et al., 2001), consistent with the observation that IStriatum MD pseudonormalized earlier than that of ICortex.
The notion that cortex and striatum sustained different extent of secondary ischemic or reperfusion injury is corroborated by contrasting the results of permanent MCAO data (Fig. 2) to those of transient MCAO (Fig.6). At 1 day after permanent occlusion, ICortex and IStriatum had similar CBF, MD, MK or FA, suggesting that the difference in dynamics of MD between cortex and striatum after transient occlusion could result from the difference in the extent of reperfusion injury to the two neural tissue types.
3.3. Comparison with DKI findings in human stroke
Our DKI findings are in general agreement with those of human stroke studies (Helpern et al., 2009; Jensen et al., 2010; Latt et al., 2009b; Peeters et al., 2010; van Westen et al., 2010). Ischemic lesions in WM and GM have been shown to have higher diffusional kurtosis than normal tissue at 12 hrs to 5 days after stroke onset (Jensen et al., 2010; Latt et al., 2009b; van Westen et al., 2010). Magnitude of increase in diffusional kurtosis of ischemic lesion gradually decreased from 2 to 90 days after stroke onset, again consistent with our GM lesion results (van Westen et al., 2010). Moreover, it was observed that the percent change in diffusional kurtosis of WM lesion along the predominant diffusion direction (axial kurtosis, K//) was larger than the perpendicular direction (radial kurtosis, K⊥) (Jensen et al., 2010). They attributed axonal varicosities and endoplasmic reticulum alterations to be the potential sources of higher diffusion restriction along the intraaxonal spaces (Jensen et al., 2010). Different biological processes may be attributable to the ischemic injuries in GM and WM (Verkhratsky, 2005). Helpern et al. showed that there were ischemic abnormalities that were apparent on MK but not MD maps (Helpern et al., 2009).
Latt et al. have shown that diffusional kurtosis in lesion decreased, and remained constant for normal tissue when diffusion time was increased (Latt et al., 2009a, 2009b). Diffusional kurtosis of WM and, to a lesser extent, GM lesions decreased with increase in diffusion time at 1–5 days after stroke onset, while MD and normal tissue did not (Latt et al., 2009b). Reduction in kurtosis at longer diffusion time indicates that water molecules can diffuse more freely across membranes of ischemic tissue. One likely mechanism by which this could be possible is increase in membrane permeability (Latt et al., 2009b), consistent with findings in diffusion simulation studies (Fieremans et al., 2010; Latt et al., 2009a). It should be pointed out that the reduction in diffusional kurtosis can also occur as the diffusion time is increased so that it is significantly longer than the water exchange time (the tortuosity limit) (Fieremans et al., 2010). However, the fact that MK of normal tissue did not change with diffusion time suggested that such asymptotic limit was already reached at all the diffusion time used in the study by Latt et al. (Latt et al., 2009b). The observed change in diffusional kurtosis was therefore more likely the result of the difference in membrane permeability between different tissue types.
Finally, DKI contrasts could be modulated by using high angular resolution acquisition (such as the HARDI technique), higher b-value, and variable diffusion times. Improved angular resolution could improve DKI parameters estimation. Higher b-value likely improves sensitivity to slow moving water molecules. Given that ADC decreases in hyperacute phase, higher b-value DKI could improve sensitivity to hyperacute ischemic changes. Longer diffusion times may improve sensitivity to compartment size and DKI contrast and multiple diffusion time data can be used to model membrane permeability. These effects on DKI remain to be investigated. The next major logical steps for translation include: i) applying DKI to evaluate novel therapeutic strategies in animal stroke models, ii) exploring different methods to improve DKI contrasts in animals and humans, and ii) translating to clinical applications in the hyperacute and chronic phase by reducing acquisition time.
In conclusion, the current study documented the spatiotemporal dynamics of diffusional kurtosis in a rat model of permanent and transient MCAO. DKI has the potential to complement existing stroke imaging techniques, particularly in the assessment of subacute to early chronic stroke evolution.
4. Experimental procedures
4.1. Animal preparations
Male Sprague–Dawley rats (250 to 300 g; Charles River Laboratories, Wilmington, MA, USA) were used. All experimental procedures were approved by the Institutional Animal Care and Use Committee, UT Health Science Centre at San Antonio. Animals were initially anesthetized with 5% isoflurane, and mechanically ventilated (Harvard Model 683 Small Animal Ventilator, Holliston, MA, USA). Stroke surgery was performed using the intraluminal MCAO method under 2% isoflurane as described previously (Shen et al., 2003). Isoflurane was reduced to 1.5% during MRI experiments. End-tidal CO2 was continuously monitored using a capnometer (Surgivet, Smith Medical, Waukesha, WI, USA). Rectal temperature was maintained at 37.0 °C±0.5 °C using a circulating warm-water pad throughout the experiments. Heart rate, respiratory rate and blood oxygen saturation level were monitored using MouseOx system (STARR Life Science, Oakmont, PA, USA). All recorded parameters were maintained within normal physiologic ranges.
In Group I (N = 3), animals were subjected to permanent MCAO, and MRI was acquired at 30, 60, 90 and 120 min post-occlusion. Animals were returned to home cages and imaged again at 24 hrs post-occlusion. Data from Group I were used only to compare the difference in acute to subacute ischemic damage as a result of permanent versus transient MCAO. In Group II (N = 6), animals were subjected to transient MCAO. MRI was acquired at 30 min post-occlusion. Animals were slided out on a rail and reperfusion was performed at 45 min (ranges: 42–50 min) post-occlusion by withdrawing the occluder in the internal carotid artery close to the external carotid artery bifurcation. Scout MRI was acquired to confirm repositioning. MRI was acquired again at 145 min post-occlusion. Animals were returned to home cages and imaged again at 1 (N = 6), 2 (N = 3) and 7 days (N = 3) post-occlusion. In two animals, MRI was also acquired from 145 to 380 min post-occlusion every 30 min.
4.2. MRI experiments
MRI was performed using a Bruker 7 T/30 cm BioSpec (Billerica, MA) scanner. The animals were secured in a stereotaxic headset and placed onto an animal holder, consisting of an actively decoupled surface coil (2.3 cm ID) for brain imaging and a butterfly neck coil for continuous arterial spin labeling (cASL) (Meng et al., 2004).
Quantitative cerebral blood flow (CBF) was measured using the cASL technique (Duong et al., 2000) with single-shot gradient-echo echo-planar imaging, acquisition matrix = 96 × 96 (zero-filled to 128 × 128), FOV = 2.56 × 2.56 cm2, TR/TE = 3 s/10 ms, flip angle = 90° and seven 1.5 mm slices. Paired images were acquired alternatively, one with and the other without ASL preparation. Sixty pairs of images were acquired for signal averaging.
DWIs were acquired with single-shot, spin-echo, echo-planar imaging along 30 diffusion encoding directions with b-value = 0, 1.2, 2.5 ms/µm2 with same localization and resolution as cASL. Other imaging parameters were: δ/Δ = 4/16 ms, TR/TE = 3 s/35 ms. Acquisitions were repeated four times for signal averaging. No significant eddy current effects were detected on phantom studies of similar parameters. Residual N/2-ghost and other EPI corrections were applied using standard software in Bruker’s ParaVision 5.0.
T2W images were acquired using fast spin-echo pulse sequence with TR = 2000 ms, effective echo time of 50 ms (inter-echo spacing = 12.5 ms), echo train length = 8, and NEX = 8. Localization and resolution were the same as cASL.
4.3. Data analysis
CBF in units of ml/gramtissue/min were computed as described previously (Duong et al., 2000). The apparent diffusion coefficient (D) and apparent diffusional kurtosis (K) were computed by fitting all DWIs to the DKI model, , where S(b) is the diffusion-weighted (DW) signal intensity as a function of b-value, using weighted linear least square algorithm (Jensen et al., 2005). MD, FA and mean kurtosis (MK) maps were subsequently obtained (Jensen et al., 2005). Directional diffusivities and diffusional kurtoses were not computed because the current study only focused on the effect of ischemia on relatively isotropic gray matter tissue. ROI analysis of the cortex and striatum was performed. Ischemic pixels were included in the ischemic ROIs when the MD, immediately after occlusion, was smaller than 0.68 µm2/ms (value was obtained from 3 standard deviations smaller than the mean of normal cortex and striatum). Contralateral ROIs were drawn on the contralateral hemisphere according to the size and shape of the ischemic ROIs. Similar ROIs were applied to all subsequent time points. Minimal bias in MK measurements should result since the ROI selections were based on MD rather than MK. Since no experiment was performed before MCAO surgery, early contralateral ROI measurements were considered to be similar to those from normal tissue. Entire ROI analysis was repeated twice to ensure reproducibility of the results. Contrast-to-noise ratio (CNR) was also computed for all animals at all time points. CNR was defined as: (μL − μN)/σN, where μL and μN are the mean of the ROI measurement in the lesion and contralateral hemisphere respectively, and σN is the standard deviation (SD) of the ROI measurement in the contralateral hemisphere. Lesion volume (LV) in 2 slices was determined using μN (0.77 µm2/ms)−3 σN (0.027 µm2/ms) for MD, μN (0.59)+3 σN (0.066) for MK, and μN (0.64–1.11 ml/g/min)−3 σN (0.15–0.29 ml/g/min) for CBF, where μN and σN are the mean and SD of the contralateral ROI measurement of each animal immediately after occlusion. A range of μN and σN of CBF were provided because the labeling efficiency of each animal was different. μN±3 σN for MD was not used because CSF would have been considered as lesion. Notice that only 2 slices covering majority of cortex and striatum with minimal WM were used for LV estimation. Other caudal slices were not used because the current LV estimation algorithm would include some normal WM that were apparent on MK but not MD maps. LV from T2W images at 24 hrs post-occlusion was also estimated by manually drawing ROIs around pixels with hyperintense signal intensity. All measurements were reported and plotted as mean±SD of all animals. Statistical analysis was not performed due to limited sample sizes.
Acknowledgments
This work was supported in part by the NIH (R01-NS45879) and the American Heart Association (EIA 0940104N and SDG-0830293N) to TQD.
REFERENCES
- Baird AE, Warach S. Magnetic resonance imaging of acute stroke. J. Cereb. Blood Flow Metab. 1998;18:583–609. doi: 10.1097/00004647-199806000-00001. [DOI] [PubMed] [Google Scholar]
- Cheung MM, Hui ES, Chan KC, Helpern JA, Qi L, Wu EX. Does diffusion kurtosis imaging lead to better neural tissue characterization? A rodent brain maturation study. NeuroImage. 2009;45:386–392. doi: 10.1016/j.neuroimage.2008.12.018. [DOI] [PubMed] [Google Scholar]
- Cohen Y, Assaf Y. High b-value q-space analyzed diffusion-weighted MRS and MRI in neuronal tissues—a technical review. NMR Biomed. 2002;15:516–542. doi: 10.1002/nbm.778. [DOI] [PubMed] [Google Scholar]
- Duong TQ, Silva AC, Lee SP, Kim SG. Functional MRI of calcium-dependent synaptic activity: cross correlation with CBF and BOLD measurements. Magn. Reson. Med. 2000;43:383–392. doi: 10.1002/(sici)1522-2594(200003)43:3<383::aid-mrm10>3.0.co;2-q. [DOI] [PubMed] [Google Scholar]
- Falangola MF, Jensen JH, Babb JS, Hu C, Castellanos FX, Di Martino A, Ferris SH, Helpern JA. Age-related non-Gaussian diffusion patterns in the prefrontal brain. J. Magn. Reson. Imaging. 2008;28:1345–1350. doi: 10.1002/jmri.21604. [DOI] [PMC free article] [PubMed] [Google Scholar]
- Fieremans E, Novikov DS, Jensen JH, Helpern JA. Monte Carlo study of a two-compartment exchange model of diffusion. NMR Biomed. 2010;23:711–724. doi: 10.1002/nbm.1577. [DOI] [PMC free article] [PubMed] [Google Scholar]
- Fung SH, Roccatagliata L, Gonzalez RG, Schaefer PW. MR diffusion imaging in ischemic stroke. Neuroimaging Clin. N. Am. 2011;21:345–377. doi: 10.1016/j.nic.2011.03.001. [DOI] [PubMed] [Google Scholar]
- Garcia JH, Liu KF, Ho KL. Neuronal necrosis after middle cerebral artery occlusion in Wistar rats progresses at different time intervals in the caudoputamen and the cortex. Stroke. 1995;26:636–642. doi: 10.1161/01.str.26.4.636. discussion 643.. [DOI] [PubMed] [Google Scholar]
- Grossman EJ, Ge Y, Jensen JH, Babb JS, Miles L, Reaume J, Silver JM, Grossman RI, Inglese M. Thalamus and cognitive impairment in mild traumatic brain injury: a diffusional Kurtosis imaging study. J. Neurotrauma. doi: 10.1089/neu.2011.1763. in press. [DOI] [PMC free article] [PubMed] [Google Scholar]
- Helpern JA, Lo C, Hu C, Falangola MF, Rapalino O, Jensen JH. Diffusional Kurtosis Imaging in Acute Human Stroke. Proceedings 17th Scientific Meeting, International Society for Magnetic Resonance in Medicine; Proceedings 17th Scientific Meeting, International Society for Magnetic Resonance in Medicine; Honolulu. 2009. p. 3493. ed.^eds. [Google Scholar]
- Helpern JA, Adisetiyo V, Falangola MF, Hu C, Di Martino A, Williams K, Castellanos FX, Jensen JH. Preliminary evidence of altered gray and white matter microstructural development in the frontal lobe of adolescents with attention-deficit hyperactivity disorder: a diffusional kurtosis imaging study. J. Magn. Reson. Imaging. 2011;33:17–23. doi: 10.1002/jmri.22397. [DOI] [PMC free article] [PubMed] [Google Scholar]
- Hu C, Jensen JH, Falangola MF, Helpern JA. CSF partial volume effect for diffusion kurtosis imaging. Proceedings 16th Scientific Meeting, International Society for Magnetic Resonance in Medicine; Proceedings 16th Scientific Meeting, International Society for Magnetic Resonance in Medicine; Toronto. 2008. p. 3325. ed.^eds. [Google Scholar]
- Hui ES, Cheung MM, Qi L, Wu EX. Towards better MR characterization of neural tissues using directional diffusion kurtosis analysis. NeuroImage. 2008;42:122–134. doi: 10.1016/j.neuroimage.2008.04.237. [DOI] [PubMed] [Google Scholar]
- Jensen JH, Helpern JA. MRI quantification of non-Gaussian water diffusion by kurtosis analysis. NMR Biomed. 2010;23:698–710. doi: 10.1002/nbm.1518. [DOI] [PMC free article] [PubMed] [Google Scholar]
- Jensen JH, Helpern JA, Ramani A, Lu H, Kaczynski K. Diffusional kurtosis imaging: the quantification of non-Gaussian water diffusion by means of magnetic resonance imaging. Magn. Reson. Med. 2005;53:1432–1440. doi: 10.1002/mrm.20508. [DOI] [PubMed] [Google Scholar]
- Jensen JH, Falangola MF, Hu C, Tabesh A, Rapalino O, Lo C, Helpern JA. Preliminary observations of increased diffusional kurtosis in human brain following recent cerebral infarction. NMR Biomed. 2010;24:452–457. doi: 10.1002/nbm.1610. [DOI] [PMC free article] [PubMed] [Google Scholar]
- Kidwell CS, Alger JR, Saver JL. Beyond mismatch: evolving paradigms in imaging the ischemic penumbra with multimodal magnetic resonance imaging. Stroke. 2003;34:2729–2735. doi: 10.1161/01.STR.0000097608.38779.CC. [DOI] [PubMed] [Google Scholar]
- Knight RA, Dereski MO, Helpern JA, Ordidge RJ, Chopp M. Magnetic resonance imaging assessment of evolving focal cerebral ischemia. Comparison with histopathology in rats. Stroke. 1994;25:1252–1261. doi: 10.1161/01.str.25.6.1252. discussion 1261–2.. [DOI] [PubMed] [Google Scholar]
- Latt J, Nilsson M, van Westen D, Wirestam R, Stahlberg F, Brockstedt S. Diffusion-weighted MRI measurements on stroke patients reveal water-exchange mechanisms in sub-acute ischaemic lesions. NMR Biomed. 2009a;22:619–628. doi: 10.1002/nbm.1376. [DOI] [PubMed] [Google Scholar]
- Latt J, Van Westen D, Nilsson M, Wirestam R, Stahlberg F, Holtas S, Brockstedt S. Diffusion time dependent kurtosis maps visualize ischemic lesions in stroke patients. Proceedings 17th Scientific Meeting, International Society for Magnetic Resonance in Medicine; Proceedings 17th Scientific Meeting, International Society for Magnetic Resonance in Medicine; Honolulu. 2009b. p. 4417. ed.^eds. [Google Scholar]
- Li F, Silva MD, Sotak CH, Fisher M. Temporal evolution of ischemic injury evaluated with diffusion-, perfusion-, and T2-weighted MRI. Neurology. 2000;54:689–696. doi: 10.1212/wnl.54.3.689. [DOI] [PubMed] [Google Scholar]
- Meng X, Fisher M, Shen Q, Sotak CH, Duong TQ. Characterizing the diffusion/perfusion mismatch in experimental focal cerebral ischemia. Ann. Neurol. 2004;55:207–212. doi: 10.1002/ana.10803. [DOI] [PMC free article] [PubMed] [Google Scholar]
- Peeters F, Rommel D, Peeters A, Grandi C, Cosnard G, Duprez T. MRI of Acute (<6 Hours) Ischemic Stroke Patients: A Comparison Between Diffusion-Related Parameters. Proceedings 18th Scientific Meeting, International Society for Magnetic Resonance in Medicine; Proceedings 18th Scientific Meeting, International Society for Magnetic Resonance in Medicine; Stockholm. 2010. p. 3979. ed.^eds. [Google Scholar]
- Raab P, Hattingen E, Franz K, Zanella FE, Lanfermann H. Cerebral gliomas: diffusional kurtosis imaging analysis of microstructural differences. Radiology. 2010;254:876–881. doi: 10.1148/radiol.09090819. [DOI] [PubMed] [Google Scholar]
- Schlaug G, Benfield A, Baird AE, Siewert B, Lovblad KO, Parker RA, Edelman RR, Warach S. The ischemic penumbra: operationally defined by diffusion and perfusion MRI. Neurology. 1999;53:1528–1537. doi: 10.1212/wnl.53.7.1528. [DOI] [PubMed] [Google Scholar]
- Shen Q, Meng X, Fisher M, Sotak CH, Duong TQ. Pixel-by-pixel spatiotemporal progression of focal ischemia derived using quantitative perfusion and diffusion imaging. J. Cereb. Blood Flow Metab. 2003;23:1479–1488. doi: 10.1097/01.WCB.0000100064.36077.03. [DOI] [PMC free article] [PubMed] [Google Scholar]
- Tuch DS. Q-ball imaging. Magn. Reson. Med. 2004;52:1358–1372. doi: 10.1002/mrm.20279. [DOI] [PubMed] [Google Scholar]
- van Westen D, Nilsson M, Sjunnesson H, Stahleberg F, Brockstedt S, Wirestam R, Latt J. Apparent Kurtosis and Fractional Anisotropy Potentially Predicts Tissue Outcome in Sub-Acute Stroke. Proceedings 18th Scientific Meeting, International Society for Magnetic Resonance in Medicine; Proceedings 18th Scientific Meeting, International Society for Magnetic Resonance in Medicine; Stockholm. 2010. p. 2219. ed.^eds. [Google Scholar]
- Verkhratsky A. Physiology and pathophysiology of the calcium store in the endoplasmic reticulum of neurons. Physiol. Rev. 2005;85:201–279. doi: 10.1152/physrev.00004.2004. [DOI] [PubMed] [Google Scholar]
- Wang CX, Todd KG, Yang Y, Gordon T, Shuaib A. Patency of cerebral microvessels after focal embolic stroke in the rat. J. Cereb. Blood Flow Metab. 2001;21:413–421. doi: 10.1097/00004647-200104000-00010. [DOI] [PubMed] [Google Scholar]
- Wedeen VJ, Reese TG, Tuch DS, Weigel MR, Dou JG, Weiskoff RM, Chessler D. Mapping fiber orientation spectra in cerebral white matter with Fourier-transform diffusion MRI. Proceedings 8th Scientific Meeting, International Society for Magnetic Resonance in Medicine; Proceedings 8th Scientific Meeting, International Society for Magnetic Resonance in Medicine; California. 2000. p. 82. ed.^eds. [Google Scholar]
- Zhang RL, Chopp M, Chen H, Garcia JH. Temporal profile of ischemic tissue damage, neutrophil response, and vascular plugging following permanent and transient (2H) middle cerebral artery occlusion in the rat. J. Neurol. Sci. 1994;125:3–10. doi: 10.1016/0022-510x(94)90234-8. [DOI] [PubMed] [Google Scholar]


