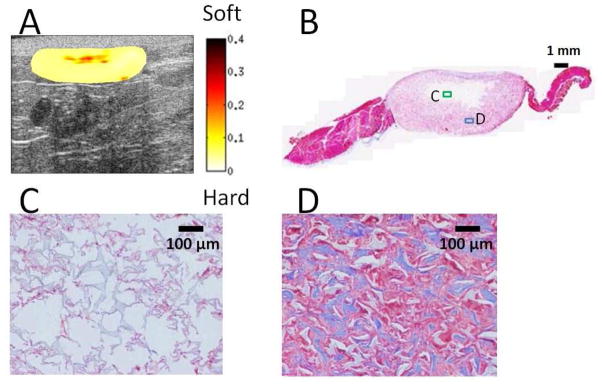
Fig. 6.

Local distribution of scaffold degradation and cell in-growth. (A) Normalized strain map for PEUU sample at week 4. The dimension of the B-mode image is 14 mm (width) by 6.4 mm (depth). For better contrast in color, the dynamic range of the color map was adjusted from 0 to 0.4. (B) Masson’s trichrome staining of the PEUU sample in Fig. 6A at week 4. Within the scaffold, the region near the center stains white which indicates insignificant cellular in-growth compared to the outer regions which stain red/purple. Scale bar = 1 mm. (C) Magnified image of the representative area (green frame) in the central white region in Fig. 6B. The light blue structure (polymer) is slightly infiltrated with cellular and extracellular material. Scale bar = 100 μm. (D) Magnified image of the representative area (blue frame) in the surrounding pink region of the scaffold. Significant collagen (blue) along with a large number of cells (red) are observed. Scale bar = 100 μm.
