

Abstract
A series of chiral pyridazin-3(2H)-ones was synthesized, separated as pure enantiomers, and evaluated for N-formyl peptide receptor (FPR) agonist activity. Characterization of the purified enantiomers using combined chiral HPLC and chiroptical studies (circular dichroism, allowed unambiguous assignment of the absolute configuration for each pair of enantiomers). Evaluation of the ability of racemic mixtures and purified enantiomers to stimulate intracellular Ca2+ flux in FPR-transfected HL-60 cells and human neutrophils and to induce β-arrestin recruitment in FPR-transfected CHO-K1 cells showed that many enantiomers were potent agonists, inducing responses in the sub-micromolar to nanomolar range. Furthermore, FPRs exhibited enantiomer selectivity, generally preferring the R-(−)-forms over the S-(+)-enantiomers. Finally, we found that elongation of the carbon chain in the chiral center of the active compounds generally increased biological activity. Thus, these studies provide important new information regarding molecular features involved in FPR ligand preference and report the identification of a novel series of FPR agonists.
Keywords: Formyl peptide receptors, Inflammation, Neutrophils, Enantiomers, Pyridazin-3(2H)-ones, Chiral agonists
1. Introduction
Inflammation represents a primary response of the immune system to infection, irritation, and trauma, and is mediated through the action of many cell types with distinct but overlapping roles.1 However, if an injurious agent persists or disrupts leukocyte recruitment, both acute and chronic inflammatory disorders may ensue.2 Indeed, dysregulated inflammatory processes play an important role in many diseases, such as asthma,3 rheumatoid arthritis, multiple sclerosis, periodontal disease, cancer, cardiovascular and Alzheimer’s diseases.4 Thus, the host inflammatory response requires stringent regulation to avoid self-induced damage,5 and anti-inflammatory drugs are used to treat such inflammatory syndromes.
The majority of current anti-inflammatory drugs have limitations due to their interference with pro-inflammatory mediators and potential to interfere with recently described biochemical processes required for resolving inflammation.6 Thus, the development of bioactive molecules that selectively stimulate innate immune responses without causing excessive inflammation has been a significant challenge.7 In this context, the human N-formyl peptide receptor (FPR) family has emerged as mediator of key events in inflammation and endogenous anti-inflammation and represents an attractive target for the discovery of new therapeutics. 8 FPRs are seven transmembrane domain G protein-coupled receptors (GPCR), and the three subtypes identified in humans (FPR1, FPR2/ALX, and FPR3) exhibit a high level of amino acidic homology.9 FPR1 is relatively abundant on phagocytic cells, and it was first defined biochemically as a high-affinity binding site on the surface of neutrophils for the prototypic peptide N-formyl-methionine-leucine-phenylalanine (fMLF).10 FPR2/ALX shares 69% amino acidic identity with human FPR1 but, despite the relatively high level of sequence homology, is a low-affinity receptor for fMLF.11 FPR2/ALX has a tissue distribution similar to that of FPR1, but it is also expressed in other cell types, including, hepatocytes, epithelial cells, T lymphocytes, neuroblastoma cells, astrocytoma cells, and microvascular endothelial cells.10 This pattern of tissue expression suggests that FPR2/ALX may participate in a number of functions in addition to host defense. FPR3 shares 56% and 83% sequence identity with human FPR1 and FPR2/ALX, respectively. It does not bind N-formyl peptides, such as fMLF, but it responds to some non-formylated chemotactic peptides identified for FPR2/ALX. Unlike FPR1 and FPR2/ALX, FPR3 is not expressed in neutrophils but is specifically expressed on monocytes and dendritic cells.12
FPRs interact with a range of structurally different pro- and anti-inflammatory ligands associated with different diseases, including amyloidosis and Alzheimer’s disease,13 some kinds of cancers and related alopecia induced by most anticancer agents,14,15 prion disease,16 HIV,17 stomach ulcer,18 and nociception associated with inflammatory processes.19 In addition to endogenous agonists and natural peptides like the bacterial fMLF, synthetic peptides and small non-peptide FPR ligands have recently been reported.10,20 Additionally, interactions of FPRs with some ligands have been found to be stereoselective. For example, lipoxin A4 (LXA4; Fig. 1), the first identified endogenous ligand for FPR2/ALX (EC50 = 1.0 nM),21 displays stereoselective and highly potent anti-inflammatory and pro-resolving activity in vivo in many mammalian systems,3 and changes in potency were associated with double bond isomerization and alcohol chirality (R or S).22–24 More recently, researchers from Amgen developed a series of N-substituted benzimidazoles as potent FPR2 ligands,25 also displaying stereospecific receptor binding. Among these ligands, difference in activity between two enantiomers, designated as compounds A and B (Fig. 1), was noted, being the R-isomer (A) significantly more potent than the S-enantiomer (B).
Figure 1.

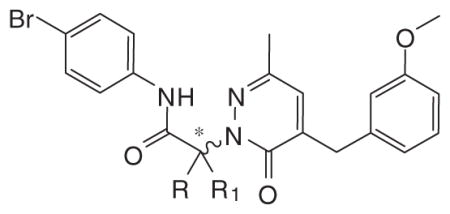
Structures of selected chiral FPR ligands and the newly designed series.
Previously, we identified a large number of potent mixed FPR1/FPR2 agonists belonging to a series of pyridazin-3(2H)-one derivatives bearing a methyl group at position 6, a methoxybenzyl at position 4, and an acetamidic side chain at position 2.26 One of the most interesting compound in this series was compound (±)-5a26 ( Fig. 1), which is a FPR1-specific agonist (EC50 = 3.2 μM) that contains a chiral center at the level of the side chain in position 2. Considering the potential importance of stereoselectivity in FPR-ligand interactions, we evaluated this issue using pure enantiomers of racemate (±)-5a (Fig. 1) and a newly synthesized series of chiral and branched pyridazin-3(2H)-one derivatives (general structure 5, Fig. 1). These studies led to the identification of novel mixed FPR1/FPR2 agonists with potent activity for human neutrophils. We also found that FPRs exhibited a preference for the R-(−)-enantiomers of these compounds and that elongation of the carbon chain in their chiral center generally increased biological activity. Thus, in addition to the identification of novel FPR agonists, these studies provide important new information about molecular features involved in FPR ligand preference.
2. Chemistry
Initially, we attempted to obtain pure enantiomers (+)-5a and (−)-5a of the previously described racemic (±)-5a26 by asymmetric synthesis (Scheme 1). Commercially available bromopropionic acids R-(+)-1a and S-(−)-1a were first treated with SOCl2, resulting in the intermediate acid chlorides, which in turn were transformed into amides R-(+)-3a and S-(−)-3a27 using 4-bromoaniline 2 (Scheme 1). Amide bond formation occurred by retention of the relative configuration of the starting carboxylic acids, which was due to lack of participation of the chiral center in the reaction and the non-basic reaction conditions. The amides R-(+)-3a and S -(−)-3a were then used to alkylate the intermediate 426 (Scheme 1). Previous studies have described alkylation of N-2 on the pyridazinone ring as a classical SN2 reaction,28,29 so this methodology could be theoretically applied to the synthesis of both enantiomers (+)-5a and (−)-5a, with complete inversion of the configuration of starting amides. Nevertheless, inversion of the configuration was not complete, and racemization occurred. Thus, we synthesized the other planned compounds as racemates using the same synthetic procedure reported in Scheme 1 and separated them, together with the already reported racemate (±)-5a,26 through semi-preparative chiral HPLC. The synthesis was performed using the commercially available 4-bromophenyl amides (±)-3b,d, the already described (±)-3f–h,30–32 and the new (±)-3c,e as intermediates. Synthesis of (±)-3g required preparation of the starting bromo-derivative (±)-1g,33 obtained as reported previously by treating 2-methylbutanoic acid with N-bromosuccinimide in CCl4 at reflux.
Scheme 1.
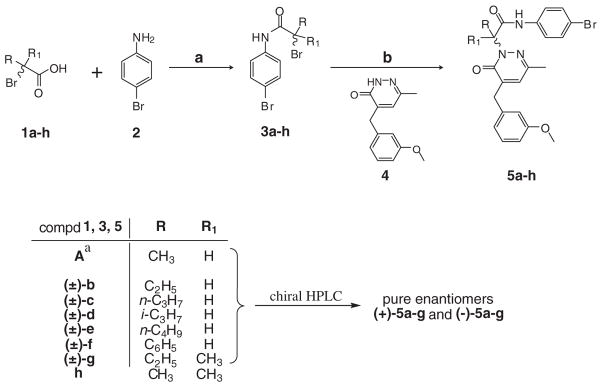
Synthesis of chiral pyridazin-3(2H)-one derivatives (±)-5a–g and non-chiral analog 5h.
a A: 1 and 3a = pure enantiomers; 5a = racemate.
2.1. Chiral chromatographic resolution of racemates (±)-5a–g and absolute configuration assignment
Compounds (±)-5a–g (Scheme 1) were separated as pure enantiomers [enantiomeric excess (ee) = 94.8–99.9%] by semi-preparative chiral HPLC using two distinct polysaccharide-based chiral stationary phases (CSPs) (Table 1). A Chiralcel OD® column [cellulose tris(3,5-dimethylphenylcarbamate)] was used to separate the racemates (±)-5a,b, according to a procedure reported in literature for analogue compounds.34 Since the increasing sterical hindrance of the chiral center led to a progressive lack of effectiveness of the CSP ( Fig. 2), the racemates (±)-5c–g were separated using a Lux Amylose-2® column [amylose tris(5-chloro-2-methylphenyl- carbamate)] ( Fig. 3). The polarimetric analysis was performed to establish the specific rotations ( ) of enantiomers (Table 2), and the enantiomeric excess was determined and reported in Figure 4.
Table 1.
Conditions for chiral HPLC separations of the racemates (±)-5a–g
| Enantiomer | Stationary phasea | Eluent (n-hexane/IPA) | Flow rate (mL/min) | Temperature (°C) | Retention time (tR, min)b |
|---|---|---|---|---|---|
| S-(+)-5a | Chiralcel OD | 95:5 | 1.2 | 25 | 19.2 |
| R-(−)-5a | 23.2 | ||||
| S-(+)-5b | Chiralcel OD | 95:5 | 1.2 | 25 | 15.9 |
| R-(−)-5b | 17.9 | ||||
| S-(+)-5c | Amylose-2 | 60:40 | 1.5 | 40 | 5.1 |
| R-(−)-5c | 9.4 | ||||
| S-(+)-5d | Amylose-2 | 60:40 | 1.5 | 40 | 3.9 |
| R-(−)-5d | 10.1 | ||||
| S-(+)-5e | Amylose-2 | 60:40 | 1.5 | 40 | 5.4 |
| R-(−)-5e | 9.7 | ||||
| S-(+)-5f | Amylose-2 | 60:40 | 1.5 | 40 | 12.3 |
| R-(−)-5f | 7.6 | ||||
| S-(+)-5g | Amylose-2 | 60:40 | 1.5 | 40 | 8.6 |
| R-(−)-5g | 6.7 |
Column dimensions were all 250 mm × 4.6 mm I.D.
Elution was monitored by UV absorbance at 250 nm.
Figure 2.
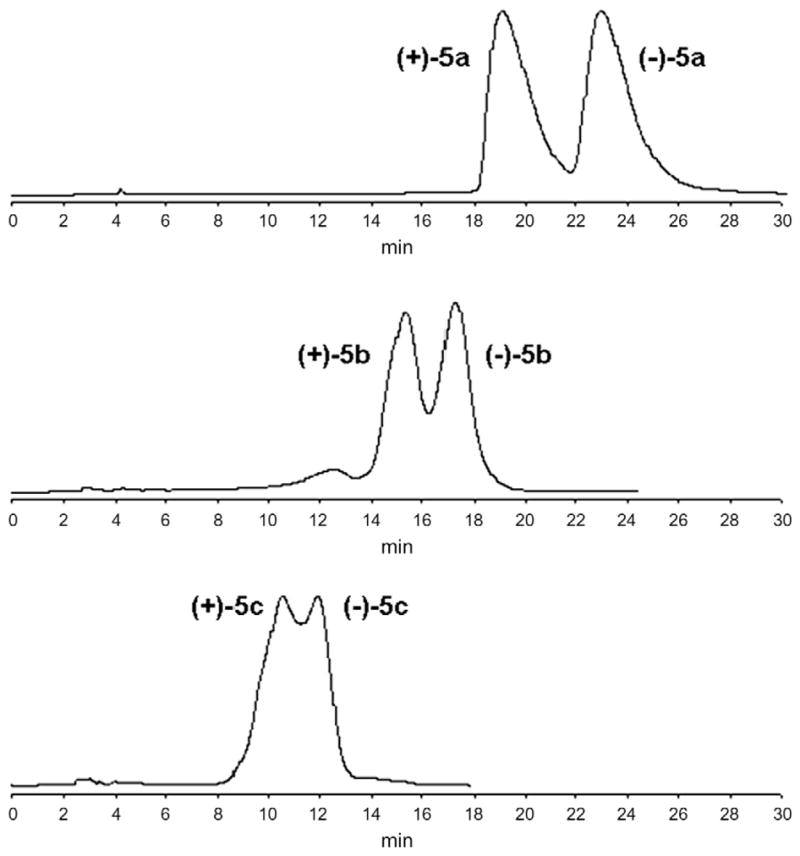
Chiral semi-preparative HPLC resolution of racemates (±)-5a–c. Conditions were as follows: Chiralcel OD column (10 μm, 4.6 mm I.D. × 250 mm), n-hexane/IPA 95:5 (v/v) as eluent, flow rate 1.2 mL/min, detection by UV at 250 nm, temperature 25 °C. At the bottom it is shown the lack of selectivity when using Chiralcel OD column under the same conditions to separate racemate (±)-5c.
Figure 3.

Chiral semi-preparative HPLC resolution of racemates (±)-5c–g. Conditions were as follows: Lux Amylose-2 column (5 μm, 4.6 mm I.D. × 250 mm), n-hexane/IPA 60:40 (v/v) as eluent, flow rate 1.5 mL/min, detection by UV at 250 nm, temperature 40 °C.
Table 2.
Specific rotation and enantiomeric excess determined for purified enantiomers
| Enantiomer | (CHCl3, c = 1) | Enantiomeric excess (%) |
|---|---|---|
| S-(+)-5a | +80° | >99.9 |
| R-(−)-5a | −78° | 94.8 |
| S-(+)-5b | +129° | >99.9 |
| R-(−)-5b | −129° | 96.0 |
| S-(+)-5c | +139° | >99.9 |
| R-(−)-5c | −137° | >99.9 |
| S-(+)-5d | +99° | >99.9 |
| R-(−)-5d | −97° | >99.9 |
| S-(+)-5e | +111° | >99.9 |
| R-(−)-5e | −110° | >99.9 |
| S-(+)-5f | +16° | >99.9 |
| R-(−)-5f | −17° | >99.9 |
| S-(+)-5g | +17° | 98.6 |
| R-(−)-5g | −18° | >99.9 |
Figure 4.

Chiral analytical HPLC analysis of the chromatographically resolved enantiomers (+)-5a–g/(−)-5a–g. Conditions were as follows: Lux Amylose-2 column (3 μm, 4.6 mm I.D. × 50 mm), n-hexane/IPA 60:40 (v/v) as eluent, flow rate 1.0 mL/min, detection by UV at 250 nm, temperature 40 °C, injection volume of 10 μL. For analytical enantioseparations, a standard solution was prepared by dissolving 0.1 mg of each enantiomer into 1 mL of ethanol. The enantiomer excess values (Table 2) were calculated from relative peak areas. Arrows indicate the percentage of the enantiomeric impurities for (−)-5a, (+)-5b, and (+)-5g, whereas all the other enantiomers were obtained with a purity >99.9%.
Chiral HPLC and polarimetric analysis indicated that for racemates (±)-5a–e, the first eluted enantiomers using both columns rotated polarized light in the positive direction, accordingly to the similar nature of substituents on the stereogenic center (R = alkyl, R1 = H, Scheme 1). Conversely, the elution sequence was reversed in the case of racemates (±)-5f,g, where the enantiomers (−)-5f,g eluted faster than the corresponding (+)-forms. Clearly, enantiomer elution order is an important aspect in the study of enantiorecognition mechanisms.35 In our case, structural differences on the chiral center between analytes, such as the greater hindrance of the phenyl group in (±)-5f and the absence of H on the chiral center in (±)-5g, were the key determinants in this inversion of chromatographic elution.
Since all attempts to obtain crystals suitable for X-ray analysis to assign the absolute configurations of the pure enantiomers of (±)-5a–g failed, we utilized an approach extensively reported in the literature, which is based on comparison of the circular dichroism (CD) spectra of the unknown enantiomers with the CD profile of reference compounds whose absolute configuration has already been established.36,37 Commercially available N-acetyl-S-(−)-alanine [S-(−)-6], R-(−)-2-phenylglycine [R-(−)-7], and S-(−)-α-methylvaline [S-(−)-9] were chosen as reference molecules, considering that the substituents at their stereogenic centers are similar to those of our compounds (highlighted in red in Figure 5). In fact, N-acetyl-S-(−)-alanine [S-(−)-6], showing a similar sequence of groups/atoms, can be used as reference for (+)-5a/(−)-5a in CD analysis, and the results can be extended to the enantiomeric pairs (+)-5b–e/(−)-5b–e. Analogously, we considered R-(−)-838 and S- (−)-10, which are the acetyl derivatives of R-(−)-2-phenylglycine [R-(−)-7] and S-(−)-α-methylvaline [S-(−)-9] (Fig. 5) respectively, as reference compounds for (+)-5f/(−)-5f and (+)-5g/(−)-5g. The acetylation reaction, performed in H2O using acetic anhydride at 70 °C, occurred by complete retention of the absolute configuration as reported in literature39 and confirmed by both polarimatric ( ) and X-ray analysis of R-(−)-838 and S-(−)-10 (Fig. 6). Crystals of R-(−)-838 and S-(−)-10 suitable for X-ray experiments were grown by crystallization from acetonitrile solution, and their spatial coordinates are provided as Supplementary data.
Figure 5.

N-Acetyl-S-(−)-alanine [S-(−)-6] and acetyl derivatives of R-(−)-2-phenylglycine [R-(−)-7] and S-(−)-α-methylvaline [S-(−)-9] used as reference compounds in CD experiments in comparison to enantiomeric pairs (+)-5a/(−)-5a, (+)-5f/(−)-5f, (+)-5g/(−)-5g due to their comparable substituents (groups/atoms) on the stereogenic center (highlighted in red). Reagents and conditions: (a) acetic anhydride (7.5 equiv), H2O, 0.5 h, 70 °C.
Figure 6.
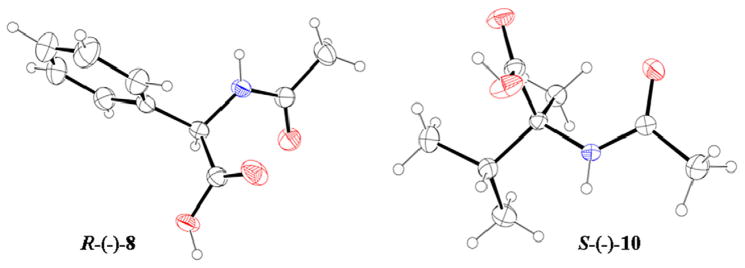
ORTEP view of R-(−)-8 and S-(−)-10 used as reference compounds in CD experiments.
Compounds (+)-5a and (−)-5a were analyzed in comparison with N-acetyl-S-(−)-alanine [S-(−)-6] (Fig. 7). The CD spectrum of the (+)-5a enantiomer displayed a broad positive Cotton effect around 300 nm and, oppositely, the (−)-5a enantiomer exhibited the corresponding mirror-image CD. With the positive Cotton effect of the N-acetyl-S-(−)-alanine in the wavelength range between 215 and 250 nm, we can reasonably assign the (S)-absolute configuration to (+)-5a and the (R)-absolute configuration to (−)- 5a. The differences in curve profile (Fig. 7) may depend on the different types of chromophores between (+)-5a/(−)-5a and S-(−)-6, which does not contain any aromatic systems. Moreover, due to the similarity on the chiral centers, the result obtained for S-(+)- 5a/R-(−)-5a may efficiently be transferred to enantiomeric pairs (+)-5b–e/(−)-5b–e (Fig. 5), allowing us to conclude that enantiomers of the same sign of optical rotation have the same absolute configuration.
Figure 7.
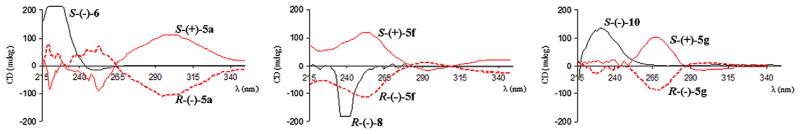
Circular dichroism (CD) spectra of the pure enantiomeric pairs (+)-5a/(−)-5a, (+)-5f/(−)-5f, (+)-5g/(−)-5g and reference compounds S-(−)-6, R-(−)-8 and S-(−)-10 (recorded in methanol at 25 °C). In each spectra, the black trace represents the reference compound, whereas solid and dashed red traces correspond to the analyzed (S)- and (R)-enantiomers, respectively.
Likewise, we compared CD spectra of reference compounds R- (−)-838 and S-(−)-10 with the enantiomeric pairs (−)-5f/(+)-5f and (−)-5g/(+)-5g, respectively, and assigned to enantiomers (−)- 5f/(−)-5g the (R)-absolute configuration, while to (+)-5f/(+)-5g was assigned the (S)-form (Fig. 7). In both cases, the bathochromic shift of the CD curves of (−)-5f/(+)-5f and (−)-5g/(+)-5g in comparison with the profiles of R-(−)-8 and S-(−)(−)-10, seemed to depend on the different chromophores of the molecules.
On the basis of combined chromatographic and chiroptical studies, the absolute configuration assignment was unambiguously completed, and configurations were assigned to the seven enantiomeric pairs synthesized: S-(+)-5a–g/R-(−)-5a–g. Due to the comparable chiral centers in this group of molecules, the results clearly assigned the (S)-absolute configuration to all dextrorotatory enantiomers of the series and the (R)-absolute configuration to the corresponding levorotatory isomers.
3. Biological results and discussion
3.1. Structure–activity relationship analysis
All newly synthesized compounds were tested as racemates and pure enantiomers for their ability to induce intracellular Ca2+ flux in HL-60 cells transfected with FPR1 or FPR2, and the responses were compared with the activity of fMLF and WKYMVm (Table 3). To confirm the selectivity for FPRs, all final compounds were also tested in wild-type non-transfected HL-60 cells and were found to be inactive (data not shown).
Table 3.
Biological activity of racemates (±)-5a–g, enantiomers S-(+)-5a–g/R-(−)-5a–g, and non-chiral analogue 5h
| |||||||
|---|---|---|---|---|---|---|---|
| Compound | R | R1 | Ca2+ mobilization
|
β-Arrestin recruitment
|
|||
| hPMN | FPR1 | FPR2 | FPR1 | FPR2 | |||
|
| |||||||
| EC50 (μM) and efficacya (%) | |||||||
| (±)-5a26 | H | CH3 | 0.8 (95) | 3.2 (90) | NA | ||
| S-(+)-5a | 4.9 (65) | 3.2 (70) | 16.1 (60) | 12.6 (25) | NA | ||
| R-(−)-5a | 1.4 (110) | 8.5 (95) | 10.2 (80) | 11.4 (85) | 21.2 (20) | ||
| (±)-5b | H | C2H5 | 1.8 (145) | 1.3 (95) | 2.2 (95) | ||
| S-(+)-5b | 2.8 (120) | 13.4 (115) | 22.2 (100) | 13.8 (80) | NA | ||
| R-(−)-5b | 0.57 (125) | 2.8 (120) | 2.3 (150) | 3.1 (90) | 8.3 ± (70) | ||
| (±)-5c | H | n-C3H7 | 0.3 (120) | 2.8 (75) | 3.6 (85) | ||
| S-(+)-5c | NA | NA | NA | NA | NA | ||
| R-(−)-5c | 0.93 (145) | 3.0 (85) | 0.84 (120) | 3.8 (120) | 6.8 (100) | ||
| (±)-5d | H | i-C3H7 | 3.0 (90) | 2.0 (75) | 6.5 (40) | ||
| S-(+)-5d | NA | NA | NA | NA | NA | ||
| R-(−)-5d | 2.3 (105) | 9.4 (75) | 5.4 (105) | 12.4 (65) | NA | ||
| (±)-5e | H | n-C4H9 | 0.06 (120) | 1.1 (110) | 0.1 (105) | ||
| S-(+)-5e | 4.7 (45) | 20.8 (35) | 7.0 (65) | 15.1 (25) | 6.1 (60) | ||
| R-(−)-5e | 0.073 (135) | 0.5 (110) | 0.089 (120) | 3.5 (155) | 3.4 (40) | ||
| (±)-5f | H | C6H5 | 4.3 (140) | 3.1 (80) | 1.8 (90) | ||
| S-(+)-5f | NA | NA | NA | NA | NA | ||
| R-(−)-5f | 0.062 (190) | 0.94 (110) | 0.54 (140) | 4.0 (95) | 2.3 (60) | ||
| (±)-5g | CH3 | C2H5 | 0.5 (100) | 1.5 (70) | 2.1 (80) | ||
| S-(+)-5g | 1.4 (85) | 7.0 (65) | NA | 11.7 (65) | NA | ||
| R-(−)-5g | 1.2 (90) | 4.5 (70) | 13.7 (110) | 11.3 (70) | 11.2 (60) | ||
| 5h | CH3 | CH3 | 4.7 (70) | 6.3 (50) | 20.4 (60) | 20.1 (20) | NA |
| fMLF | 0.005 | 0.01 | 20.4 | 0.007 | 12.5 | ||
| WKYMVm | 0.001 | 0.50 | 0.001 | 0.015 | 0.009 | ||
NA, no activity (no response was observed during the first 2 min after addition of compounds under investigation) considering the limits of efficacy >20% and EC50 <50 μM. EC50 values are presented as the average of four independent experiments, in which median effective concentration values (EC50) were determined by nonlinear regression analysis of the dose–response curves (5–6 points) generated using GraphPad Prism 5 with a 95% confidential interval (p <0.05). For Ca2+ flux assays, efficacy (in parentheses) is expressed as % of the response induced by 5 nM fMLF (FPR1) or 5 nM WKYMVm (FPR2). For β-arrestin recruitment assays, efficacy is expressed as % of the response induced by 5 nM WKYMVm (FPR1/FPR2).
Starting from racemic (±)-5a, which we reported previously to be an FPR1-specific agonist (EC50 = 3.2 μM),26 we found that isomers R-(−)-5a and S-(+)-5a showed a similar activity on FPR1/FPR2, and a loss of selectivity for FPR1. Likewise, the R-(−)-enantiomer [R-(−)-5b] was found to be more potent than S-(+)-5b and exhibited comparable activity to the racemate (±)-5b. Interestingly, the S-(+)-5c enantiomer was completely devoid of activity, whereas its enantiomer R-(−)-5c had high activity in the sub-micromolar range (EC50 = 0.84 μM at FPR2) and was even more active than the racemic mixture of enantiomers [(±)-5c]. Similarly, S-(+)-5d was completely inactive, while enantiomer R-(−)-5d had an EC50 in the micromolar range for both FPR1 and FPR2. Elongation of carbon chain on the chiral center resulted in the n-butyl derivatives (±)-5e which exhibited decreased enantiomer preference by the FPR subtypes compared to the 5c and 5d analogues. On the other hand, the enantiomer R-(−)-5e was the most potent FPR1/FPR2 mixed agonist of the series (EC50 ~500 and 90 nM for FPR1 and FPR2, respectively). Moreover, racemic (±)-5e and both enanantiomers R-(−)-5e and S-(+)-5e were the only compounds in this series exhibiting preferential activity for FPR2. Enantiomers of (±)-5f, which have a phenyl group at the chiral center, again exhibited distinct enantiomer preference by the receptor, with R-(−)-5f being highly active, while isomer S-(+)-5f was completely devoid of activity at either FPR1 or FPR2 (Fig. 8). The introduction of an additional alkyl group to the chiral center, forming derivatives (±)-5g, resulted in a loss of receptor affinity, but for S-(+)-5g a FPR1 selectivity was found. Finally, the non-chiral analogue 5h was found to be a mixed FPR1/FPR2 agonist with somewhat higher activity for FPR1. Thus, in general for most compounds, the R-enantiomers were relatively more active than the S-enantiomers and had similar activities to the racemic mixtures. This pattern was further supported by analysis of the racemates and enantiomers in human neutrophils, which also exhibited relative selectivity for the R-enantiomers and had similar enantiomer selectivity as the transfected HL-60 cells (Table 3).
Figure 8.
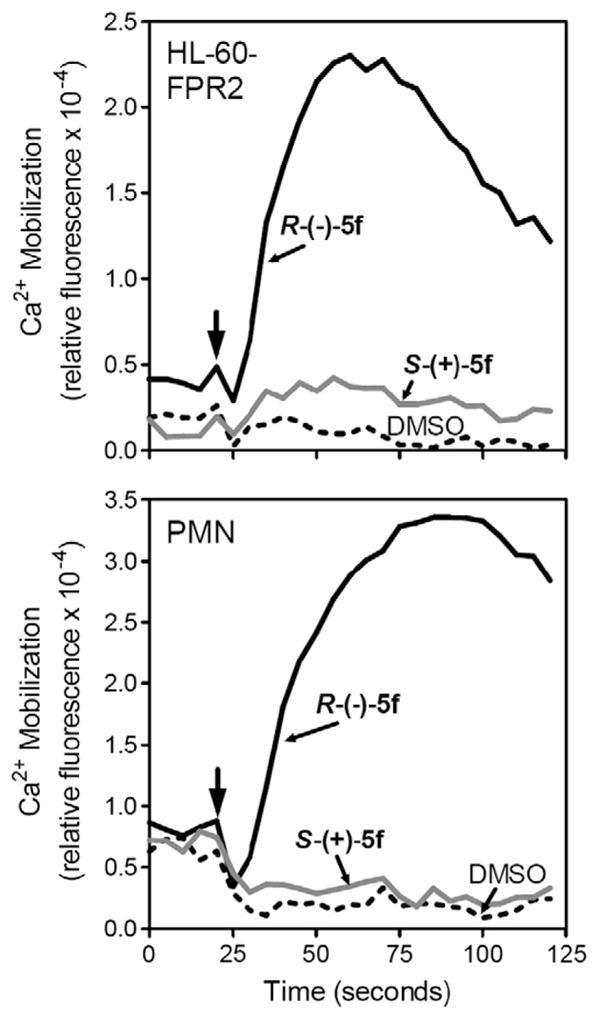
Analysis of Ca2+ mobilization in phagocytes treated with enantiomers S- (+)-5f and R-(+)-5f. HL-60-FPR2 cells (upper panel) or human neutrophils (PMN, lower panel) were loaded with Fluo-4 AM dye, and Ca2+ flux in response to the indicated compounds (500 nM) or DMSO vehicle (negative control) was analyzed, (arrow indicates when treatment was added). Representative experiment from three independent experiments.
3.2. β-Arrestin recruitment
To confirm the FPR1/FPR2 agonist activity of the enantiomers, we evaluated the ability of the individual enantiomers to stimulate β-arrestin recruitment to the activated receptor.40 Because β-arrestin recruitment occurs independently of G-protein coupling, this assay provides a complementary approach to monitor FPR activation. 41 As shown in Table 3, we observed a relatively strong correlation between EC50 values obtained for Ca2+ mobilization and β-arrestin recruitment. Importantly, no β-arrestin recruitment was observed in FPR1/FPR2 CHO-K1 cells treated with the S-(+)-enantiomers of 5b, 5c, 5d, and 5f, confirming enantiomer preference observed in Ca2+ flux assays. Representative dose–response curves for S-(+)-5f and R-(−)-5f are shown in Fig. 9. As positive controls, fMLF or WKYMVm treatment of FPR1 CHO-K1 cells resulted in dose-dependent recruitment of β-arrestin, with EC50 values of 5 and 19 nM, respectively, whereas no recruitment was induced by fMLF in FPR2 CHO-K1 cells (Table 3). Receptor specificity of this cell system has also been demonstrated previously with the FPR2-specific agonist WKYMVM and selective FPR2 inhibitor PBP10.42
Figure 9.
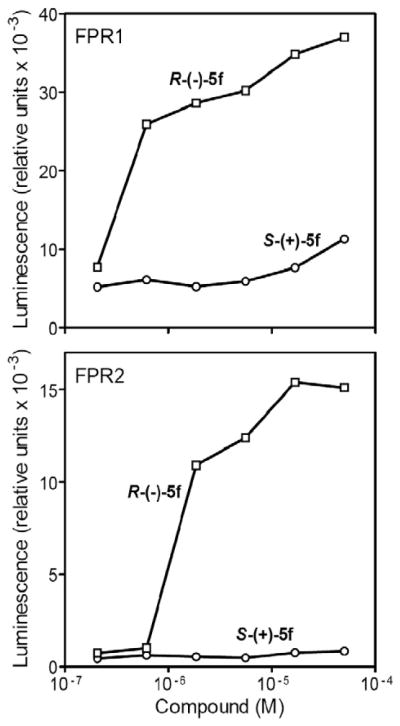
Analysis of β-arrestin recruitment in Cho-K1 cells treated with enantiomers S-(+)-5f and R-(+)-5f. CHO-K1 cells transfected with FPR1 (upper panel) or FPR2 (lower panel) were treated with the indicated compounds (500 nM) or DMSO vehicle (negative control) and analyzed for β-arrestin translocation, as described under Materials and Methods. Representative experiment from three independent experiments.
4. Conclusions
Overall, we synthesized and characterized a series of chiral compounds that exhibited high agonist activity for FPR1/FPR2. Among these compounds, we identified potent mixed FPR1/FPR2 agonists R-(−)-5b, R-(−)-5c, R-(−)-5e, and R-(−)-5f, which had agonist activity in the sub-micromolar to nanomolar range in human neutrophils. The higher selectivity of FPRs for the R-(−)-enantiomers may be related to the ability of these compounds to establish a better interaction with the receptors, as compared to the respective S-(+)-forms. Elongation of the carbon chain at the chiral center (in R-enantiomers) generally increased biological activity (CH3 < C2H5 = n-C3H7 < n-C4H9 = C6H5), suggesting the importance of considering this molecular feature in further development of this project.
5. Experimental section
5.1. Chemistry
Reagents and starting materials were obtained from commercial sources. Extracts were dried over Na2SO4, and the solvents were removed under reduced pressure. All reactions were monitored by thin layer chromatography (TLC) using commercial plates precoated with Merck silica gel 60 F-254. Visualization was performed by UV fluorescence (λmax = 254 nm) or by staining with iodine or potassium permanganate. Chromatographic separations were performed on a silica gel column by gravity chromatography (Kieselgel 40, 0.063–0.200 mm; Merck) or flash chromatography (Kieselgel 40, 0.040–0.063 mm; Merck). Yields refer to chromatographically and spectroscopically pure compounds, unless otherwise stated. When reactions were performed in anhydrous conditions, the mixtures were maintained under nitrogen atmosphere. Compounds were named following IUPAC rules as applied by Beilstein-Institut AutoNom 2000 (4.01.305) or CA Index Name. The identity and purity of intermediates and final compounds was ascertained through NMR, TLC, and analytical HPLC. All melting points were determined on a microscope hot stage Büchi apparatus and are uncorrected.
1H NMR spectra were recorded using Avance 400 instruments (Bruker Biospin Version 002 with SGU). Chemical shifts (δ) are reported in ppm to the nearest 0.01 ppm, using the solvent as internal standard. Coupling constants (J values) are given in Hz and were calculated using ‘TopSpin 1.3’ software rounded to the nearest 0.1 Hz. 13C NMR spectra were recorded using Avance 400 instruments (Bruker Biospin Version 002 with SGU). Chemical shifts (δ) are reported in ppm to the nearest 0.1 ppm, using the solvent as internal standard. Mass spectra (m/z) were recorded on an ESI-TOF mass spectrometer (Bruker Micro TOF), and reported mass values are within the error limits of ±5 ppm mass units. Microanalyses were performed with a Perkin-Elmer 260 elemental analyzer for C, H, N, and the results were within ±0.4% of the theoretical values, unless otherwise stated.
Semi-preparative HPLC enantioseparations were performed using stainless-steel Chiralcel OD® (250 mm × 4.6 mm I.D., 10 μm particle size, Chiral Technologies Europe, Illkirch, France) and Lux Amylose-2® (250 mm × 4.6 mm I.D., 5 μm particle size, Phenomenex, Bologna, Italy) columns. The HPLC consisted of a Perkin-Elmer (Norwalk, CT) series 200 comprised of a quaternary pump, autosampler, Peltier column oven, and UV–VIS detector coupled with a Biologic BioFrac fraction collector (Bio-Rad, Milan, Italy). HPLC-grade solvents were supplied by Sigma–Aldrich (Milan, Italy). The mobile phase mixtures of n-hexane/IPA were degassed by sonication just before use. The signal was acquired and processed by Totalchrom 6.3.1.0504 software. The values of retention time (tR) are given in minutes. The analytical HPLC to determine the enantiomeric excess of the optically pure compounds was performed on the same instrument using chiral Lux Amylose- 2® (50 mm × 4.6 mm I.D., 3 μm particle size, Phenomenex, Bologna, Italy) column and mobile phase of n-hexane/IPA 60:40. In analytical enantioseparations, the sample solutions were prepared from stock solutions of analytes (1 mg/1 mL) by diluting with ethanol to reach a concentration of 0.1 mg/1 mL. The injection volume was 10 μL, the flow rate was 1.0 mL/min, the column temperature was 40 °C, and the UV detector wavelength was fixed at 250 nm. Enantiomeric excess values were calculate from peak areas using the formula (A1−A2)/(A1+A2), where A1 is the major enantiomer.
Specific rotations of enantiomers were measured at 589 nm with a Perkin-Elmer polarimeter model 241 equipped with a Na lamp. The volume of the cell was 2 mL, and the optical path was 10 cm. A standard solution was prepared by dissolving 20 mg of compound into 2 mL of CHCl3 (c = 1). The system was set at a temperature of 20 °C using a Neslab RTE 740 cryostat.
The CD spectra of enantiomers (dissolved in methanol at concentrations ~0.25 mg/mL for analytes and 1 mg/mL for reference molecules) were measured in a quartz cell (0.1 cm-path length) under nitrogen atmosphere at 25 °C using a Jasco model J-810 spectropolarimeter (Jasco, Ishikawa-cho, Hachioji City, Tokyo, Japan). The spectra were averaged over five instrumental scans from 350 to 215 nm at 50 nm/min scanning speed with a spectral band width of 1 nm and data resolution of 0.2 nm. The spectra were acquired and processed with Spectra Analysis software. The intensities are presented in terms of ellipticity values (mdeg).
5.1.1. General procedure for enantiomers S-(−)-3a27/R-(+)-3a, racemates (±)-3b–g and 3h30–32
To a stirred solution of the suitable carboxylic acid 1a–h (1.31 mmol), in anhydrous CH2Cl2 (5 mL), SOCl2 (7.86 mmol) was added drop-wise, and the reaction was carried out at 40 °C for 4 h. The mixtures were allowed to cool down, the solvent and the excess SOCl2 were removed in vacuo, the residues were dissolved in anhydrous THF (5 mL), 4-bromoaniline (2.62 mmol) was added, and the reactions were stirred for an additional 4 h at room temperature. After removal of the solvent under reduced pressure, the mixtures were dissolved in CH2Cl2 and washed sequentially with 2 N HCl (3 × 15 mL), 2 N NaOH (3 × 15 mL), and H2O (15 mL). The organic layer was dried over Na2SO4 and evaporated under vacuum to give the crude products, which were purified by flash column chromatography using toluene/ethyl acetate 6:1 as eluent.
5.1.1.1. R-(+)-2-Bromo-N-(4-bromophenyl)propanamide, R-(+)-3a
Yield = 12%. mp = 150–151 °C (EtOH). (c = 1, CHCl3). ee >99.9%. 1H NMR (CDCl3) δ 1.98 (d, 3H, CHCH3, J = 7.2 Hz), 4.56 (q, 1H, CHCH3, J = 7.0 Hz), 7.45–7.50 (dd, 4H, Ar, J = 6.3 Hz, J = 2.9 Hz), 8.09 (exch br s, 1H, NH). Anal. (C9H9Br2NO) C, H, N.
5.1.2. General procedure for racemates (±)-5b–g and 5h
Mixtures of compound 4 (0.13 mmol), K2CO3 (0.26 mmol), and the suitable intermediate (±)-3b–g or 3h (0.14 mmol), in CH3CN (3 mL) were refluxed under stirring for 4–5 h. After cooling, the solvent was evaporated, and ice-cold water was added to the mixtures. For racemate (±)-5b, after 1 h stirring in an ice-bath, the precipitate was filtered off and purified by crystallization in cyclohexane. For racemates (±)-5c–g and compound 5h, the mixtures were extracted using CH2Cl2 (3 × 10 mL). The organic layer was collected, dried over Na2SO4 and evaporated in vacuo. The crude residue was purified by flash column chromatography using cyclohexane/ethyl acetate 2:1 as eluent for racemates (±)-5c–e, cyclohexane/ethyl acetate 1:3 as eluent for racemate (±)-5f, and cyclohexane/ethyl acetate 1:1 as eluent for compounds (±)-5g and 5h.
5.1.2.1. (±)-N-(4-Bromophenyl)-2-[5-(3-methoxybenzyl)-3-methyl-6-oxopyridazin-1(6H)-yl]butanamide, (±)-5b
Yield = 98%. Mp = 79–81 °C (cyclohexane). 1H NMR (CDCl3) δ 0.95 (t, 3H, CHCH3, J = 7.2 Hz), 2.19–2.38 (m, 5H, 3-CH3 and CH2CH3), 3.81 (s, 3H, OCH3), 3.91 (s, 2H, CH2-Ar), 5.46 (dd, 1H, NCHCH2, J = 1.4 Hz, J = 6.9 Hz), 6.77–6.85 (m, 4H, Ar), 7.27 (t, 1H, Ar, J = 7.9 Hz), 7.30–7.44 (m, 4H, Ar), 9.13 (exch br s, 1H, NH). 13C NMR (CDCl3) δ 168.1 (C), 161.4 (C), 159.9 (C), 145.3 (C), 142.1 (C), 138.5 (C), 137.2 (C), 131.5 (2 CH), 130.7 (CH), 129.9 (CH), 121.6 (CH), 121.1 (2 CH), 116.3 (C), 115.3 (CH), 112.0 (CH), 64.5 (CH), 55.2 (CH3), 36.1 (CH2), 22.9 (CH2), 21.2 (CH3), 10.8 (CH3). MS (ESI) calcd. for C23H24BrN3O3, 470.36; found: m/z 471.12 [M+H]+. Anal. (C23H24BrN3O3) C, H, N.
5.1.3. HPLC resolution of (±)-5a,b by chiral phase HPLC
Both racemates were separated by chiral HPLC using a Chiralcel OD® (250 mm × 4.6 mm I.D., 10 μm particle size) column. The eluent mixture n-hexane/IPA 95:5 was used in isocratic mode (1.2 mL/min at 25 °C), and the UV signal was monitored at λ = 250 nm. Racemates were dissolved in ethanol (1 mg/mL solution), and 50 μL were injected each time. Under the described conditions, the resolution of (±)-5a,b was lower that 1.5 in both cases (Fig. 2); therefore, it was necessary to collect the co-eluting fractions, dry them by evaporation, and reprocess the samples. In order to separate about 20 mg of racemic mixtures, 600 injections were needed, requiring ~200 h to obtain the resolved enantiomeric pairs S-(+)-5a/R-(−)-5a (tR = 19.2, tR = 23.2) and S-(+)-5b/R-(−)-5b (tR = 15.9, tR = 17.9) (see Sections 2 and 5.1 for assignment of the absolute configuration).
5.1.3.1. S-(+)-N-(4-Bromophenyl)-2-[5-(3-methoxybenzyl)-3-methyl-6-oxopyridazin-1(6H)-yl]propanamide, S-(+)-5a
Light-yellow oil. (c = 1, CHCl3). ee >99.9% (determined by analytical chiral HPLC). 1H NMR (CDCl3) δ 1.71 (d, 3H, CHCH3, J = 7.0 Hz), 2.29 (s, 3H, 3-CH3), 3.82 (s, 3H, OCH3), 3.91 (s, 2H, CH2-Ar), 5.71 (q, 1H, CHCH3, J = 7.0 Hz), 6.78 (s, 1H, Ar), 6.81(s, 1H, Ar), 6.84 (d, 2H, Ar, J = 7.4 Hz), 7.28 (t, 1H, Ar, J = 7.8 Hz), 7.40 (d, 4H, Ar, J = 4.9 Hz), 8.99 (exch br s, 1H, NH). MS (ESI) calcd. for C22H22BrN3O3, 456.33; found: m/z 457.11 [M+H]+. Anal. (C22H22BrN3O3) C, H, N.
5.1.3.2. R-(−)-N-(4-Bromophenyl)-2-[5-(3-methoxybenzyl)-3-methyl-6-oxopyridazin-1(6H)-yl]propanamide, R-(−)-5a
Light-yellow oil. (c = 1, CHCl3). ee = 94.8% (determined by analytical chiral HPLC). 1H NMR (CDCl3) δ 1.71 (d, 3H, CHCH3, J = 7.0 Hz), 2.30 (s, 3H, 3-CH3), 3.81 (s, 3H, OCH3), 3.91 (s, 2H, CH2-Ar), 5.71 (q, 1H, CHCH3, J = 7.0 Hz), 6.78 (s, 1H, Ar), 6.81(s, 1H, Ar), 6.84 (d, 2H, Ar, J = 8.3 Hz), 7.28 (t, 1H, Ar, J = 7.8 Hz), 7.40 (d, 4H, Ar, J = 3.0 Hz), 9.01 (exch br s, 1H, NH). MS (ESI) calcd. for C22H22BrN3O3, 456.33; found: m/z 457.11 [M+H]+. Anal. (C22H22BrN3O3) C, H, N.
5.1.4. HPLC resolution of (±)-5c–g by Chiral HPLC
Racemates were separated by chiral HPLC with a Lux Amylose- 2® (250 mm × 4.6 mm I.D., 5 μm particle size) column. The eluent mixture n-hexane/IPA 60:40 was used in isocratic mode (1.5 mL/min at 40 °C), and the UV signal was monitored at λ = 250 nm. Racemates were dissolved in ethanol (2 mg/mL solution), and 100 μL of (±)-5c–f and 80 μL of (±)-5g were injected each time. In order to separate 20 mg of racemic mixtures, about 100 injections were needed, requiring about 25 h to obtain the resolved enantiomeric pairs S-(+)5c/R-(−)-5c (tR = 5.1, tR = 9.4), S-(+)-5d/R- (−)-5d (tR = 3.9, tR = 10.1), S-(+)-5e/R-(−)-5e (tR = 5.4, tR = 9.7), R- (−)-5f/S-(+)-5f (tR = 7.6, tR = 12.3) and R-(−)-5g/S-(+)-5g (tR = 6.7, tR = 8.6) (see Sections 2 and 5.1 for assignment of the absolute configuration).
5.1.4.1. S-(+)-N-(4-Bromophenyl)-2-[5-(3-methoxybenzyl)-3-methyl-6-oxopyridazin-1(6H)-yl]pentanamide, S-(+)-5c
Light-yellow oil. (c = 1, CHCl3). ee >99.9% (determined by analytical chiral HPLC). 1H NMR (CDCl3) δ 0.98 (t, 3H, CHCH3, J = 7.4 Hz), 1.27–1.42 (m, 2H, CH2CH2CH3), 2.15–2.28 (m, 2H, CHCH2CH2), 2.30 (s, 3H, 3-CH3), 3.81 (s, 3H, OCH3), 3.90 (s, 2H, CH2-Ar), 5.56 (t, 1H, NCHCH2, J = 7.4 Hz), 6.75 (s, 1H, Ar), 6.79 (d, 1H, Ar, J = 1.9 Hz), 6.82–6.86 (m, 2H, Ar), 7.28 (t, 1H, Ar, J = 7.8 Hz), 7.39 (s, 4H, Ar), 9.02 (exch br s, 1H, NH). MS (ESI) calcd. for C24H26BrN3O3, 484.39; found: m/z 485.14 [M+H]+. Anal. (C24H26BrN3O3) C, H, N.
5.1.4.2. R-(−)-N-(4-Bromophenyl)-2-[5-(3-methoxybenzyl)-3-methyl-6-oxopyridazin-1(6H)-yl]pentanamide, R-(−)-5c
Light-yellow oil. (c = 1, CHCl3). ee = 99.9% (determined by analytical chiral HPLC). 1H NMR (CDCl3) δ 0.98 (t, 3H, CHCH3, J = 7.4 Hz), 1.28–1.40 (m, 2H, CH2CH2CH3), 2.17–2.28 (m, 2H, CHCH2CH2), 2.30 (s, 3H, 3-CH3), 3.81 (s, 3H, OCH3), 3.90 (s, 2H, CH2-Ar), 5.56 (t, 1H, NCHCH2, J = 7.4 Hz), 6.75 (s, 1H, Ar), 6.79 (d, 1H, Ar, J = 1.5 Hz), 6.82–6.86 (m, 2H, Ar), 7.28 (t, 1H, Ar, J = 7.8 Hz), 7.39 (s, 4H, Ar), 9.14 (exch br s, 1H, NH). MS (ESI) calcd. for C24H26BrN3O3, 484.39; found: m/z 485.14 [M+H]+. Anal. (C24H26BrN3O3) C, H, N.
5.1.5. General procedure for R-(−)-838 and S-(−)-10
To an aqueous (75 mL) solution of R-(−)-2-phenylglycine or S- (−)-α-methylvaline (99.33 mmol) respectively, acetic anhydride (0.75 mol) was added, and the mixture was stirred for 0.5 h at 70 °C until all the amino acid was dissolved. When the reaction mixture was cooled to 5 °C, the crystallized amide was separated by filtration, and the final products were purified by recrystallization from CH3CN.
5.1.5.1. S -(−)-2-Acetamido-2,3-dimethylbutanoic acid, S-(−)-10
Yield = 36%. mp = 213–214 °C (EtOH). (c = 1, EtOH). ee >99.9%. 1H NMR (DMSO-d6) δ 0.84 (d, 3H, CHCH3, J = 6.8 Hz), 0.91 (d, 3H, CHCH3, J = 6.8 Hz), 1.25 (s, 3H, CHCCH3), 1.81 (s, 3H, COCH3), 1.91–1.99 (m, 1H, CCH(CH3)2), 7.07 (exch br s, 1H, NH), 12.08 (exch br s, 1H, OH). Anal. (C8H15NO3) C, H, N.
5.1.5.2. Crystallographic data for compounds R-(−)-838 and S-(−)-10
RX-analysis was carried out with a Goniometer Oxford Diffraction KM4 Xcalibur2 at room temperature. Cu/Kα radiation (40 mA/−40 KV), monochromated by an Oxford Diffraction Enhance ULTRA assembly, and an Oxford Diffraction Excalibur PX Ultra CCD were used for cell parameter determination and data collection. The integrated intensities, measured using the Ω scan mode, were corrected for Lorentz and polarization effects.43 Direct methods of SIR200444 were used in solving the structure, which was refined using the full-matrix least squares on F2 provided by SHELXL97.45 Multi-scan symmetry-related measurement was used as the experimental absorption correction type. The non-hydrogen atoms were refined anisotropically, whereas hydrogen atoms were refined as isotropic.
The X-ray CIF files for these structures have been deposited at the Cambridge Crystallographic Data Centre and allocated with deposition numbers CCDC 833453 [compound R-(−)-8] and CCDC 830537 [compound S-(−)-10]. Copies of the crystallographic data for this article can be obtained, free of charge, from CCDC, 12 Union Road, Cambridge, CB2 1EZ UK [e-mail: deposit@ccdc.cam.ac.uk; internet://www.ccdc.cam.ac.uk].
5.1.5.3. Crystallographic details for R-(−)-8
C10H11NO3, M = 193.20, Orthorhombic, space group P 21 21 21, a = 9.196(1), b = 9.850(1), c = 11.323(1)Å, V = 1025.6(2)Å3, Z = 4 Dc = 1.251, μ = 0.777 mm−1, F(000) = 408. 3364 reflections were collected with a 5.95 < θ < 70.80 range with a completeness to theta 97.3%; 1663 were independent, the parameters were 140 and the final R index was 0.0415 for reflections having I >2σI, and 0.0632 for all data. Flack parameter is −0.1(3) for the exact configuration. Hydrogen atoms were assigned in calculated positions except HN1 on N1, HO1 on O1, and H1 on asymmetric carbon C1, which were found by Fourier analysis. Colorless prismatic shaped crystal (0.12 × 0.07 × 0.06), suitable for collection, was obtained from CH3CN. In PARST analysis, we found a strong intermolecular hydrogen bond between O1—HO1 and O3 in the molecule reported for (−x+1/2, −y+2, +z+1/2) operation symmetry. It has the following parameters:
| O1–H3 | O1…O3 | HO1…O3 | O1–HO1…O3 |
| 0.932(0.04) | 2.550(0.00) | 1.622(0.04) | 173.32(3.94) |
5.1.5.4. Crystallographic details for S-(−)-10
C8H15NO3, M = 173.21, orthorhombic, space group P 21 21 21, a = 5.934(1), b = 10.731(1), c = 15.001(1)Å, V = 955.2(2)Å3, Z = 4 Dc = 1.204, μ = 0.760 mm−1, F(000) = 376. 2985 reflections were collected with a 5.07 < θ < 69.93 range with a completeness to theta 94.6%; 1517 were independent, the parameters were 121, and the final R index was 0.0352 for reflections having I >2σI, and 0.0402 for all data. Flack parameter is 0.02(3) for the exact configuration. Hydrogen atoms were assigned in calculated positions except HN1 on N1, HO1 on O1, and H4 on C4, which were found by Fourier analysis. Colorless cubic shaped crystals (0.08 × 0.07 × 0.05), suitable for collection, were obtained from CH3CN. Also in this case we found, in PARST analysis, a strong intermolecular hydrogen bond between O1—HO1 and O3 in the molecule reported for (−x+1, +y−1/2, −z+1/2) operation symmetry. It has the following parameters:
| O1–HO1 | O1…O3 | HO1…O3 | O1–HO1…O3 |
| 0.883(0.00) | 2.610(0.00) | 1.772(0.00) | 157.57(0.00) |
5.2. Biological assays
5.2.1. Cell culture
Human promyelocytic leukemia HL-60 cells stably transfected with FPR1 (HL-60-FPR1) or FPR2 (HL-60-FPR2) were cultured in RPMI 1640 medium supplemented with 10% heat-inactivated fetal calf serum, 10 mM HEPES, 100 μg/mL streptomycin, 100 U/mL penicillin, and G418 (1 mg/mL), as previously described.46 Wildtype HL-60 cells were cultured under the same conditions, but without G418.
5.2.2. Isolation of human neutrophils
Blood was collected from healthy donors in accordance with a protocol approved by the Institutional Review Board at Montana State University. Neutrophils were purified from the blood using dextran sedimentation, followed by Histopaque 1077 gradient separation and hypotonic lysis of red blood cells, as previously described. 47 Isolated neutrophils were washed twice and resuspended in HBSS without Ca2+ and Mg2+ (HBSS−). Neutrophil preparations were routinely >95% pure, as determined by light microscopy, and >98% viable, as determined by trypan blue exclusion.
5.2.3. Ca2+ mobilization assay
Changes in intracellular Ca2+ were measured with a FlexStation II scanning fluorometer using a FLIPR 3 calcium assay kit (Molecular Devices, Sunnyvale, CA) for human neutrophils and HL-60 cells. All active compounds were evaluated in parent (wild-type) HL-60 cells to verify that the agonists were inactive in non-transfected cells. Human neutrophils or HL-60 cells, suspended in HBSS− containing 10 mM HEPES, were loaded with Fluo-4 AM dye (Invitrogen) (1.25 μg/mL final concentration) and incubated for 30 min in the dark at 37 °C. After dye loading, the cells were washed with HBSS− containing 10 mM HEPES, resuspended in HBSS containing 10 mM HEPES and Ca2+ and Mg2+ (HBSS+), and aliquoted into the wells of a flat-bottomed, half-area-well black microtiter plates (2 × 10⁵ cells/well). The compound source plate contained dilutions of test compounds in HBSS+. Changes in fluorescence were monitored (λex = 485 nm, λem = 538 nm) every 5 s for 240 s at room temperature after automated addition of compounds. Maximum change in fluorescence, expressed in arbitrary units over baseline, was used to determine agonist response. Responses were normalized to the response induced by 5 nMfMLF (Sigma Chemical Co., St. Louis, MO) for HL-60-FPR1 and neutrophils, or 5 nM WKYMVm (Calbiochem, San Diego, CA) for HL-60-FPR2 cells, which were assigned a value of 100%. Curve fitting (5–6 points) and calculation of median effective concentration values (EC50) were performed by nonlinear regression analysis of the dose–response curves generated using Prism 5 (GraphPad Software, Inc., San Diego, CA).
5.2.4. β-Arrestin recruitment assay
The PathHunter® eXpress β-arrestin recruitment assay was performed according to the manufacturer’s protocol using CHO-K1 FPR1 and CHO-K1 FPR2 cells (DiscoveRx Corporation, Fremont, CA). These cell lines monitor GPCR activity by detecting the interaction of β-arrestin with the activated GPCR using β-galactosidase (β-gal) enzyme fragment complementation. Assay plates [96-well half area plates with clear bottom (Greiner Bio-One, Monroe, NC)] were prepared with 5000 cells/well in 50 μL of DiscoveRx Optimized Cell Culture Medium. After incubation at 37 °C (5% CO2, 95% relative humidity) for 48 h, 5.5 μL of test compound was added, and the incubation was continued at 37 °C for 90 min. Detection reagent (25 μL) was added, and the incubation was continued at room temperature for 60 min. Chemiluminescene was monitored using a Fluoroskan Ascent FL microtiter plate reader (Thermo Fisher Scientific, Waltham, MA). Maximum change in luminescence, expressed in arbitrary units over baseline, was used to determine agonist response. Responses were normalized to the response induced by 5 nMWKYMVm for both CHO-FPR1 and CHOFPR2, which was assigned a value of 100%. Curve fitting (5–6 points) and calculation of median effective concentration values (EC50) were performed by nonlinear regression analysis of the dose–response curves generated using GraphPad Prism 5.
Supplementary Material
Acknowledgments
The authors wish to thank Dr. Cristina Faggi for X-ray structure analysis of compounds R-(−)-8 and S-(−)-10 and Dr. Leonardo Gonnelli (CERM, Magnetic Resonance Center, University of Florence) for providing the spectropolarimeter for CD analysis. This work was supported in part by National Institutes of Health grants RR020185 and GM103500, an equipment grant from the M.J. Murdock Charitable Trust, and the Montana State University Agricultural Experimental Station.
Footnotes
Chemical and physical characteristics and spectral data for all the remaining new intermediates (±)-3c,e, racemates (±)-5c–g, enantiomers S-(+)-5b–g/R-(−)-5b–g and for non-chiral analogue 5h. Elemental analysis for all new compounds. Experimental details for crystal structure determination of R-(−)-8 and S-(−)-10 and their crystallographic data.
Supplementary data associated with this article can be found, in the online version, at http://dx.doi.org/10.1016/j.bmc.2012.04.043.
References and notes
- 1.Beutler B. Mol Immunol. 2004;40:845. doi: 10.1016/j.molimm.2003.10.005. [DOI] [PubMed] [Google Scholar]
- 2.Bruno O, Brullo C, Bondavalli F, Schenone S, Ranise A, Arduino N, Bertolotto MB, Montecucco F, Ottonello L, Dallegri F, Tognolini M, Ballabeni V, Bertoni S, Barocelli E. J Med Chem. 2007;50:3618. doi: 10.1021/jm0704402. [DOI] [PubMed] [Google Scholar]
- 3.Serhan CN. Prostaglandins Leukot Essent Fatty Acids. 2005;73:141. doi: 10.1016/j.plefa.2005.05.002. [DOI] [PubMed] [Google Scholar]
- 4.Libby P. Sci Am. 2002;286:46. doi: 10.1038/scientificamerican0502-46. [DOI] [PubMed] [Google Scholar]
- 5.Serhan CN, Brain SD, Buckley CD, Gilroy DW, Haslett C, O’Neill LA, Perretti M, Rossi AG, Wallace JL. FASEB J. 2007;21:325. doi: 10.1096/fj.06-7227rev. [DOI] [PMC free article] [PubMed] [Google Scholar]
- 6.Gilroy DW, Lawrence T, Perretti P, Rossi AG. Nat Rev Drug Disc. 2004;3:401. doi: 10.1038/nrd1383. [DOI] [PubMed] [Google Scholar]
- 7.Zhang L, Falla TJ. Curr Opin Invest Drugs. 2009;10:164. [PubMed] [Google Scholar]
- 8.Dufton N, Perretti M. Pharmacol Ther. 2010;127:175. doi: 10.1016/j.pharmthera.2010.04.010. [DOI] [PubMed] [Google Scholar]
- 9.Migeotte I, Communi D, Parmentier M. Cytokine Growth Factor Rev. 2006;17:501. doi: 10.1016/j.cytogfr.2006.09.009. [DOI] [PubMed] [Google Scholar]
- 10.Ye RD, Boulay F, Wang JM, Dahlgren C, Gerard C, Parmentier M, Serhan CN, Murphy PM. Pharmacol Rev. 2009;61:119. doi: 10.1124/pr.109.001578. [DOI] [PMC free article] [PubMed] [Google Scholar]
- 11.Quehenberger O, Prossnitz ER, Cavanagh SL, Cochrane CG, Ye RD. J Biol Chem. 1993;268:18167. [PubMed] [Google Scholar]
- 12.Migeotte I, Riboldi E, Franssen JD, Grégoire F, Loison C, Wittamer V, Detheux M, Robberecht P, Costagliola S, Vassart G, Sozzani S, Parmentier M, Communi D. J Exp Med. 2005;201:83. doi: 10.1084/jem.20041277. [DOI] [PMC free article] [PubMed] [Google Scholar]
- 13.Cui Y, Le Y, Yazawa H, Gong W, Wang JM. J Leukocyte Biol. 2002;72:628. [PubMed] [Google Scholar]
- 14.Edwards BS, Bologa C, Young SM, Balakin KV, Prossnitz ER, Savchuck NP, Sklar LA, Oprea TI. Mol Pharmacol. 2005;68:1301. doi: 10.1124/mol.105.014068. [DOI] [PubMed] [Google Scholar]
- 15.Tsuruky T, Takahata K, Yoshikawa M. Biosci Biothecol Biochem. 2007;71:1198. doi: 10.1271/bbb.60656. [DOI] [PubMed] [Google Scholar]
- 16.Zhou H, Zhou X, Kouadir M, Zhang Z, Yin X, Yang L, Zhao D. J Neurosci Methods. 2009;181:1. doi: 10.1016/j.jneumeth.2009.04.002. [DOI] [PubMed] [Google Scholar]
- 17.Kilby JM, Hopkins S, Venetta TM, Di Massimo B, Cloud GA, Lee JY, Alldredge L, Hunter E, Lambertm D, Bolognesi D, Matthews T, Johnson MR, Nowak MA, Shaw GM, Saag MS. Nat Med. 1998;4:1302. doi: 10.1038/3293. [DOI] [PubMed] [Google Scholar]
- 18.De Paulis A, Montuori N, Prevete N, Fiorentino I, Rossi FW, Visconte V, Rossi G, Marone G, Ragno P. J Immunol. 2004;173:5739. doi: 10.4049/jimmunol.173.9.5739. [DOI] [PubMed] [Google Scholar]
- 19.Pieretti S, Di Giannuario A, De Felice M, Perretti M, Cirino G. Pain. 2004;109:52. doi: 10.1016/j.pain.2004.01.009. [DOI] [PubMed] [Google Scholar]
- 20.Kirpotina LN, Khlebnikov AI, Schepetkin IA, Ye RD, Rabiet MJ, Jutila MA, Quinn MT. Mol Pharmacol. 2010;77:159. doi: 10.1124/mol.109.060673. [DOI] [PMC free article] [PubMed] [Google Scholar]
- 21.Le Y, Murphy PM, Wang JM. Trends Immunol. 2002;23:541. doi: 10.1016/s1471-4906(02)02316-5. [DOI] [PubMed] [Google Scholar]
- 22.Chiang N, Serhan CN, Dahlén SE, Drazen JM, Hay DW, Rovati GE, Shimizu T, Yokomizo T, Brink C. Pharmacol Rev. 2006;58:463. doi: 10.1124/pr.58.3.4. [DOI] [PubMed] [Google Scholar]
- 23.Serhan CN, Maddox JF, Petasis NA, Akritopoulou-Zanze I, Papayianni A, Brady HR, Colgan SP, Madara JL. Biochemistry. 1995;34:14609. doi: 10.1021/bi00044a041. [DOI] [PubMed] [Google Scholar]
- 24.Takano T, Fiore S, Maddox JF, Brady HR, Petasis NA, Serhan CN. J Exp Med. 1997;185:1693. doi: 10.1084/jem.185.9.1693. [DOI] [PMC free article] [PubMed] [Google Scholar]
- 25.Frohn M, Xu H, Zou X, Chang C, McElvain M, Plant MH, Wong M, Tagari P, Hungate R, Bürli RW. Bioorg Med Chem Lett. 2007;17:6633. doi: 10.1016/j.bmcl.2007.09.043. [DOI] [PubMed] [Google Scholar]
- 26.Cilibrizzi A, Quinn MT, Kirpotina LN, Schepetkin IA, Holderness J, Ye RD, Rabiet MJ, Biancalani C, Cesari N, Graziano A, Vergelli C, Pieretti S, Dal Piaz V, Giovannoni MP. J Med Chem. 2009;52:5044. doi: 10.1021/jm900592h. [DOI] [PMC free article] [PubMed] [Google Scholar]
- 27.Snatzke G, El-Abadelah MM, Nazer MZ. Tetrahedron. 1973;29:487. [Google Scholar]
- 28.Maes B, Lemière G. In: Six-Membered Rings with Two Heteroatoms, and their Fused Carbocyclic Derivatives. Aitken RA, editor. Elsevier; Amsterdam: 2008. pp. 1–116. [Google Scholar]
- 29.Wermuth CG, Leclerc G, Melounov P. Chim Ther. 1971;2:109. [Google Scholar]
- 30.Freund HE, Arndt F, Rusch RDE. 1189312 19650318. 1965
- 31.Mashevskii VV, Pak VD, Zalesov VS, Karavaeva EG. Tr Perm S-Kh In-t. 1975;112:51. [Google Scholar]
- 32.Maran F, Roffia S, Severin Maria G, Vianello E. Electrochim Acta. 1990;35:81. [Google Scholar]
- 33.Tornøe CW, Davis P, Porreca F, Meldal M. J Peptide Sci. 2000;6:594. doi: 10.1002/1099-1387(200012)6:12<594::AID-PSC276>3.0.CO;2-X. [DOI] [PubMed] [Google Scholar]
- 34.Azzolina O, Dal Piaz V, Collina S, Giovannoni MP, Tadini C. Chirality. 1997;9:681. doi: 10.1002/(SICI)1520-636X(1997)9:7<681::AID-CHIR8>3.0.CO;2-A. [DOI] [PubMed] [Google Scholar]
- 35.Okamoto M. J Pharm Biomed Anal. 2002;27:401. doi: 10.1016/s0731-7085(01)00646-x. [DOI] [PubMed] [Google Scholar]
- 36.Collina S, Loddo G, Urbano M, Rossi D, Mammolo MG, Zampieri D, Alcaro S, Gallelli A, Azzolina O. Chirality. 2006;18:245. doi: 10.1002/chir.20227. [DOI] [PubMed] [Google Scholar]
- 37.Cavalli A, Bisi A, Bertucci C, Rosini C, Paluszcak A, Gobbi S, Giorgio E, Rampa A, Belluti F, Piazzi L, Valenti P, Hartmann RW, Recanatini M. J Med Chem. 2005;48:7282. doi: 10.1021/jm058042r. [DOI] [PubMed] [Google Scholar]
- 38.Adam W, Roschmann KJ, Saha-Moller CR. Eur J Org Chem. 2000;3:557. [Google Scholar]
- 39.Salas-Coronado R, Vasquez-Badillo A, Medina-Garcia M, Garcia-Colon JG, Noth H, Contreras R, Flores-Parra AJ. Mol Struct TeoChem. 2001;543:259. [Google Scholar]
- 40.Olson K, Eglen RM. Assay Drug Dev Technol. 2007;5:137. doi: 10.1089/adt.2006.052. [DOI] [PubMed] [Google Scholar]
- 41.McGuinness D, Malikzay A, Visconti R, Lin K, Bayne M, Monsma F, Lunn CA. J Biomol Screen. 2009;14:49. doi: 10.1177/1087057108327329. [DOI] [PubMed] [Google Scholar]
- 42.Forsman H, Onnheim K, Andreasson E, Dahlgren C. Scand J Immunol. 2011;74:227. doi: 10.1111/j.1365-3083.2011.02570.x. [DOI] [PubMed] [Google Scholar]
- 43.Walker N, Stuart D. Acta Cystallogr Sect A. 1983;A39:158. [Google Scholar]
- 44.Burla MC, Caliandro R, Camalli M, Carrozzini B, Cascarano GL, De Caro L, Giacovazzo C, Polidori G, Spagna R. J Appl Cryst. 2005;38:381. [Google Scholar]
- 45.Sheldrick GM. SHELXL97: Program for Crystal Structure Refinement. Institut für Anorganische Chemie de Universitat Göttingen; Göttingen, Germany: 1997. [Google Scholar]
- 46.Christophe T, Karlsson A, Rabiet MJ, Boulay F, Dahlgren C. Scand J Immunol. 2002;56:470. doi: 10.1046/j.1365-3083.2002.01149.x. [DOI] [PubMed] [Google Scholar]
- 47.Schepetkin IA, Kirpotina LN, Khlebnikov AI, Quinn MT. Mol Pharmacol. 2007;71:1061. doi: 10.1124/mol.106.033100. [DOI] [PubMed] [Google Scholar]
Associated Data
This section collects any data citations, data availability statements, or supplementary materials included in this article.