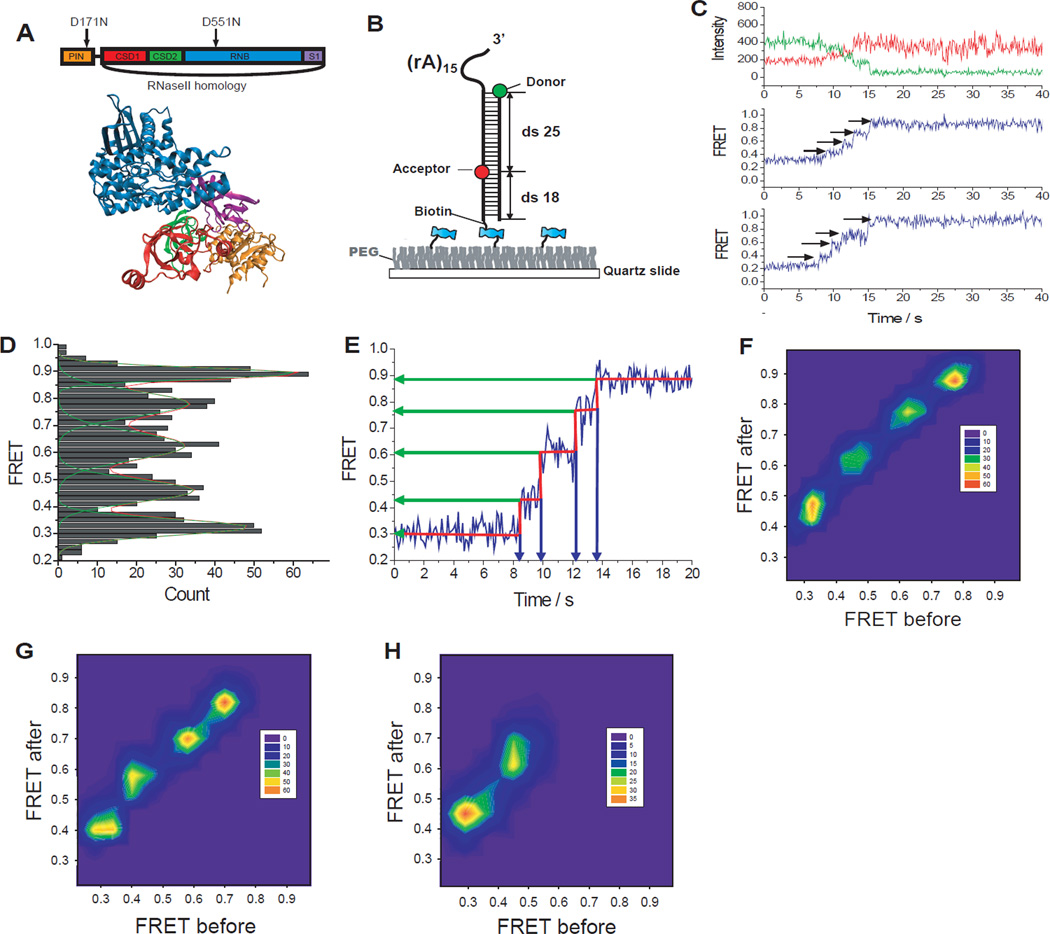
Fig. 1.
Rrp44 unwinds RNA in large discrete steps. (A) Structure of Rrp44 and its domain map. (B) GC-rich (60%) construct was labeled with donor (Cy3) at the ds-ss junction and acceptor (Cy5) at the 25 bp downstream from the donor. (C) Representative fluorescence intensity (top, green for donor and red for acceptor) and FRET efficiency (middle and bottom) time trajectories show step-wise FRET increase during dsRNA unwinding. (D) Distribution of each FRET state visited during unwinding determined using an automated step-finding algorithm (209 molecules). (E) FRET values and dwell times at each step were quantified by an automated fitting step-finding algorithm (red, fig. S4). (F–H) Transition density plots pictorialize FRET changes before and after transitions for the GC-rich (60%) construct (F), GA-only RNA duplex (G, see fig. S5), and Chimera1 (H, see fig. S6).

