

Abstract
Most axons connecting the thalamus and cortex in both directions pass through the thalamic reticular nucleus (TRN), a thin layer of GABAergic cells adjacent to the thalamus, and innervate neurons there. The TRN, therefore, is in a strategic location to regulate thalamocortical communication. We recorded neurons of the somatosensory region of the TRN in a thalamocortical slice preparation and studied the spatial organization of their thalamic input using laser scanning photostimulation. We show that the thalamoreticular pathway is organized topographically for most neurons. The somatosensory region of the TRN can be organized into three tiers. From the inner (thalamoreticular) border to the outer, in a manner roughly reciprocal to the reticulothalamic pathway, each of these tiers receives its input from one of the somatosensory relays of the thalamus—the posterior medial, ventroposterior medial, and ventroposterior lateral nuclei. What is surprising is that approximately a quarter of the recorded neurons received input from multiple thalamic regions usually located in different nuclei. These neurons distribute evenly throughout the thickness of the TRN. Our results, therefore, suggest that there exist a subpopulation of TRN neurons that receive convergent inputs from multiple thalamic sources and engage in more complex patterns of inhibition of relay cells. We propose these neurons enable the TRN to act as an externally driven “searchlight” that integrates cortical and subcortical inputs and then inhibits or disinhibits specific thalamic relay cells, so that appropriate information can get through the thalamus to the cortex.
Introduction
The thalamic reticular nucleus (TRN) is a thin layer of GABAergic cells adjacent to the relay nuclei of the dorsal thalamus. Most axons connecting the thalamus and cortex in either direction pass through the TRN and innervate neurons there with collaterals; TRN neurons, in turn, provide strong, topographic inhibition to thalamic relay cells (Pinault et al., 1995; Pinault and Deschênes, 1998; Lam and Sherman, 2005, 2007). Because of its strategic location between the thalamus and cortex, the TRN is often suggested to be important to attention and regulation of information flow between the thalamus and cortex (Yingling and Skinner, 1976; Crick, 1984; Sherman and Koch, 1986; Guillery et al., 1998; Guillery and Sherman, 2002; Pinault, 2004; Golomb et al., 2006; McAlonan et al., 2006, 2008; Yu et al., 2009). Evidence exists that both the corticoreticular (i.e., inputs from collaterals of corticothalamic axons) and thalamoreticular (i.e., inputs from collaterals of thalamocortical axons) strongly activate the TRN neurons (Gentet and Ulrich, 2003; Evrard and Ropert, 2009; Lam and Sherman, 2010). Thus, information of the spatial organization and synaptic properties of these two inputs to the TRN are obviously important for us to understand how thalamocortical communication is regulated. In this study, we concentrated on the organization of thalamoreticular inputs.
The TRN of the rat and mouse is roughly organized in three tiers. Starting from the thalamoreticular border, the neurons within the inner, middle, and outer tiers project mostly to the posterior medial (POm), ventroposterior medial (VPM), and ventroposterior lateral (VPL) nuclei, respectively (Pinault et al., 1995; Pinault and Deschênes, 1998; Lam and Sherman, 2007). Finer topography within a single tier has also been reported (Lam and Sherman, 2005). Although there is clear topography in the reticulothalamic pathway, the topography in the opposite direction, namely the thalamoreticular pathway, is less clear. Anatomical studies of this pattern have failed to reveal much topography; for instance, large injections of WGA-HRP into VPL/VPM and POm labels terminals across the entire thickness of the TRN (Crabtree et al., 1998).
We used laser-scanning photostimulation to investigate the properties and spatial organization of the thalamoreticular projection to the somatosensory segment of the TRN. We found the organization of the thalamic inputs to TRN neurons to be heterogeneous; even though most TRN neurons receive topographic input from one somatosensory thalamic nucleus, approximately one-fourth of the recorded TRN cells received convergent input from spatially offset thalamic regions that usually are located in different relay nuclei. Our results suggest the TRN provides more than just a simple feedback inhibition to thalamic relay cells. We show that at least a subpopulation of TRN neurons can integrate input from more than one thalamic source, and thus they have the capability to engage in more complex patterns of inhibition of relay cells.
Materials and Methods
Preparation of brain slices.
Our procedures followed the animal care guidelines of the University of Chicago. Experiments were performed on thalamocortical slices taken from BALB/c mice (Harlan), aged 9–12 d postnatal. Each animal was deeply anesthetized by inhalation of isoflurane and its brain was quickly removed and chilled in ice-cold artificial CSF (ACSF), which contained the following (in mm): 125 NaCl, 3 KCl, 1.25 NaH2PO4, 1 MgCl2, 2 CaCl2, 25 NaHCO3, 25 glucose. The brains were sliced at 500 μm using a vibrating tissue slicer (Campden Instruments) in the plane appropriate for an intact thalamocortical slice, to maximize the connectivity between the somatosensory thalamus and TRN (Agmon and Connors, 1991; Reichova and Sherman, 2004; Lam and Sherman, 2007, 2010). The slices were then transferred to a holding chamber containing oxygenated ACSF and incubated at 30°C for at least 1 h before each experiment.
Physiological recording.
Whole-cell recordings were performed using a visualized slice setup (Cox and Sherman, 2000; Lam et al., 2005). Recording pipettes were pulled from borosilicate glass capillaries and had a tip resistance of 3–6 MΩ when filled with solution (termed hereafter the “pipette solution”) containing the following (in mm): 127 K-gluconate, 3 KCl, 1 MgCl2, 0.07 CaCl2, 10 HEPES, 2 Na2-ATP, 0.3 Na-GTP, 0.1 EGTA. The pH of the pipette solution was adjusted to 7.3 with KOH or gluconic acid, and the osmolality was 280–290 mOsm. For most experiments, the pipette solution also contained a 0.4% solution of biocytin in an attempt to fill the recorded neurons for histological processing. The pipette solution has a low chloride reversal potential to allow easy detection of any disynaptic reticular IPSCs at the holding potentials used in our experiments (Fig. 1C).
Figure 1.

Experimental methods. A, Schematic diagram of optical setup. B, Photomicrograph of the thalamocortical slice preparation taken during one experiment with a diagram superimposed showing the photostimulation pattern. The star indicates the recording site; red circles indicate locations where the laser was focused during mapping. The locations were stimulated in a distributed manner to maximize the spatial distance between consecutive trials. The positions of the first five trials are indicated (see Materials and Methods for details). C, Control showing IPSCs clearly visible with the holding potential (−40 or −45 mV) used in our experiments. We recorded from a thalamic relay cell in the VPM (red star); inset shows a photomicrograph taken during the recording. The trace shows a large disynaptic IPSC response evoked through the thalamo-reticulo-thalamic neuronal arc when we stimulated near the soma (yellow circle). The cell was held at −40 mV and the laser power was 24 mW. The yellow dotted lines indicate the borders between thalamic nuclei.
For the experiments in which we measured the reversal potential of the photostimulation-evoked responses, Cs+ was added to the pipette-solution to facilitate holding the cell at potentials >0 mV. In those cases, the pipette solution contained the following (in mm): 117 Cs-gluconate, 12 CsCl, 1 MgCl2, 0.07 CaCl2, 10 HEPES, 2 Na2-ATP, 0.3 Na-GTP, 0.1 EGTA. The pH of this pipette solution was adjusted to 7.3 with CsOH or gluconic acid, and the osmolality was 280–290 mOsm.
A few threads of nylon filaments, attached to a platinum wire slice holder, were used to secure the slices in the bath during the experiment. The slice was carefully placed during the experiment so that the nylon threads did not interfere with electrophysiological recording and photostimulation. We recorded from the somatosensory section of the TRN using an Axopatch 200B. The cells were recorded in voltage-clamp mode at holding potentials of −40 or −45 mV. The access resistance of the cells was constantly monitored throughout the recordings, and experiments were discontinued if the access exceeded 30 MΩ.
All chemicals were purchased from Sigma.
Photostimulation.
We used our previously described methods for photostimulation (Lam and Sherman, 2005, 2007, 2010; Lam et al., 2006). Data acquisition and photostimulation were controlled by the program Tidalwave, written in Matlab (MathWorks) by the laboratory of Karel Svoboda (Shepherd et al., 2003). Nitroindolinyl-caged glutamate (Canepari et al., 2001) (Sigma) was added to the recirculating ACSF to a concentration of 0.39 mm during recording. Focal photolysis of the caged glutamate was accomplished by a pulsed UV laser (355 nm wavelength, frequency-tripled Nd:YVO4, 100 kHz pulse repetition rate; DPSS Laser). The laser beam was directed into the side port of a double-port tube (U-DPTS; Olympus) on top of a microscope (BX50WI; Olympus) using UV-enhanced aluminum mirrors (Thorlabs) and a pair of mirror galvanometers (Cambridge Technology) and then focused onto the brain slice using a low-magnification objective (4×0.1 Plan; Olympus). Angles of the mirror galvanometers were computer controlled and determined the position stimulated by the laser. The optics were designed to generate a nearly cylindrical beam in the slice so as to keep the mapping two dimensional. The Q-switch of the laser and a shutter (LS3-ZM2; Vincent Associate) controlled the timing of the laser pulse for stimulation.
A variable neutral density wheel (Edmund Optics) controlled the power of photostimulation at different levels during experiments by attenuating the intensity of the laser. A microscope coverslip in the laser path reflected a small portion of the laser onto a photodiode, and the current output from this photodiode was used to monitor the laser intensity during the experiment. The photodiode output was calibrated to the laser power at the back focal plane of the objective when we set up the optical equipment, using a power meter (Thorlabs). The transmittance of the objective for the UV laser was ∼40%, thus the actual power of the laser reaching the slices was less than half of the values we state.
The standard stimulation pattern for mapping the thalamic input to TRN neurons consisted of positions arranged in a 16 × 16 array, with 75 μm between adjacent rows and columns (Fig. 1B, red circles). To avoid receptor desensitization, local caged-glutamate depletion, and excitotoxicity, stimulation of these positions were arranged in a sequence that maximized the spatial distance between consecutive trials (Fig. 1B). The grid used for measuring the dendritic arbors of the TRN neurons was 16 × 8 and the distance between adjacent stimulation positions was 50 μm. The order of the stimulation was also arranged in a similar manner to maximize the distance between consecutive trials.
The laser stimulus was 2 ms long, which consisted of 200 pulses. The laser power used varied between 25 and 80 mW (at the back focal plane). The intertrial interval was between 1 and 2 s. A typical experiment lasted between 30 min and 1 h. We did not see any change of the recording quality during experiments to suggest damage from phototoxicity.
Data analysis.
Responses to photostimulation could be easily detected by their short latency and the presence of similar responses in adjacent stimulation locations. These responses were analyzed using programs written in Matlab and Octave (http://www.octave.org). For presentation of the data, traces of the recording immediately after the laser pulse were superimposed on a photomicrograph of the slice (see Results, below). The abovementioned traces were arranged into a 16 × 16 or 16 × 8 array and placed where the laser was focused during the stimulation.
The areas in the slices where thalamic photostimulation evoked responses in the recorded TRN neuron are referred as their thalamic input footprints. Fourier transformation of the first 409.6 ms (4096 data points) of the traces was calculated using Matlab. Power between 5 and 20 Hz was used to estimate the sizes, locations and areas of these footprints; footprints estimated by this more objective method closely matched those estimated by visual inspection. Power between 50 and 300 Hz was used to differentiate responses that consisted of only small, slow depolarization and those that contained large inward spikes.
Centroids of the input footprints that consist of one single continuous area are estimated using an equation similar to the calculation of the center-of-mass, as follows:
 |
 |
The parameters xc and yc are the coordinates of the centroid, whereas xi and yi are the coordinates of all the stimulation sites. Ri values are calculated from the power of the low-frequency components (5–20 Hz) (Pi), using the following equations.
 |
 |
where θ is a threshold value (25), a value chosen to minimize interference from low-frequency noise. The coordinates of the centroids were then compared with photomicrographs taken during the experiments to find out their anatomical locations. The centroids of the footprints for the TRN neurons that received multiple inputs were visually identified.
Each footprint area was calculated by multiplying the number of traces where photostimulation evoked EPSCs larger than the threshold value by the area of a single pixel (5.625 × 10⁻⁹ m2, total area of a 75 μm square).
Sizes of the dendritic arbors of TRN neurons were estimated in a similar manner (see Results, below). The number of positions where depolarization was larger than 50 pA was multiplied by 2.5 × 10⁻⁹ m2 (area of a 50 μm square) to give an estimation of the area of the dendritic arbor.
Locations of input footprints were represented by coordinates based on their distances from the VPL/VPM or VPM/POm border, normalized by the thickness of VPM (see Results, below). Locations of the TRN neurons or recording sites were represented by their normalized distances, i.e., their distance from the thalamoreticular border divided by the thickness of the TRN (see Results, below). It is further simplified by dividing TRN into three tiers of equal thickness (Table 1), as follows: the inner tier, which is closest to the border (normalized distance, N < 0.333); the middle tier (0.333 < N < 0.667); and the outer tier (N > 0.667), which is farthest from the border.
Table 1.
Contingency table showing the relationship between the locations of TRN neurons and their thalamic inputs
| Thalamic input | Tier |
Total | ||
|---|---|---|---|---|
| Outer | Middle | Inner | ||
| VPL | 4 | 0 | 0 | 4 |
| VPM | 5 | 14 | 1 | 20 |
| POm | 0 | 6 | 19 | 25 |
| Multiple | 4 | 4 | 10 | 18 |
| Total | 13 | 24 | 30 | 67 |
Statistical differences were tested using one-way ANOVA, Pearson's correlation and χ2. Fisher's protected least square differences (PLSD) were used for post hoc analysis. All statistical tests were calculated using StatView (SAS Institute).
Results
Photostimulation evokes responses with different temporal properties
Responses of TRN neurons to VPL, VPM, or POm photostimulation typically consist of large inward spikes, usually riding on a slow inward (depolarizating) current (Fig. 2A,B). These spikes are usually large (0.1–1 nA), monophasic, and have a very narrow spike width (<5 ms at half-width). Figure 2, A and B, shows the results of Fourier analysis of these traces, indicating the presence of high-frequency components in their power spectra. Such responses were seen in 51 of 67 reticular cells recorded. In 14 reticular cells, however, thalamic stimulation evoked responses with only small (<50 pA), slow, inward currents (Fig. 2C) and with an absence of high-frequency components in their power spectra. Among these 14 neurons, the thalamic input of one is from VPL, eight are from VPM, and five are from POm. We found no pattern related to the thalamic input (χ2 = 2.01, p = 0.366). In the final two cases, both types of responses were evoked, but from different sites. Figure 2D shows a trace where no response was evoked as well as its Fourier analysis for comparison.
Figure 2.

Temporal properties of the responses evoked by photostimulation. A, B, Responses that consist of large, inward spikes riding on top of slow, inward currents (bottom, blue traces). Their power spectra (top, red curves), obtained using Fourier transforms, indicate the presence of high-frequency components. C, A response that consists only of a small, slow, inward current (bottom, blue trace) and its power spectrum (top, red curve). D, Recording from a trial in which photostimulation did not evoke any response. Insets, Photomicrographs taken during experiments. Green vertical lines indicate the timing of photostimulation. Recording and stimulation sites are indicated by stars and circles, respectively. Laser power was 31 mW in A and B, 56 mW in C and D. Holding potential was −40 mV.
These large inward spikes were not due to the presence of gap junctions between TRN neurons, because in three experiments they persisted in the presence of 200 μm carbenoxolone, a gap-junction inhibitor (Lam and Sherman, 2006). They were unlikely to be action potentials, since they were variable in amplitude and their waveform differed from those of typical action potentials. To confirm this in three other control experiments, we recorded with a pipette solution containing QA-314, a Na+ channel blocker, and Cs+, to help hold the cell at positive potentials. We found these spikes were not blocked by QA-314 (Fig. 3), and they reversed between +20 mV and +40 mV, without correcting for the junction potential (Fig. 3). These findings are consistent with the possibility that these large spikes represent highly synchronized firing of a large number of thalamic neurons or the summation of thalamoreticular EPSCs from a few strong synapses.
Figure 3.
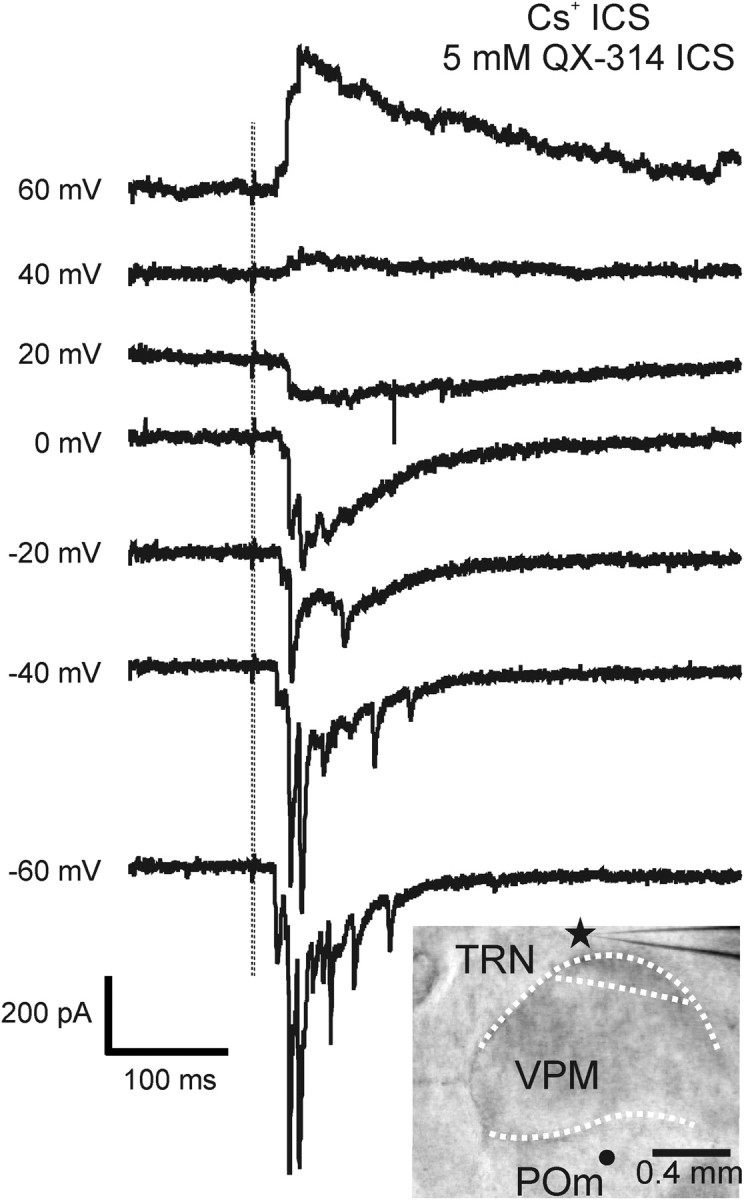
Inward spikes evoked by photostimulation were not blocked by sodium channel blocker. Traces show the responses of a TRN neuron to photostimulation at different holding potentials. The vertical lines indicate the timing of the laser pulses. The recording electrode contained the Cs+ pipette solution and 5 mm QX-314, a sodium channel blocker. Inset shows a photomicrograph taken during the experiment; the star and circle indicate the recording and stimulation sites, respectively. Power of the laser was 80 mW.
Figure 4 shows an example of a TRN neuron responding to thalamic photostimulation. The first 200 ms of response to photostimulation, recorded in voltage-clamp, is shown for each of 256 positions to define the input footprint; these are arranged in a 16 × 16 grid, each response overlying the location of photostimulation. Thus, the thalamoreticular input regions to the recorded cell can be visualized in Figure 4 by noting where in the thalamus inward currents are evoked. This TRN cell has two widely separated footprints, represented by traces 1 and 2 for one and 3 and 4 for the other. Photostimulation of VPM evoked strong inward spikes (Fig. 4B1) in this neuron, whereas stimulating POm using the same laser power evoked only a slow depolarization (Fig. 4B2). The total extents of the two footprints are shown more clearly in the color map insets (Fig. 4A). One shows the low-frequency (5–20 Hz) response, and the other shows the high-frequency (50–300 Hz) components. Here, they show that Fourier analysis failed to detect any high-frequency components for the responses in one of the footprints (yellow circles). The power spectra of three of the four selected traces and one, for comparison, in which no response was evoked, are shown in Figure 4C.
Figure 4.

Responses of TRN neurons to thalamic photostimulation. A, Example of photostimulation of VPM evoking large, narrow EPSC spikes riding on top of a slow depolarization (1, 2); photostimulation of POm elicited slow depolarization (3, 4). The response traces to photostimulation of 256 locations are overlaid on top of a photomicrograph taken during the experiment and placed where they were evoked. The red star indicates the recording site and the yellow dotted lines indicate the borders between thalamic nuclei. The color map insets show the extent of the footprints more clearly by indicating where the power of the response traces exceeds threshold. B, Four selected traces (1–4) shown on a larger scale. C, Power spectra of three selected traces (1, 2, and 4) and one where no response was evoked (5), as calculated by Fourier analysis. The laser power used was 40 mW and the holding potential was −40 mV.
Because of the chloride reversal potential near normal holding potentials, thalamoreticular IPSCs are detectable at the holding potential (−40 mV) used in our experiments. Figure 1C shows the result of one control experiment to demonstrate this. We recorded from a thalamic relay cell and stimulated near the soma. Disynaptic IPSCs were visible despite the depolarization from direct photostimulation. We did not, however, detect any disynaptic IPSC (from reticuloreticular synapses) in any of the 67 TRN neurons for which we activated from thalamic photostimulation.
Spatial organization of the thalamoreticular pathway
Most (49 of 67) TRN neurons responded to photostimulation of a single area located within VPL, VPM, or POm. Figure 5A shows an example in which 256 responses evoked by photostimulation are presented with the same conventions as in Figure 4. The area from which responses were elicited is indicated with a green square and the response traces within that region were enlarged and shown in Figure 5B, right. Figure 5B, left, shows a color map indicating where the power of the low-frequency (5–20 Hz) response exceeds threshold for a clearer visualization of the thalamic input footprint. In 18 of 67 experiments, responses could be evoked from photostimulation of two or more separated areas that were usually located within different thalamic nuclei. Figure 5, C and D, shows an example in which responses could be evoked by VPM (red square) and POm (green rectangle) photostimulation.
Figure 5.

Thalamic input footprints to TRN neurons. A, B, Example of responses evoked from a single area in VPM. A, Responses to photostimulation overlaid on top of photomicrograph taken during the experiment in a similar format as in Figure 2. The red star indicates the recording site. B, Left, The color map indicates where power of the responses exceed threshold overlaid on the photomicrograph of the thalamocortical slices; right, recordings from the area where photostimulation-evoked responses are enlarged (green rectangle). Yellow dotted lines indicate the border between nuclei. Laser power used was 24 mW. C, D, Example of responses elicited from two separate areas in the thalamus. C, Responses overlaid on the photomicrograph of the brain slice, in the same format as A. D, Left, The color map indicates where the responses exceed threshold; right, traces shown as enlarged from the areas within the VPM (red rectangle) and POm (green rectangle) where responses could be evoked. Laser power was 60 mW. Holding potential was −40 mV in both experiments.
Figure 6 summarizes the results from all experiments. The distance of each TRN neuron from the thalamoreticular border and the locations of their footprints was normalized and plotted in Figure 6. The method for normalizing the footprint locations is illustrated in the inset of Figure 6A. Briefly, a line roughly perpendicular to the reticulothalamic border (usually of the shape of a semicircle) is drawn across the centroid of the footprints; its intersections with the VPL/VPM and VPM/POm borders are designated as 0.2 and 0.7 mm (red dots), respectively, values chosen because they are realistic approximations of the distances of these borders from the TRN.
Figure 6.
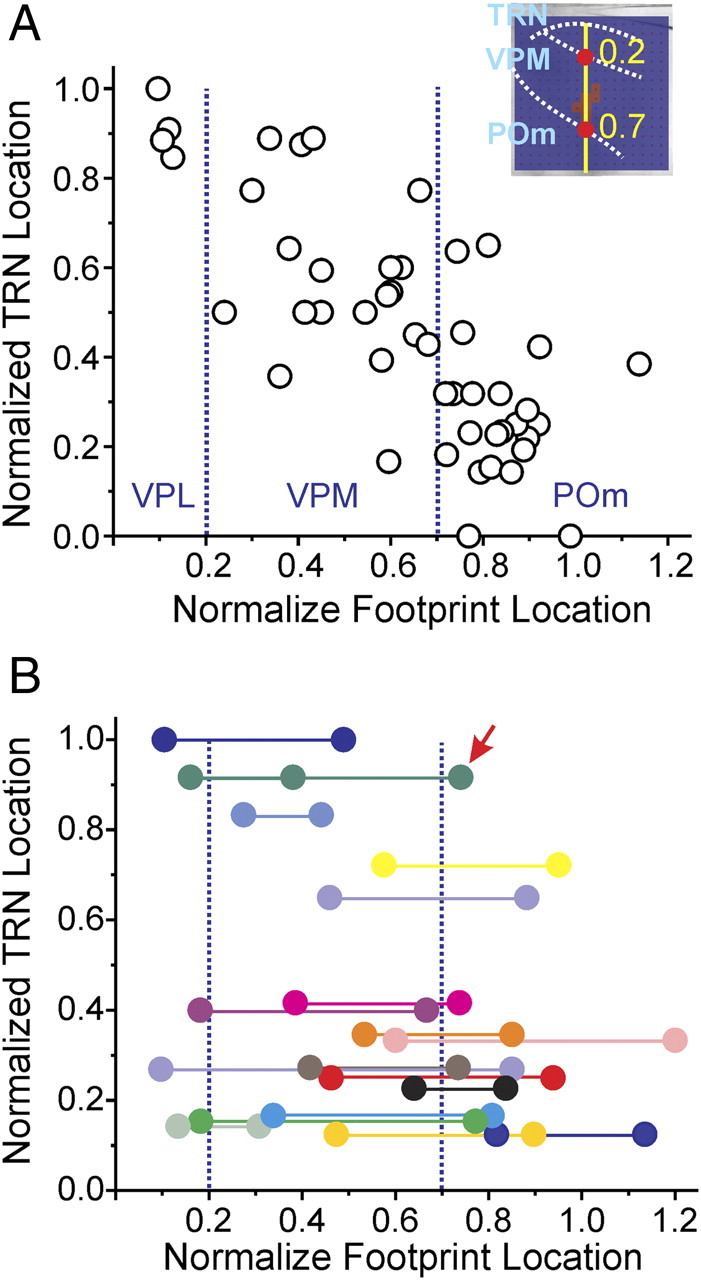
Relationship between the normalized locations of TRN neurons and their thalamic inputs. A, Relationship between neurons that had only one footprint. Inset illustrates the method for normalizing locations of the input footprints (see Results for details). B, Relationship between neurons that received more than one thalamic input: all received two inputs except for the cell indicated by the arrow, which had three inputs. Footprints from the same neuron are color coded and connected by horizontal lines. A, B, Vertical dotted lines indicate the normalized borders between VPL, VPM, and POm.
For all TRN neurons having only one footprint, Figure 6A plots the relationship between the locations of the recording sites and their inputs. Linear regression gave a significant correlation between these two values (r = −0.763, p < 0.0001). Since in the rat and mouse, the TRN is known to be organized into inner, middle, and outer tiers that project to POm, VPM, and VPL, respectively (Pinault et al., 1995; Pinault and Deschênes, 1998; Lam and Sherman, 2007), we grouped the neurons in a similar manner according to their normalized distance from the thalamoreticular border. Table 1 lists the number of neurons located in each tier and the origins of their thalamic inputs.
The locations of the somata and centroids of the footprints for TRN neurons that receive multiple inputs are plotted in Figure 6B. Footprints from the same neuron are color coded and connected by horizontal lines. The TRN neurons that receive multiple thalamic inputs seem to distribute evenly along the thickness of the TRN, with no significant pattern to this distribution (χ2 = 1.47, p = 0.479). All except for one reticular cell received inputs from two separate regions in the slice, and the exception (arrow) got its thalamic input from three separate regions, located in VPL, VPM, and POm.
Size of thalamic input footprints
The area of each thalamic input footprint was determined by counting the number of locations where the power of the low-frequency component (5–20 Hz) of the responses exceeded threshold (see Materials and Methods, above). Although we found no correlation between laser power and footprint area (r = 0.05, p = 0.6874), to reduce any possible variability due to photostimulation strength, we used only maps that were obtained using laser powers >50 mW. In our experience, the area of the thalamic footprint is usually already maximal below this laser power.
Figure 7A shows the plot of area versus the normalized distance of the recording site, as defined in Figure 6A. This shows that the nearer the neuron to the thalamoreticular border, the larger its thalamic input footprint. In Figure 7B, neurons are grouped into three tiers, as described in Table 1. A one-way ANOVA test suggests that footprint areas are significantly different across all three groups (F(2,38) = 13.02, p < 0.0001). Fisher's PLSD indicates that the TRN neurons located inside the inner tier of TRN have larger footprint areas than the other two groups (inner vs outer, p = 0.0004; inner vs middle, p < 0.0001); the differences between the areas of the neurons within the middle and outer tiers are not significant (p = 0.7593).
Figure 7.

Plots of footprint areas versus the locations of TRN neurons and thalamic input. A, Scatter plot of the footprint areas of TRN neurons versus their normalized distance from the thalamoreticular border. B, Average footprint areas of the TRN neurons located in the three tiers of the TRN. TRN neurons are divided into three groups according to the tier in which they are located (see Matherials and Methods). Circles indicate results of individual experiments. C, Average footprint areas of TRN neurons with different thalamic inputs. Cells are divided into four groups according to the origin of their thalamic input (see Materials and Methods). Circles represent the results from individual experiments. *, Significant differences (p < 0.05) in a post hoc analysis using Fisher's PLSD. Bars indicate group averages; error bars are SEMs.
In Figure 7C, footprint areas are plotted against the origin of thalamic inputs. Footprint areas are significantly different among the cells that have only a single thalamic input (F(2,24) = 4.095, p = 0.0295). Fisher's PLSD suggests the neurons that receive POm inputs have larger footprint areas than those receiving VPM inputs (p = 0.0178). Differences of the other two comparisons were not significant (POm vs VPL, p = 0.0508; VPL vs VPM, p = 0.8593). Area differences among all four groups, with cells that have multiple thalamic input included, are not significant (F(3,37) = 2.421, p = 0.0814).
Area of the dendritic arbors of TRN neurons
We tried to determine whether the area of the thalamic input footprints is related to the size of the dendritic arbors of the TRN neurons. For reasons that we cannot explain, the usual method of determining the anatomical correlates (filling of the cell with biocytin) failed to provide consistent data in these experiments. We therefore estimated the area of the dendritic arbors using photostimulation in 24 experiments and using the area from which direct activation of the neuron exceeded a threshold value as a rough estimate of its dendritic extent. We recognize that this actually shows the extent of arbor for which glutamate receptors are dense enough to produce a detectable response at the soma, and so more distal dendrites may not be sampled, either because of too few glutamate receptors or too electrotonically distant a location. However, this is, in some ways, a more functionally relevant estimate of dendritic extent than a straight anatomical measure. The cells were stimulated at 128 positions, arranged in an 16 × 8 array, around the soma (Fig. 8A) and for quantitative comparison across experiments, the same laser power (14 mW) was used for these experiments while we held the cells at −45 mV.
Figure 8.

Estimates of shape and size of dendritic arbors of TRN neurons using photostimulation. A, Responses of TRN neuron (red star) to direct photostimulation. The neuron was stimulated at 128 locations, as indicated. Recordings immediately after the laser pulse are overlaid on a photomicrograph of the slice. Yellow dotted lines indicate the borders of the TRN. Right, Four numbered traces were selected and are displayed on a larger scale. B, Pseudocolor plot of the thalamic input to the neuron in A. Peak EPSCs are plotted using the indicated color scale and overlaid on a photomicrograph of the slice. Borders between thalamic nuclei are indicated with yellow dotted lines. Laser power was 70 mW and the holding potential used during recording was −40 mV. C, Left, Pseudocolor plot of the peak inward (depolarization) currents averaged from two maps for the cell shown in A. Middle and right, Analogous pseudocolor plots for two other TRN neurons. Laser power used for all three experiments was 14 mW and all cells were all held at −45 mV during the recording.
Photostimulation around the soma of TRN neurons evoked large inward currents. Figure 8A shows the results of a typical experiment. As in Figure 4, recording traces are overlaid on a photomicrograph of the slice and placed where the laser was focused; the extent of the dendritic arbors of the neurons can therefore be visualized as the area around the recording site from which photostimulation evoked inward currents. Four selected traces near the recording site are displayed on a larger scale (Fig. 8A, right). Green vertical lines indicate the timing of the laser pulse. Figure 8B is a pseudocolor plot of the peak responses to thalamic photostimulation, showing that it receives thalamic input from a single area inside POm.
The area where inward currents were evoked usually centered around the soma and was oriented roughly parallel to the reticulothalamic border. Figure 8C shows three examples, one from each of the three tiers of TRN. The pseudocolor plots show peak depolarization currents, averaged from two maps, evoked by direct photostimulation. The one on the left (within the green rectangle) is the example shown in Figure 8A.
Figure 9 summarizes the data from all 24 experiments. Figure 9A is a scatter plot of the area of the dendritic arbor against the normalized distance of the neuron from the thalamoreticular border. There is no significant correlation between the area of the dendritic arbor versus the location of the TRN neurons (r = 0.079, p = 0.714). In Figure 9B, we divided the cells into three groups according to their normalized distance from the border, in a similar manner as in Figure 7B, and compared the area of their dendritic arbors; there were no significant differences among the three groups (F(2,21) = 1.436, p = 0.264). We separated the cells into four groups according to the origin of their thalamic inputs and again we found no significant differences between the areas of their dendritic arbors (F(3,20) = 1.381, p = 0.303) (Fig. 9C). Finally, we found no correlation between the areas of the thalamic input footprints and dendritic arbor (r = 0.290, p = 0.169) (Fig. 9D).
Figure 9.

A, Scatter plot of area of the dendritic arbor versus normalized distance from thalamoreticular border. B, Average dendritic arbor areas for TRN neurons located in the three tiers of TRN. C, Plot of average dendritic arbor areas versus the origin of thalamic input. Neurons are grouped according to the nucleus of each of their thalamic inputs. D, Scatter plot of the areas of the dendritic arbor of TRN neurons versus the size of their thalamic input. Error bars represent SEMs; circles indicate individual cells.
Discussion
Spatial organization of the thalamoreticular input
In this study, we recorded from neurons of the somatosensory region of the TRN in a thalamocortical slice preparation. We studied the spatial organization of their thalamic input using laser scanning photostimulation, which has the advantage of stimulating only the soma and dendrites of afferent neurons. For the majority of neurons, we show that the thalamoreticular pathway is organized in a topographic manner (Fig. 6). The somatosensory region of the TRN can be roughly organized into three tiers. From the inner (thalamoreticular) border to the outer, in a manner reciprocal to the reticulothalamic pathway, each of these tiers receives its input from one of the somatosensory relays of the thalamus: POm, VPM, and VPL (Table 1).
The area of the thalamic input to the neurons located in the inner tier of the TRN is larger than the area of the input to the neurons within the middle and outer tiers (Fig. 7A,B). We then grouped the TRN neurons according to the nuclear origin of their inputs and found that neurons that received input from POm have larger input footprints (Fig. 7C). These results are in agreement with reports of the generally less topographic pathways between POm and the TRN (Pinault et al., 1995; Lam and Sherman, 2007).
What is surprising is that approximately a quarter of the recorded neurons received nontopographic input from multiple thalamic regions usually located in different nuclei. We assume that many axons innervating the TRN from the dorsal thalamus were severed during slicing, and so this number may be an underestimate. These neurons receiving multiple input footprints were not concentrated in a particular tier of the TRN. Instead, they seem to distribute evenly throughout the thickness of the TRN (Fig. 6B). Our results, therefore, suggest that there exists a subpopulation of TRN neurons that receive and integrate convergent inputs from multiple thalamic sources.
Temporal properties of thalamoreticular EPSCs
Photostimulation of thalamus usually evoked responses composed of large (up to 1 nA) and narrow (<5 ms at half-width) spikes, sometimes riding on top of a slow inward current. These spikes were not blocked by carbenoxolone, suggesting that they are not related to the spikelets reflecting electrical synapses between TRN neurons (Landisman et al., 2002; Deleuze and Huguenard, 2006; Lam et al., 2006). They were not blocked by the sodium channel blockers QA-314 and they reversed at positive holding potentials, indicating that they were not action potentials. One possibility is that they reflect large thalamoreticular EPSCs; this is consistent with the report that thalamoreticular synapses are strong (Gentet and Ulrich, 2003; Evrard and Ropert, 2009). Moreover, since EPSCs evoked by photostimulation usually have some variation in latency, the narrow width of these spikes indicates that they are the summation of the EPSCs from a small number of presynaptic thalamic relay cells.
However, we also saw responses consisting only of slow and small (<50 pA) inward currents in some of our experiments (Figs. 2, 4). It is similar to what was reported by Evrard and Ropert (2009) as corticothalamic EPSCs, when they stimulated the thalamus using minimal electrical stimulation. In our experiments, since photostimulation stimulates only the dendrites and somata of thalamic relay cells without activating axons of corticothalamic cells, both kinds of responses from our data must be thalamic in origin. Why thalamoreticular EPSCs with two kinds of temporal characteristics exist is not clear. It is possible that this reflects, in addition to the commonly reported input that consists of strong thalamoreticular synapses (Gentet and Ulrich, 2003; Evrard and Ropert, 2009), some thalamoreticular inputs that are both weaker and more convergent, and it may imply that the thalamoreticular pathway may be more complicated and heterogeneous than previously thought.
Dendritic arbor of TRN neurons
Photostimulation was used to estimate the dendritic extent of TRN neurons, since our success rate for filling them with biocytin was inexplicably low. Nonetheless, our method also has the advantage that it measures only the dendritic region responsive to glutamate release and thus provides a more accurate estimate of the area functionally relevant to the thalamoreticular pathway.
The geometry of the dendrite arbors of TRN neurons so measured is homogeneous and is not related to the location of the TRN neurons (Fig. 9A,B), the nuclear origins, or the areas of their thalamic inputs (Fig. 9C,D). This is somewhat unexpected, since neurons that receive their input from POm usually have larger input footprints. It suggests, therefore, that, instead of dendritic geometry, it is the arborization and termination patterns of the presynaptic thalamoreticular axons that determine the spatial organization of the thalamic input to the TRN neurons and that some of these axons innervate TRN neurons nontopographically.
Functional significance
We used photostimulation to study the functional topography of the thalamoreticular pathway. We show that this pathway is roughly topographic, with the TRN organized into three tiers, each receiving input from POm, VPM and/or, VPL (Fig. 10A). We also found evidence for the possibility of two types of thalamoreticular synapses: one that produces strong, narrow EPSC spikelets and one that produces weak, slow EPSCs. We show that a subset of TRN neurons receive converging inputs from more than one thalamic nucleus (Fig. 10B). These neurons distribute evenly across the thickness of the TRN. Even though we could not determine the axonal target of these neurons, given that the reticulothalamic pathway is mostly topographic (Pinault et al., 1995; Pinault and Deschênes, 1998; Lam and Sherman, 2005, 2007), it suggests that all three of the somatosensory relays (VPL, VPM, POm) receive some output from these neurons. The results presented here, therefore, are consistent with the reports by Crabtree and colleagues (Crabtree et al., 1998; Crabtree and Isaac, 2002) that pressure application of glutamate to the thalamus in one nucleus sometimes evokes disynaptic IPSCs in the relay cells in other thalamic nuclei. Our data provide the first concrete evidence that such interactions could be due to convergent input to a subpopulation of TRN neurons.
Figure 10.

Schematic diagram showing the spatial organization of the thalamoreticular pathway. A, A subtype of neurons that receive input from and project back to the somatosensory thalamus in a topographic manner. B, A subtype of neurons that receive convergent inputs from two or more thalamic nuclei and output topographically back to the thalamus.
The circuit organization in Figure 10 suggests that TRN neurons provide more than just simple feedback inhibition to relay cells. Rather, at least a subpopulation of TRN neurons integrates somatosensory inputs from different dorsal thalamic relays (Crabtree et al., 1998; Crabtree and Isaac, 2002). Such interactions between thalamic nuclei allow competition between different input channels at the thalamic level, thus allowing a stronger and more salient input to suppress weaker, less relevant ones. Such a proposed function is consistent with the suspected role of the TRN in attention (Yingling and Skinner, 1976; Crick, 1984; Sherman and Koch, 1986; Guillery et al., 1998; Guillery and Sherman, 2002; Pinault, 2004; Golomb et al., 2006; McAlonan et al., 2006, 2008; Yu et al., 2009).
The findings in this study, combined with those of our recent description of corticoreticulothalamic circuitry (Lam and Sherman, 2010), suggest a complicated and versatile role for the TRN in regulating sensory inputs. We offer one suggestion based on that of Crick (1984) and using his terminology: the TRN acts as a “searchlight” for sensory input, an externally driven searchlight that integrates cortical and subcortical inputs and then selectively inhibits or disinhibits thalamic relay cells, so that the appropriate information can get through the thalamus to the cortex.
Footnotes
This work was supported by National Eye Institute, National Institute on Deafness and Other Communication Disorders, and National Institute of Neurological Disorders and Stroke through National Institutes of Health Grants EY-03038 and DC-008794 awarded to S.M.S. and NS-058468 awarded to Y.W.L.
References
- Agmon A, Connors BW. Thalamocortical responses of mouse somatosensory (barrel) cortex in vitro. Neuroscience. 1991;41:365–379. doi: 10.1016/0306-4522(91)90333-j. [DOI] [PubMed] [Google Scholar]
- Canepari M, Nelson L, Papageorgiou G, Corrie JE, Ogden D. Photochemical and pharmacological evaluation of 7-nitroindolinyl-and 4-methoxy-7-nitroindolinyl-amino acids as novel, fast caged neurotransmitters. J Neurosci Methods. 2001;112:29–42. doi: 10.1016/s0165-0270(01)00451-4. [DOI] [PubMed] [Google Scholar]
- Cox CL, Sherman SM. Control of dendritic outputs of inhibitory interneurons in the lateral geniculate nucleus. Neuron. 2000;27:597–610. doi: 10.1016/s0896-6273(00)00069-6. [DOI] [PubMed] [Google Scholar]
- Crabtree JW, Isaac JT. New intrathalamic pathways allowing modality-related and cross-modality switching in the dorsal thalamus. J Neurosci. 2002;22:8754–8761. doi: 10.1523/JNEUROSCI.22-19-08754.2002. [DOI] [PMC free article] [PubMed] [Google Scholar]
- Crabtree JW, Collingridge GL, Isaac JT. A new intrathalamic pathway linking modality-related nuclei in the dorsal thalamus. Nat Neurosci. 1998;1:389–394. doi: 10.1038/1603. [DOI] [PubMed] [Google Scholar]
- Crick F. Function of the thalamic reticular complex: the searchlight hypothesis. Proc Natl Acad Sci U S A. 1984;81:4586–4590. doi: 10.1073/pnas.81.14.4586. [DOI] [PMC free article] [PubMed] [Google Scholar]
- Deleuze C, Huguenard JR. Distinct electrical and chemical connectivity maps in the thalamic reticular nucleus: potential roles in synchronization and sensation. J Neurosci. 2006;26:8633–8645. doi: 10.1523/JNEUROSCI.2333-06.2006. [DOI] [PMC free article] [PubMed] [Google Scholar]
- Evrard A, Ropert N. Early development of the thalamic inhibitory feedback loop in the primary somatosensory system of the newborn mice. J Neurosci. 2009;29:9930–9940. doi: 10.1523/JNEUROSCI.1671-09.2009. [DOI] [PMC free article] [PubMed] [Google Scholar]
- Gentet LJ, Ulrich D. Strong, reliable and precise synaptic connections between thalamic relay cells and neurones of the nucleus reticularis in juvenile rats. J Physiol. 2003;546:801–811. doi: 10.1113/jphysiol.2002.032730. [DOI] [PMC free article] [PubMed] [Google Scholar]
- Golomb D, Ahissar E, Kleinfeld D. Coding of stimulus frequency by latency in thalamic networks through the interplay of GABAB-mediated feedback and stimulus shape. J Neurophysiol. 2006;95:1735–1750. doi: 10.1152/jn.00734.2005. [DOI] [PubMed] [Google Scholar]
- Guillery RW, Sherman SM. Thalamic relay functions and their role in corticocortical communication: generalizations from the visual system. Neuron. 2002;33:163–175. doi: 10.1016/s0896-6273(01)00582-7. [DOI] [PubMed] [Google Scholar]
- Guillery RW, Feig SL, Lozsádi DA. Paying attention to the thalamic reticular nucleus. Trends Neurosci. 1998;21:28–32. doi: 10.1016/s0166-2236(97)01157-0. [DOI] [PubMed] [Google Scholar]
- Lam YW, Sherman SM. Mapping by laser photostimulation of connections between the thalamic reticular and ventral posterior lateral nuclei in the rat. J Neurophysiol. 2005;94:2472–2483. doi: 10.1152/jn.00206.2005. [DOI] [PubMed] [Google Scholar]
- Lam YW, Sherman SM. Different topography of the reticulothalmic inputs to first- and higher-order somatosensory thalamic relays revealed using photostimulation. J Neurophysiol. 2007;98:2903–2909. doi: 10.1152/jn.00782.2007. [DOI] [PubMed] [Google Scholar]
- Lam YW, Sherman SM. Functional organization of the somatosensory cortical layer 6 feedback to the thalamus. Cereb Cortex. 2010;20:13–24. doi: 10.1093/cercor/bhp077. [DOI] [PMC free article] [PubMed] [Google Scholar]
- Lam YW, Cox CL, Varela C, Sherman SM. Morphological correlates of triadic circuitry in the lateral geniculate nucleus of cats and rats. J Neurophysiol. 2005;93:748–757. doi: 10.1152/jn.00256.2004. [DOI] [PubMed] [Google Scholar]
- Lam YW, Nelson CS, Sherman SM. Mapping of the functional interconnections between thalamic reticular neurons using photostimulation. J Neurophysiol. 2006;96:2593–2600. doi: 10.1152/jn.00555.2006. [DOI] [PubMed] [Google Scholar]
- Landisman CE, Long MA, Beierlein M, Deans MR, Paul DL, Connors BW. Electrical synapses in the thalamic reticular nucleus. J Neurosci. 2002;22:1002–1009. doi: 10.1523/JNEUROSCI.22-03-01002.2002. [DOI] [PMC free article] [PubMed] [Google Scholar]
- McAlonan K, Cavanaugh J, Wurtz RH. Attentional modulation of thalamic reticular neurons. J Neurosci. 2006;26:4444–4450. doi: 10.1523/JNEUROSCI.5602-05.2006. [DOI] [PMC free article] [PubMed] [Google Scholar]
- McAlonan K, Cavanaugh J, Wurtz RH. Guarding the gateway to cortex with attention in visual thalamus. Nature. 2008;456:391–394. doi: 10.1038/nature07382. [DOI] [PMC free article] [PubMed] [Google Scholar]
- Pinault D. The thalamic reticular nucleus: structure, function and concept. Brain Res Brain Res Rev. 2004;46:1–31. doi: 10.1016/j.brainresrev.2004.04.008. [DOI] [PubMed] [Google Scholar]
- Pinault D, Deschênes M. Projection and innervation patterns of individual thalamic reticular axons in the thalamus of the adult rat: a three-dimensional, graphic, and morphometric analysis. J Comp Neurol. 1998;391:180–203. doi: 10.1002/(sici)1096-9861(19980209)391:2<180::aid-cne3>3.0.co;2-z. [DOI] [PubMed] [Google Scholar]
- Pinault D, Bourassa J, Deschênes M. The axonal arborization of single thalamic reticular neurons in the somatosensory thalamus of the rat. Eur J Neurosci. 1995;7:31–40. doi: 10.1111/j.1460-9568.1995.tb01017.x. [DOI] [PubMed] [Google Scholar]
- Reichova I, Sherman SM. Somatosensory corticothalamic projections: distinguishing drivers from modulators. J Neurophysiol. 2004;92:2185–2197. doi: 10.1152/jn.00322.2004. [DOI] [PubMed] [Google Scholar]
- Shepherd GM, Pologruto TA, Svoboda K. Circuit analysis of experience-dependent plasticity in the developing rat barrel cortex. Neuron. 2003;38:277–289. doi: 10.1016/s0896-6273(03)00152-1. [DOI] [PubMed] [Google Scholar]
- Sherman SM, Koch C. The control of retinogeniculate transmission in the mammalian lateral geniculate nucleus. Exp Brain Res. 1986;63:1–20. doi: 10.1007/BF00235642. [DOI] [PubMed] [Google Scholar]
- Yingling CD, Skinner JE. Selective regulation of thalamic sensory relay nuclei by nucleus reticularis thalami. Electroencephalogr Clin Neurophysiol. 1976;41:476–482. doi: 10.1016/0013-4694(76)90059-6. [DOI] [PubMed] [Google Scholar]
- Yu XJ, Xu XX, He S, He J. Change detection by thalamic reticular neurons. Nat Neurosci. 2009;12:1165–1170. doi: 10.1038/nn.2373. [DOI] [PubMed] [Google Scholar]