

Abstract
Bacterial populations in clinical and laboratory settings contain a significant proportion of mutants with elevated mutation rates (mutators). Mutators have a particular advantage when multiple beneficial mutations are needed for fitness, as in antibiotic resistance. Nevertheless, high mutation rates potentially lead to increasing numbers of deleterious mutations and subsequently to the decreased fitness of mutators. To test how fitness changed with mutation accumulation, genome sequencing and fitness assays of nine Escherichia coli mutY mutators were undertaken in an evolving chemostat population at three time points. Unexpectedly, the fitness in members of the mutator subpopulation became constant despite a growing number of mutations over time. To test if the accumulated mutations affected fitness, we replaced each of the known beneficial mutations with wild-type alleles in a mutator isolate. We found that the other 25 accumulated mutations were not deleterious. Our results suggest that isolates with deleterious mutations are eliminated by competition in a continuous culture, leaving mutators with mostly neutral mutations. Interestingly, the mutator–non-mutator balance in the population reversed after the fitness plateau of mutators was reached, suggesting that the mutator–non-mutator ratio in populations has more to do with competition between members of the population than the accumulation of deleterious mutations.
Keywords: bacterial genomics, experimental evolution, mutators
1. Introduction
In commensal and pathogenic bacteria, mutants (mutators) with elevated mutation rates are quite common [1–3], and associated with multiple antibiotic resistance and amelioration of the costs of resistance [3,4]. Mutators are also found in selection experiments, where they hitchhike with genetically linked beneficial mutations [5–7]. Mutators are believed to play an important role in microbial evolvability and are mostly due to mutations in DNA repair systems [8]. Depending on the type and nature of mutations, a mutator allele can increase mutation rates by a factor of 10–10 000.
The selection processes for mutators is relatively well understood. Mutator alleles co-enrich in populations because they are likely to produce rare beneficial mutations more often than their non-mutator competitors [9,10]. The effect of mutator strength, population changes involving mutators and details of hitchhiking with beneficial mutations have been described [6,7,10,11]. As most mutations are neutral or deleterious, it is believed that the beneficial effect of mutator mutations will eventually disappear [9]. Indeed, in experimental populations, the disappearance of mutators has been observed although sometimes they are maintained for extended periods [7]. A key untested question is whether the restoration of low mutation rates is indeed due to the accumulated deleterious mutations in mutators. We can thus ask: is mutation accumulation associated with fitness loss and the reduced fitness of mutators?
In this communication, we report an analysis of mutY mutators in a glucose-limited chemostat culture of Escherichia coli. The genomic sequences of multiple mutY mutator isolates from three different time points allowed us to test whether the increasing accumulation of additional mutations resulted in a fitness decrease. We also analysed fitness contribution of mutator-induced mutations by replacing each of the known beneficial mutations with the wild-type alleles. We find, contrary to expectations, that mutators reach a fitness plateau, but do not decrease in fitness with increasing numbers of mutations in experimental populations.
2. Material and methods
(a). Bacterial strains, strain construction and growth conditions
Strains used in this study are listed in table 1. BW3767 contains a 29-kb DNA deletion including mutY [12]. The mutations in rpoS, mglD and malT of BW3767 were individually replaced by wild-type alleles by P1 transduction (figure 1a). rpoS and mglD were replaced using the method described by Notley-McRobb & Ferenci [14] and Wang et al. [15]. For the replacement of malT, we first constructed an aroB:Amp strain using the protocol given by Yu et al. [16]. The proximity of the aroB::Amp locus to malT allowed greater than 90 per cent co-transduction. We also transferred the evolved alleles of rpoS, mglD and malT of BW3767 into the ancestral strain (figure 1a).
Table 1.
List of E. coli strains used in this study.
| strain | isolate/genotype | time spent in chemostat (days) | reference |
|---|---|---|---|
| 1U1 | chemostat isolate | 21 | this study |
| 1U9 | chemostat isolate | 21 | this study |
| BW3767 | chemostat isolate | 26 | [12] |
| BW4004 | chemostat isolate | 26 | [12] |
| BW4034 | chemostat isolate | 26 | this study |
| BW4040 | chemostat isolate | 26 | [12] |
| 1k13 | chemostat isolate | 37 | this study |
| 1k15 | chemostat isolate | 37 | this study |
| 1k18 | chemostat isolate | 37 | this study |
| BW2952 | MC4100 malG::lplacMu55f(malG::lacZ) | ancestor | [13] |
| BW3454 | BW2952 metC::Tn10 | n.a. | [14,15] |
| BW5316 | BW3767 rpoS galS malT 2952 | n.a. | this study |
| BW5326 | BW2952 rpoS galS malT 3767 | n.a. | this study |
| DY330 | W3110 DlacU169 gal490 lcl857 D(cro-bioA) | n.a. | [16] |
Figure 1.
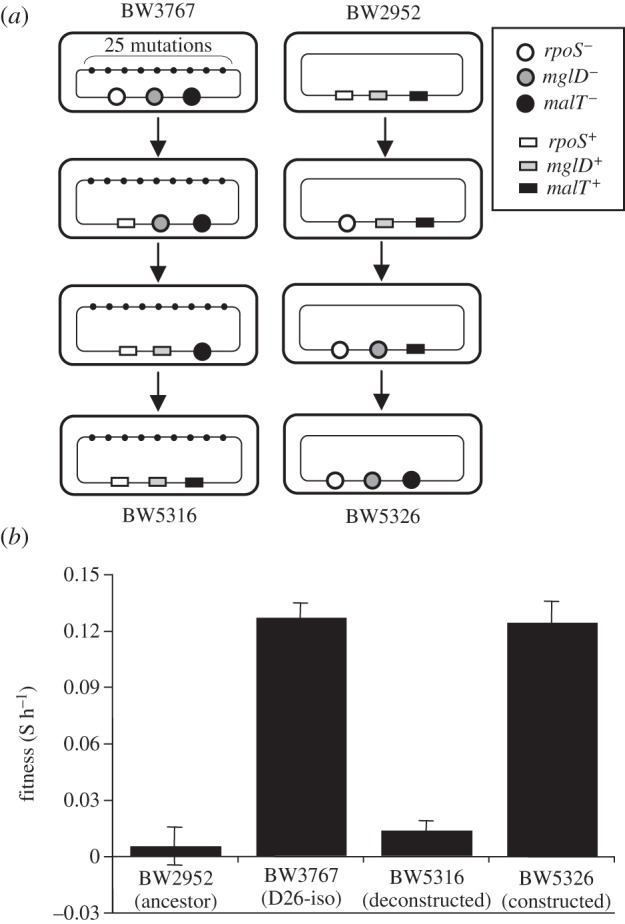
The fitness effects of mutator-dependent mutations. (a) Beneficial mutations in rpoS, mglD and malT from the evolved clone (BW3767) were transferred to the ancestor (BW2952) and vice versa as shown (see §2 for details). (b) Fitness (means ± s.e.m.) of the resulting strains was measured against a reference strain containing a metC::Tn10 countable marker as described by Maharjan et al. [12].
Chemostat experiments and the measures of fitness through competitions with ancestral BW2952 were as described previously [17].
(b). Phenotypic assays and genome sequencing
Phenotypic characterization of the evolved isolates for elevated mutation rate was as described previously [18]. Nine mutator strains from three different time points were randomly chosen for genome sequencing, exactly as described by Maharjan et al. [12].
3. Results and discussion
(a). Dynamics of mutators in chemostat cultures
We sampled 38–44 isolates at days 7, 15, 17, 21, 26 and 37 from an E. coli population growing in a glucose-limited chemostat culture at dilution rate D = 0.1 h−1 (doubling time 6.93 h). The population was initiated with BW2952 and was maintained at approximately 1.6 × 10¹⁰ cells by limiting glucose in the medium. Previous studies have shown that this population contained isolates with a deletion of approximately 29 kb DNA including both mutY and the glcABCDEFG locus, which is required for the utilization of glycolate [18]. Based on the results in figure 2a, the mutY deletion sweep occurred after 15 days and the population contained approximately 50 per cent mutators by 26 days (figure 2a). All the mutators were also glycolate-negative. Interestingly, the mutY mutant did not fully take over the population and its frequency remained relatively constant over the next 11 days.
Figure 2.
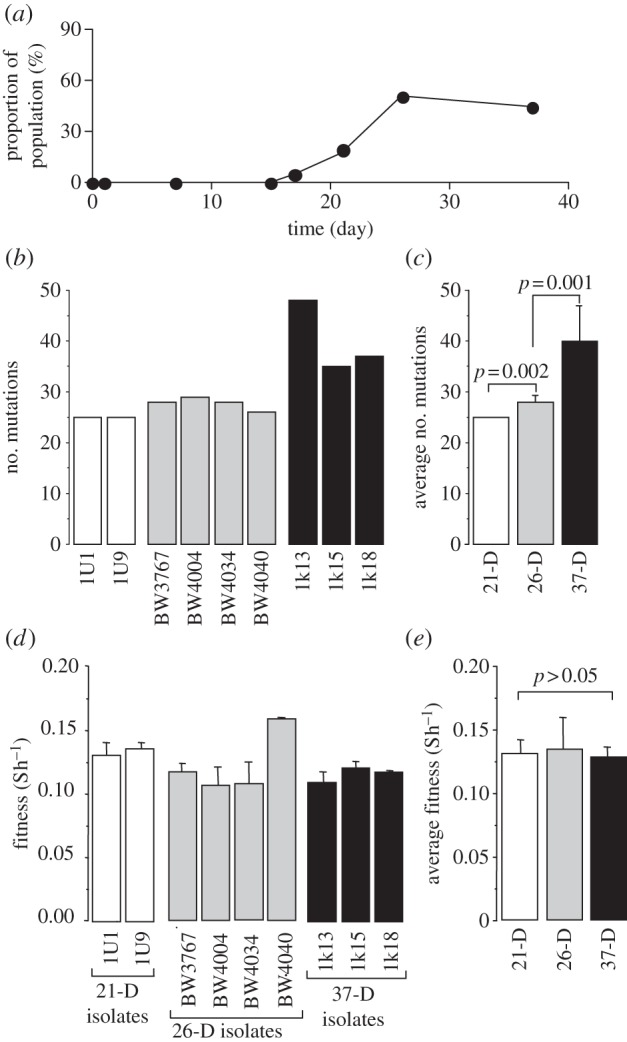
(a) Population dynamics of a mutator in a glucose-limited chemostat culture of E. coli growing at a dilution rate of 0.1 h−1. Samples from different time points were analysed for the mutator phenotype as described by Gaffe et al. [18]. The proportion of mutators in the population (filled circles) is based on testing 38–44 isolates at each time point. (b) Total mutations in nine mutator genomes. (c,e) The average number of mutations and fitness of mutators sampled at 21, 26 and 37 days (means ± s.e.m.). (d) Fitness of mutators was measured as in figure 1b.
(b). Genome-wide mutational accumulation and fitness dynamics
The whole-genome sequences of nine randomly selected mutator isolates (2 at 21, 4 at 26 and 3 at 37 days, respectively), were obtained as described by Maharjan et al. [12]. We detected a total of 187 single nucleotide polymorphisms and one deletion when compared with the ancestral sequence [13]; each strain harboured 25–48 mutations including the same mutY deletion causing a 15-fold increase in rifampicin resistance frequency (mutations listed in the electronic supplementary material, table S1). This compares to a mean of 1.75 mutations/isolate in non-mutators over a similar time-scale [12]. A total of 98.92 per cent of single nucleotide polymorphisms (SNPs) were G:C → T:A mutations, the signature of mutY mutations [8].
The same alleles of rpoS, mglD and sapB were shared by all nine isolates (see the electronic supplementary material, table S1). Mutations in rpoS and mglD confer an early selective advantage in the chemostat environment [14], but the fitness contribution of sapB, encoding a putative antimicrobial transporter subunit, is unknown. The results suggest that the mutY deletion had hitchhiked along with rpoS and mglD, which then lead to accumulation of multiple malT mutations coinciding with the population sweep by mutators. The number of mutations in mutators also increased significantly with time (figure 2c).
To test how mutations affected fitness, we compared all nine mutators by competition with the ancestor in the same chemostat environment. All strains had a significantly higher fitness compared with the ancestor (figure 2d), but surprisingly all except one mutator (BW4040) showed a similar level of fitness (two-tailed p > 0.05). The mean fitness did not decrease with increasing numbers of mutations and neither did it increase (figure 2d). This suggests that once a few beneficial mutations have been accumulated, the advantage of having an elevated rate of mutation disappears. On the other hand, there is no evidence that the accumulated mutations were strongly deleterious.
(c). Ka/Ks as a measure of selection
The Ka/Ks, the ratio of the non-synonymous mutations per non-synonymous site (Ka) to the synonymous mutations per synonymous site (Ks) is used to measure selection acting upon protein-coding genes [19]. A Ka/Ks ratio close to 1 implies neutrality in selection, whereas a ratio considerably higher or lower than 1 indicates either positive or negative selection. We used this test to investigate whether the 114 non-synonymous SNPs and 44 synonymous SNPs in protein-coding genes (see the electronic supplementary material, table S1) were the result of neutral evolution. We estimated Ka/Ks for all mutations in the protein-coding regions of the genomes between 26- and 37-day isolates using Comeron's method [20]. This method takes into account the transition and transversion substitution ratios in the compared genomes, needed because our mutations were mainly G:C → T:A transversions. The population distribution of mutators remained relatively constant between the compared time points (figure 2a). The Ka/Ks values in four lineages between 26- and 37-day isolates ranged from 0.62 to 0.98, with a mean value of 0.85 (table 2). This result suggested that the additional SNPs were likely to have marginal fitness effects. Our estimate is similar to that of Kishimoto et al [21], who found Ka/Ks value of 0.82 after the fixation of a mutator in E. coli that evolved during thermal adaptation experiments. In chemostats, clones with strongly deleterious mutations are likely to be filtered by natural selection and eventually wash out unless they acquire compensatory mutations. Within the limits of detection of our fitness assays, we do not see a high number of isolates with strong fitness effects in surviving mutators. Altogether, our results suggest the filtering effect of natural selection results in mainly neutral mutations in the mutator strains.
Table 2.
The rate of synonymous (Ks) and non-synonymous (Ka) substitutions between 26- and 37-day isolates. Substitution rate, Ka/Ks, the ratio of non-synonymous mutations (Ka) to synonymous mutations (Ks), was estimated using the K-Estimator v. 6.1V software [20]. A Ka/Ks ratio of 3.12 was calculated, based on all the mutations in all the coding regions of each mutated gene in the electronic supplementary material, table S1. The above tabulated values were obtained by applying this ratio to the entire coding region. sSNP, synonymous single nucleotide polymorphism; nsSNP, non-synonymous SNP.
| 26-day isolates | 37-day isolates | no. of sSNP | no. of nsSNP | no. of sSNP sites | no. of nsSNP sites | Ka | Ks | Ka/Ks |
|---|---|---|---|---|---|---|---|---|
| BW3767 | 1K13 | 15 | 42 | 1001887 | 3145925 | 1.34 × 10⁻⁵ | 1.50 × 10⁻⁵ | 0.89 |
| BW3767 | 1K15 | 12 | 35 | 1001887 | 3145925 | 1.11 × 10⁻⁵ | 1.20 × 10⁻⁵ | 0.93 |
| BW3767 | 1K18 | 11 | 34 | 1001887 | 3145925 | 1.08 × 10⁻⁵ | 1.10 × 10⁻⁵ | 0.98 |
| BW4004 | 1K13 | 12 | 34 | 1001887 | 3145925 | 1.08 × 10⁻⁵ | 1.20 × 10⁻⁵ | 0.90 |
| BW4004 | 1K15 | 9 | 27 | 1001887 | 3145925 | 8.58 × 10⁻⁶ | 8.98 × 10⁻⁶ | 0.96 |
| BW4004 | 1K18 | 9 | 25 | 1001887 | 3145925 | 7.95 × 10⁻⁶ | 8.98 × 10⁻⁶ | 0.88 |
| BW4034 | 1K13 | 15 | 42 | 1001887 | 3145925 | 1.34 × 10⁻⁵ | 1.50 × 10⁻⁵ | 0.89 |
| BW4034 | 1K15 | 12 | 35 | 1001887 | 3145925 | 1.11 × 10⁻⁵ | 1.20 × 10⁻⁵ | 0.93 |
| BW4034 | 1K18 | 12 | 33 | 1001887 | 3145925 | 1.05 × 10⁻⁵ | 1.20 × 10⁻⁵ | 0.88 |
| BW4040 | 1K13 | 18 | 38 | 1001887 | 3145925 | 1.21 × 10⁻⁵ | 1.80 × 10⁻⁵ | 0.67 |
| BW4040 | 1K15 | 15 | 31 | 1001887 | 3145925 | 9.85 × 10⁻⁶ | 1.50 × 10⁻⁵ | 0.66 |
| BW4040 | 1K18 | 15 | 29 | 1001887 | 3145925 | 9.22 × 10⁻⁶ | 1.50 × 10⁻⁵ | 0.62 |
(d). Fitness effects of rpoS, mglD and malT
The results of the fitness experiments and Ka/Ks analysis suggested that the majority of mutations accumulating in mutators were near-neutral. To test this experimentally, we replaced the three genes with known beneficial mutations (in rpoS, mglD and malT [14,22]) with the respective wild-type alleles in strain BW3767. This isolate harboured 28 mutations and was significantly fitter than the ancestor under the selection condition (figure 2d).
As shown in figure 1b, the fitness of the resulting rpoS+mglD+malT+ clone was not significantly different from that of the ancestor (two-tailed p > 0.05), which also indicates that the remaining 25 mutations, including sapB, have small fitness effects. Consistent with this notion, an ancestral clone (BW2952) that received all three evolved alleles from BW3767 exhibited similar fitness to BW3767. In total, the fitness of BW3767 was due to mutations in rpoS, mglD and malT, while the combined effect (including possible epistatic effects) of the other 25 mutations in the mutator were not strongly deleterious within the sensitivity of the fitness assay.
4. Conclusions
Our results suggest that mutators reach a fitness plateau in an evolving population, and despite accumulating further mutations, the fitness of mutators was maintained. Mutators with deleterious mutations are presumably washed out of chemostats, maintaining a healthy mutator subpopulation. The mutational cost is borne by the very low proportion of cells with highly deleterious mutations that we never see and are purged. The limit to the sweep by mutators is hence not due to accumulating deleterious effects, but to competition or clonal interference with non-mutator members of the population [7]. Although our results cover short-term events and a particular mutator, we question the common assumption that the balance of mutators in populations is determined by the accumulation of deleterious mutations in the selection environment. This may change in the longer term, when beneficial mutations no longer balance the small fitness loss owing to mutators. Additionally, the global success of mutators may be limited by their deleterious effects in alternative environments [1].
Acknowledgements
We thank the Australian Research council for financial support. The work was also supported by the National 973 Program of China grant (2012CB721001 and 2012CB721101); and the National Natural Science Foundation of China Key Program grant (31030002).
References
- 1.Giraud A, Radman M, Matic I, Taddei F. 2001. The rise and fall of mutator bacteria. Curr. Opin. Microbiol. 4, 582–585 10.1016/S1369-5274(00)00254-X (doi:10.1016/S1369-5274(00)00254-X) [DOI] [PubMed] [Google Scholar]
- 2.LeClerc JE, Li B, Payne WL, Cebula TA. 1996. High mutation frequencies among Escherichia coli and Salmonella pathogens. Science 274, 1208–1211 10.1126/science.274.5290.1208 (doi:10.1126/science.274.5290.1208) [DOI] [PubMed] [Google Scholar]
- 3.Oliver A, Canton R, Campo P, Baquero F, Blazquez J. 2000. High frequency of hypermutable Pseudomonas aeruginosa in cystic fibrosis lung infection. Science 288, 1251–1254 10.1126/science.288.5469.1251 (doi:10.1126/science.288.5469.1251) [DOI] [PubMed] [Google Scholar]
- 4.Perron GG, Hall AR, Buckling A. 2010. Hypermutability and compensatory adaptation in antibiotic-resistant bacteria. Am. Nat. 176, 303–311 10.1086/655217 (doi:10.1086/655217) [DOI] [PubMed] [Google Scholar]
- 5.Barrick JE, Yu DS, Yoon SH, Jeong H, Oh TK, Schneider D, Lenski RE, Kim JF. 2009. Genome evolution and adaptation in a long-term experiment with Escherichia coli. Nature 461, 1243–1247 10.1038/nature08480 (doi:10.1038/nature08480) [DOI] [PubMed] [Google Scholar]
- 6.Notley-McRobb L, Seeto S, Ferenci T. 2002. Enrichment and elimination of mutY mutators in Escherichia coli populations. Genetics 162, 1055–1062 [DOI] [PMC free article] [PubMed] [Google Scholar]
- 7.Shaver AC, Dombrowski PG, Sweeney JY, Treis T, Zappala RM, Sniegowski PD. 2002. Fitness evolution and the rise of mutator alleles in experimental Escherichia coli populations. Genetics 162, 557–566 [DOI] [PMC free article] [PubMed] [Google Scholar]
- 8.Miller JH. 1996. Spontaneous mutators in bacteria: insights into pathways of mutagenesis and repair. Annu. Rev. Microbiol. 50, 625–643 10.1146/annurev.micro.50.1.625 (doi:10.1146/annurev.micro.50.1.625) [DOI] [PubMed] [Google Scholar]
- 9.Taddei F, Radman M, Maynard-Smith J, Toupance B, Gouyon PH, Godelle B. 1997. Role of mutator alleles in adaptive evolution. Nature 387, 700–702 10.1038/42696 (doi:10.1038/42696) [DOI] [PubMed] [Google Scholar]
- 10.Tenaillon O, Toupance B, Le Nagard H, Taddei F, Godelle B. 1999. Mutators, population size, adaptive landscape and the adaptation of asexual populations of bacteria. Genetics 152, 485–493 [DOI] [PMC free article] [PubMed] [Google Scholar]
- 11.Arjan JG, de Visser M, Zeyl CW, Gerrish PJ, Blanchard JL, Lenski RE. 1999. Diminishing returns from mutation supply rate in asexual populations. Science 283, 404–406 10.1126/science.283.5400.404 (doi:10.1126/science.283.5400.404) [DOI] [PubMed] [Google Scholar]
- 12.Maharjan RP, Ferenci T, Reeves PR, Li Y, Liu B, Wang L. 2012. The multiplicity of divergence mechanisms in a single evolving population. Genome Biol. 13, R41. 10.1186/gb-2012-13-6-r41 (doi:10.1186/gb-2012-13-6-r41) [DOI] [PMC free article] [PubMed] [Google Scholar]
- 13.Ferenci T, Zhou Z, Betteridge T, Ren Y, Liu Y, Feng L, Reeves PR, Wang L. 2009. Genomic sequencing reveals regulatory mutations and recombinational events in the widely used MC4100 lineage of Escherichia coli K-12. J. Bacteriol. 191, 4025–4029 10.1128/JB.00118-09 (doi:10.1128/JB.00118-09) [DOI] [PMC free article] [PubMed] [Google Scholar]
- 14.Notley-McRobb L, Ferenci T. 1999. Adaptive mgl-regulatory mutations and genetic diversity evolving in glucose-limited Escherichia coli populations. Environ. Microbiol. 1, 33–43 10.1046/j.1462-2920.1999.00002.x (doi:10.1046/j.1462-2920.1999.00002.x) [DOI] [PubMed] [Google Scholar]
- 15.Wang L, et al. 2010. Divergence involving global regulatory gene mutations in an Escherichia coli population evolving under phosphate limitation. Genome Biol. Evol. 2, 478–487 10.1093/gbe/evq035 (doi:10.1093/gbe/evq035) [DOI] [PMC free article] [PubMed] [Google Scholar]
- 16.Yu D, Ellis HM, Lee EC, Jenkins NA, Copeland NG, Court DL. 2000. An efficient recombination system for chromosome engineering in Escherichia coli. Proc. Natl Acad. Sci. USA 97, 5978–5983 10.1073/pnas.100127597 (doi:10.1073/pnas.100127597) [DOI] [PMC free article] [PubMed] [Google Scholar]
- 17.Maharjan R, Seeto S, Notley-McRobb L, Ferenci T. 2006. Clonal adaptive radiation in a constant environment. Science 313, 514–517 10.1126/science.1129865 (doi:10.1126/science.1129865) [DOI] [PubMed] [Google Scholar]
- 18.Gaffe J, McKenzie C, Maharjan RP, Coursange E, Ferenci T, Schneider D. 2011. Insertion sequence-driven evolution of Escherichia coli in chemostats. J. Mol. Evol. 72, 398–412 10.1007/s00239-011-9439-2 (doi:10.1007/s00239-011-9439-2) [DOI] [PubMed] [Google Scholar]
- 19.Hurst LD. 2002. The Ka/Ks ratio: diagnosing the form of sequence evolution. Trends Genet. 18, 486. 10.1016/S0168-9525(02)02722-1 (doi:10.1016/S0168-9525(02)02722-1) [DOI] [PubMed] [Google Scholar]
- 20.Comeron JM. 1999. K-Estimator: calculation of the number of nucleotide substitutions per site and the confidence intervals. Bioinformatics 15, 763–764 10.1093/bioinformatics/15.9.763 (doi:10.1093/bioinformatics/15.9.763) [DOI] [PubMed] [Google Scholar]
- 21.Kishimoto T, et al. 2010. Transition from positive to neutral in mutation fixation along with continuing rising fitness in thermal adaptive evolution. PLoS Genet. 6, e1001164. 10.1371/journal.pgen.1001164 (doi:10.1371/journal.pgen.1001164) [DOI] [PMC free article] [PubMed] [Google Scholar]
- 22.Notley-McRobb L, Ferenci T. 1999. The generation of multiple co-existing mal- regulatory mutations through polygenic evolution in glucose-limited populations of Escherichia coli. Environ. Microbiol. 1, 45–52 10.1046/j.1462-2920.1999.00003.x (doi:10.1046/j.1462-2920.1999.00003.x) [DOI] [PubMed] [Google Scholar]