Abstract
In low-resource areas, the most common method of tuberculosis (TB) diagnosis is visual identification of rod-shaped TB bacilli in microscopic images of sputum smears. We present an algorithm for automated TB detection using images from digital microscopes such as CellScope [2], a novel, portable device capable of brightfield and fluorescence microscopy. Automated processing on such platforms could save lives by bringing healthcare to rural areas with limited access to laboratory-based diagnostics. Our algorithm applies morphological operations and template matching with a Gaussian kernel to identify candidate TB-objects. We characterize these objects using Hu moments, geometric and photometric features, and histograms of oriented gradients and then perform support vector machine classification. We test our algorithm on a large set of CellScope images (594 images corresponding to 290 patients) from sputum smears collected at clinics in Uganda. Our object-level classification performance is highly accurate, with Average Precision of 89.2% ± 2.1%. For slide-level classification, our algorithm performs at the level of human readers, demonstrating the potential for making a significant impact on global healthcare.
1 Introduction
Though tuberculosis (TB) receives relatively little attention in high-income countries, it remains the second leading cause of death from infectious disease worldwide (second only to HIV/AIDS) [10]. The majority of TB cases may be treated successfully with the appropriate course of antibiotics, but diagnosis remains a large obstacle to TB eradication. Presently, the most common method of diagnosing patients with TB is visually screening stained smears prepared from sputum. Technicians view the smears with microscopes, looking for rod-shaped objects (sometimes characterized by distinct beading or banding) that may be Mycobacterium tuberculosis, the bacteria responsible for TB disease. Apart from the costs of trained technicians, laboratory infrastructure, microscopes and other equipment, this process suffers from low recall rates, inefficiency, and inconsistency due to fatigue and inter-evaluator variability [9]. Hence, with the advent of low-cost digital microscopy, automated TB diagnosis presents a ready opportunity for the application of modern computer vision techniques to a real-world, high-impact problem.
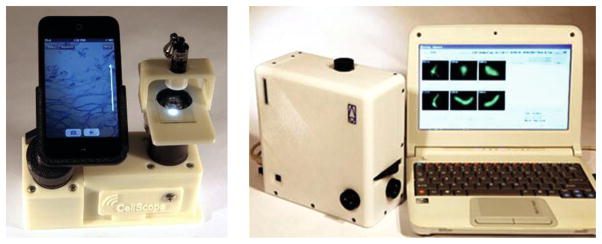
We propose an algorithm for automated TB detection using images from digital microscopes such as CellScope [2] (Figure 1), a low-cost and portable alternative to standard laboratory-based microscopes. We present results from a large dataset of sputum smears collected under real-field conditions in Uganda. Our algorithm performs at the level of human readers when classifying slides, which opens exciting opportunities for deployment in large-scale clinical settings. Since our method is capable of processing direct-stained smears, only basic staining supplies are required for slide preparation. Rapid staining kits such as the QBC Diagnostics F.A.S.T. kit are viable in field settings and could thus be used with CellScope in remote areas that lack laboratory infrastructure.
Fig. 1.

Two versions of CellScope, a novel mobile microscope. Various uses include point-of-care diagnostics or transmission of images from rural areas to medical experts.
Previous Work
The two main methods of screening sputum samples are fluorescence microscopy (FM) and brightfield microscopy, in which the sputum smears are stained with auramine-O and Ziehl-Neelsen respectively (see Figure 2). CellScope is capable of both types of microscopy, but we focus on FM here because studies indicate it is more sensitive and significantly faster [3,13]. Several groups have explored automated TB detection for conventional FM microscopes. Veropoulos et al. [18] applied Canny edge detection, filtered objects based on size, and used boundary tracing to identify candidate objects. Fourier descriptors, intensity features, and compactness were then combined with various probabilistic classification methods, and a multilayer neural network achieved the best performance. Forero et al. [9] took a generative approach, representing the TB-bacilli class with a Gaussian mixture model (GMM) and using Bayesian classification techniques. Hu moment features were chosen for their invariance to rotation, scaling, and translation. Other groups have proposed algorithms for brightfield microscopy [7,12], but these algorithms often rely on the distinct color characteristics of Ziehl-Neelsen staining.
Fig. 2.

Left: Sample CellScope fluorescence image. Right: Sample brightfield image [14].
Additional TB diagnostic procedures include culture and polymerase chain reaction (PCR)-based methods. Culture results are ideally used to verify smear screenings and are the current gold-standard for diagnosis. However, culture assays are more expensive and technically challenging to perform than smear microscopy and require prolonged incubation: about 2–6 weeks to allow accurate evaluation of bacteria. PCR-based methods such as Cepheid’s GeneXpert assess the presence of TB bacterial DNA and are rapid, more sensitive than smear microscopy, and capable of testing resistance to a common anti-TB antibiotic [1]. However, PCR-based methods continue to lag in sensitivity compared to culture and rely on costly equipment that is poorly suited for low-resource, peripheral healthcare settings [8]. Sputum smear microscopy continues to be by far the most widely used method of TB diagnosis, suggesting that enhancements to microscopy-based screening methods could provide significant benefit to large numbers of TB-burdened communities across the globe.
2 Methods and Materials
2.1 Algorithm
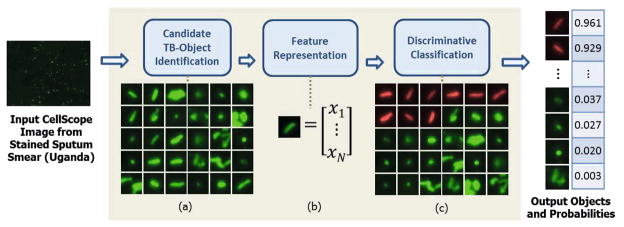
We propose a TB detection algorithm for FM with three stages: (1) candidate TB-object identification, (2) feature representation, and (3) discriminative classification. A block diagram of the algorithm is shown in Figure 3.
Fig. 3.

Overview of algorithm. (a) Array of candidate TB-objects. (b) Each candidate characterized by 102-dimensional feature vector. (c) Candidates sorted by decreasing probability of being a TB-bacillus (row-wise, top to bottom). Sample subset of candidate TB-objects with corresponding probabilities shown at the output. Object-level probabilities subsequently used to determine slide-level diagnosis.
Candidate TB-Object Identification
In the first stage, our goal is to identify any bright object that is potentially a TB-bacillus. We perform a white top-hat transform and template matching with a Gaussian kernel. The white top-hat transform reduces noise from fluctuations in the background staining, and the template matching picks out areas that resemble bright spots. The result is a binarized image, from which we extract the connected components as candidates. We consider a region of interest or patch from the input image centered around each candidate. The patch-size (24×24 pixels) is chosen based on the known size of the TB-bacilli (typically 2–4μm in length and 0.5μm in width) and CellScope’s sample-referenced pixel spacing of 0.25μm/pixel.
Feature Representation
We characterize each candidate TB-object using Hu moments [11]; geometric and photometric features; and histograms of oriented gradients (HOG) [4]. Hu moments, photometric features, and HOG are calculated from the grayscale patch, whereas geometric properties are determined from a binarized version of the image patch. Binarization is achieved using Otsu’s method [15], which minimizes the variance within each of the two resulting pixel classes. Eight Hu moment features provide a succinct object-level description that is invariant to rotation, translation, and scaling (similar to [9]). In addition, we calculate fourteen geometric and photometric descriptors: area, convex area, eccentricity, equivalent diameter, extent, filled area, major/minor axis length, max/min/mean intensity, perimeter, solidity, and Euler number. Finally, we extract HOG features from each 24×24 patch using two scales and 8 orientations, giving eighty HOG feature values. We thus obtain a 102-dimensional feature vector representing the appearance of each candidate TB-object.
Candidate TB-Object Classification
We consider three object-level classifiers in our experiments (in order of increasing discriminative power and computational cost): logistic regression, linear support vector machines (SVMs) and intersection kernel (IK) SVMs [5,6,17]. Intuitively, SVMs find the hyperplane that maximizes the margin between the TB-positive and TB-negative classes in the feature space. IKSVMs achieve nonlinear decision boundaries via the intersection kernel, defined as K(u, v) =Σi min(ui, vi). We normalize the input feature vectors using maximum-minimum standardization and apply logistic regression to the SVM outputs to obtain probabilities [16], which indicate the likelihood of each object being a TB-bacillus.
Performance Metrics
We present our experimental results using two sets of performance metrics: Recall/Precision and Sensitivity/Specificity, which are widely used in the computer vision and medical communities respectively. Recall refers to the fraction of true positive objects correctly classified as positives, while Precision refers to the fraction of objects classified as positive that are true positives. Sensitivity is the same as Recall, and Specificity is Recall for the negative class. Recall/Precision are more appropriate for gauging object-level performance in this study because our negative class is much larger than our positive class. At the slide level, however, our data has balanced class sizes and thus both Recall/Precision and Sensitivity/Specificity are suitable. In this study, we optimize over Average Precision (AP) at the slide level, which places equal weight on Recall and Precision. Often in practice it is more useful to have either very high Precision or very high Recall (rule-in or rule-out value, respectively) rather than moderately high values for both. In these cases, one may instead optimize over the maximum Fβ -measure, defined as , where β < 1 gives more weight to Precision than Recall (β = 1 gives equal weight).
2.2 Dataset and Ground Truth
Our dataset consists of sputum smear slides collected at clinics in Uganda. Fluorescence images of these smears were taken using CellScope, which has a 0.4NA objective and an 8-bit monochrome CMOS camera. CellScope gives a Rayleigh resolution of 0.76μm and is capable of effective magnifications of 2000–3000x. The CellScope images are 1944×2592 pixels and cover a 640×490μm field of view at the smear-referenced plane. We use 594 CellScope images (296 TB-positive, 298 TB-negative), which correspond to 290 patients (143 TB-positive, 147 TB-negative). We have slide-level human reader and culture classification results for all 290 slides. In addition, a human annotator labeled TB-objects in a subset of the positive images (92 of 296 images), resulting in 1597 positive TB-objects. The human readers in this study received guidance from experts, and their performance has been shown to be statistically comparable to that of trained microscopists. Our dataset and human annotations will be publicly available.
3 Experimental Results and Discussion
Object-Level Evaluation
For the object-level classification task, we use the subset of TB-positive images for which we have human annotations and all TB-negative images. Applying our object identification procedure, we retain 98.8% of the positive TB-objects in the dataset after the first step. All objects identified in TB-negative images are considered negative objects. This results in 1597 positive and 34948 negative objects, which correspond to 390 images (92 positive and 298 negative).
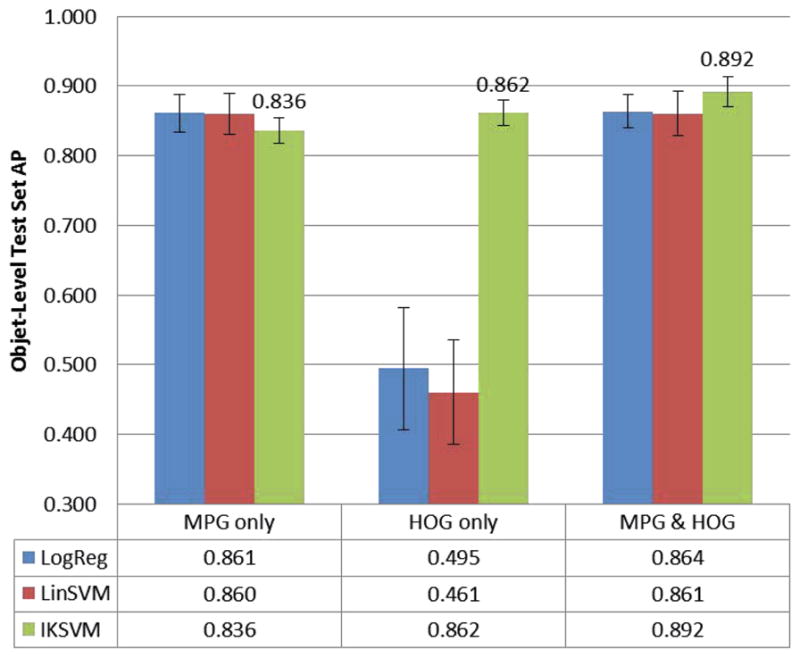
We generate five random training-test splits with our object-level data: one for model parameter selection and four to assess robustness of results. We train various object-level classifiers, using slide-level performance as the optimizing criterion for parameter selection. We then perform systematic ablation studies as summarized in Figure 4. We find that the best performance is achieved when using the whole feature set with an IKSVM: Average Precision of 89.2% ± 2.1% over the four remaining test sets. When relying solely on HOG features, logistic regression and linear SVM methods perform poorly. This is expected because the HOG features are not rotation invariant. [18] also evaluated their algorithm performance at the object-level, but their data and implementation code are not publicly available for direct comparison.
Fig. 4.

Object-level test set AP across different classifiers (logistic regression, linear SVM, and IKSVM) and feature subsets. Two categories of features: Hu moments/photometric/geometric (MPG) and histograms of oriented gradients (HOG).
Slide-Level Evaluation
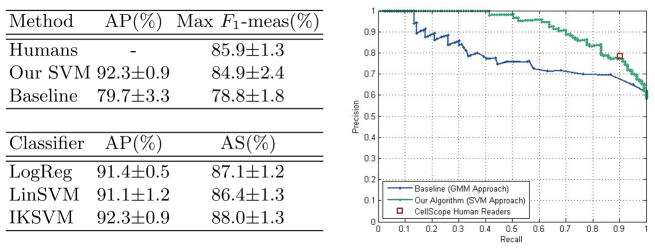
We also consider algorithm performance at the slide level, which is more relevant for practical diagnosis. Because slide-level culture results are available, evaluating our algorithm at the slide level frees us from human-labeled ground truth. To determine slide-level decisions from object-level scores, we refer to how experts manually classify slides. For each slide, we gather the output SVM scores of all the objects and average the top K scores, where K = 3 is chosen via validation experiments. We classify the slide as positive if the averaged score falls above a given threshold. By varying this threshold, we obtain a Recall-Precision curve (see plot in Figure 5). As shown in Figure 5, we consider the three object-level classifiers (logistic regression, linear SVMs, and IKSVMs) in terms of their slide-level performance. We adopt the IKSVM because it achieves slightly better slide-level performance than the other two methods. On the four remaining test sets, the IKSVM achieves slide-level Average Precision of 92.3% ± 0.9% and Average Specificity of 88.0% ± 1.3%.
Fig. 5. Slide-Level Performance.

Left top: Comparison of our IKSVM-based algorithm’s performance to that of humans and the baseline method (GMM approach). Average Precision (AP) and maximum F1-measure across four test sets. Right: Slide-level Recall-Precision curves across different methods for one test set. Left bottom: Our algorithm’s slide-level performance for different object-level classifiers. Average Precision (AP) and Average Specificity (AS), where we average over four test sets.
Slide-Level Comparison with Baseline and Human Readers
We compare our algorithm’s slide-level performance to that of human readers and Forero’s GMM-based approach [9]. We train Forero’s algorithm using our data, where color filtering is reduced to intensity filtering because CellScope images are monochromatic. The GMM method achieves Average Precision of 79.7%±3.3% and maximum F1-measure of 78.8%±1.8% (see Figure 5). Human readers also inspected the same CellScope images and classified each slide, resulting in an F1-measure of 85.9%±1.3% across the four test sets. The plot in Figure 5 shows Recall/Precision curves across different methods for a sample training-test split. For that split, we see that our algorithm’s slide-level performance is comparable to that of human readers and achieves a higher fraction of true positives than the GMM approach for most Recall values.
4 Summary and Conclusions
We propose an accurate and robust automated TB detection algorithm for low-cost, portable digital microscopes such as the CellScope. Applying modern computer vision techniques to images from mobile microscopes could save lives in low-resource communities burdened by TB and suffering poor access to high-quality TB diagnostics. The sputum smears used in our study were collected in Uganda and provide a realistic dataset for algorithm training and evaluation. Our algorithm first identifies potential TB-objects and characterizes each candidate object using Hu moments, geometric and photometric features, and histograms of oriented gradients. We then classify each of the candidate objects using an IKSVM, achieving Average Precision of 89.2% ± 2.1% for object classification. At the slide level, our algorithm performs as well as human readers, showing promise for making a tremendous impact on global TB healthcare. We will release our dataset, annotations, and code, which we hope will provide helpful insights for future approaches to quantitative TB diagnosis.
Acknowledgments
We would like to thank our collaborators at the Mulago Hospital of Kampala, Uganda, who provided the sputum smears used in this study.
References
- 1.Boehme CC, Nabeta P, Hillemann D, Nicol MP, Shenai S, Krapp F, Allen J, Tahirli R, Blakemore R, Rustomjee R, Milovic A, Jones M, O’Brien SM, Persing DH, Ruesch-Gerdes S, Gotuzzo E, Rodrigues C, Alland D, Perkins MD. Rapid Molecular Detection of Tuberculosis and Rifampin Resistance. New England J of Med. 2010;363(11):1005–1015. doi: 10.1056/NEJMoa0907847. [DOI] [PMC free article] [PubMed] [Google Scholar]
- 2.Breslauer DN, Maamari RN, Switz NA, Lam WA, Fletcher DA. Mobile Phone Based Clinical Microscopy for Global Health Applications. PLoS One. 2009;4(7):e6320. doi: 10.1371/journal.pone.0006320. [DOI] [PMC free article] [PubMed] [Google Scholar]
- 3.Cattamanchi A, Davis JL, Worodria W, den Boon S, Yoo S, Matovu J, Kiidha J, Nankya F, Kyeyune R, Byanyima P, Andama A, Joloba M, Osmond DH, Hopewell PC, Huang L. Sensitivity and Specificity of Fluorescence Microscopy for Diagnosing Pulmonary Tuberculosis in a High HIV Prevalence Setting. Int J Tuberc Lung Dis. 2010;13(9):1130–1136. [PMC free article] [PubMed] [Google Scholar]
- 4.Dalal N, Triggs B. Histograms of Oriented Gradients for Human Detection. CVPR. 2005:886–893. [Google Scholar]
- 5.Chang CC, Lin CJ. LIBSVM: A Library for Support Vector Machines. ACM Trans on Intell Sys and Tech. 2011;2(3):27:1–27:27. [Google Scholar]
- 6.Cortes C, Vapnik V. Support-vector networks. Mach Learn. 1995;20(3):273–297. [Google Scholar]
- 7.Costa MG, Costa Filho CF, Sena JF, Salem J, de Lima MO. Automatic Identification of Mycobacterium Tuberculosis with Conventional Light Microscopy. 30th Ann. Int. IEEE EMBS Conf; 2008. pp. 382–385. [DOI] [PubMed] [Google Scholar]
- 8.Evans CA. GeneXpert-A Game-Changer for Tuberculosis Control? PLoS Med. 2011;8:e1001064. doi: 10.1371/journal.pmed.1001064. [DOI] [PMC free article] [PubMed] [Google Scholar]
- 9.Forero MG, Cristóbal G, Desco M. Automatic Identification of Mycobacterium Tuberculosis by Gaussian Mixture Models. J of Microscopy. 2006;223(2):120–132. doi: 10.1111/j.1365-2818.2006.01610.x. [DOI] [PubMed] [Google Scholar]
- 10.Global Tuberculosis Control: WHO Report 2011. 2011 http://www.who.int/tb/publications/global_report/
- 11.Hu MK. Visual Pattern Recognition by Moment Invariants. IRE Trans on Info Theory. 1962;8(2):179–187. [Google Scholar]
- 12.Khutlang R, Krishnan S, Dendere R, Whitelaw A, Veropoulos K, Learmonth G, Douglas TS. Classification of Mycobacterium Tuberculosis in Images of ZN-Stained Sputum Smears. IEEE Trans on Info Tech in Biomed. 2010;14(4):949–957. doi: 10.1109/TITB.2009.2028339. [DOI] [PMC free article] [PubMed] [Google Scholar]
- 13.Kivihya-Ndugga LEA, van Cleeff MRA, Githui WA, Nganga LW, Kibuga DK, Odhiambo JA, Klatser PR. A Comprehensive Comparison of Ziehl-Neelsen and Fluorescence Microscopy for the Diagnosis of Tuberculosis in a Resource-Poor Urban Setting. Int J Tuberc Lung Dis. 2003;7(12):1163–1171. [PubMed] [Google Scholar]
- 14.Kubica GP. Mycobacterium Tuberculosis Bacteria Using Acid-Fast Ziehl-Neelsen Stain; magnified 1000x. Public Health Image Library, Centers for Disease Control and Prevention; Atlanta: 1979. [Google Scholar]
- 15.Otsu N. A Threshold Selection Method from Gray-Level Histograms. IEEE Trans on Systems, Man and Cybernetics. 1979;9(1):62–66. [Google Scholar]
- 16.Platt JC. Probabilistic Outputs for Support Vector Machines and Comparisons to Regularized Likelihood Methods. Advances in Large Margin Classifiers. 1999:61–74. [Google Scholar]
- 17.Fan RE, Chang KW, Hsieh CJ, Wang XR, Lin CJ. LIBLINEAR: A Library for Large Linear Classification. JMLR. 2008;9:1871–1874. [Google Scholar]
- 18.Veropoulos K. Machine learning approaches to medical decision making. U of Bristol; 2001. [Google Scholar]


