Abstract
Fatty liver is an early stage of alcoholic and nonalcoholic liver disease (ALD and NALD) that progresses to steatohepatitis and other irreversible conditions. In this study, we identified proteins that were differentially expressed in the livers of rats fed 5% ethanol in a Lieber-DeCarli diet daily for 1 and 3 months by discovery proteomics (two-dimensional gel electrophoresis and mass spectrometry) and non-parametric modeling (Multivariate Adaptive Regression Splines). Hepatic fatty infiltration was significantly higher in ethanol-fed animals as compared to controls, and more pronounced at 3 months of ethanol feeding. Discovery proteomics identified changes in the expression of proteins involved in alcohol, lipid, and amino acid metabolism after ethanol feeding. At 1 and 3 months, 12 and 15 different proteins were differentially expressed. Of the identified proteins, down regulation of alcohol dehydrogenase (−1.6) at 1 month and up regulation of aldehyde dehydrogenase (2.1) at 3 months could be a protective/adaptive mechanism against ethanol toxicity. In addition, betaine-homocysteine S-methyltransferase 2 a protein responsible for methionine metabolism and previously implicated in fatty liver development was significantly up regulated (1.4) at ethanol-induced fatty liver stage (1 month) while peroxiredoxin-1 was down regulated (−1.5) at late fatty liver stage (3 months). Nonparametric analysis of the protein spots yielded fewer proteins and narrowed the list of possible markers and identified D-dopachrome tautomerase (−1.7, at 3 months) as a possible marker for ethanol-induced early steatohepatitis. The observed differential regulation of proteins have potential to serve as biomarker signature for the detection of steatosis and its progression to steatohepatitis once validated in plasma/serum.
Keywords: Steatosis, steatohepatitis, alcoholic liver disease, proteomics, multivariate regression adaptive splines, two dimensional gel electrophoresis
Introduction
The progression from fat accumulation (steatosis) in the liver after alcohol abuse, to an inflamed state (steatohepatitis) is critical for the development of fibrosis, cirrhosis, and hepatocellular carcinoma (Berghem et al., 2005; Miranda-Mendez et al., 2010). Liver is the main organ that metabolizes ethanol, and there have been many attempts to define biomarkers for the development of fatty liver (Banerjee et al., 2008; Fernando et al., 2010; Freeman et al., 2010; Freeman and Varna, 2010; Newton et al., 2009). Fatty liver is the most common and the earliest response of the liver to alcohol abuse as well as in nonalcoholic fatty liver disease (NAFLD). Both alcoholic liver disease (ALD) and NAFLD share similarities that may follow a two hit mechanism and a similar course of progression (Day and James, 1998). However, early detection and the ability to distinguish between etiology and different stages of the disease are important for therapeutic intervention and/or management.
Based upon bioassays and advanced techniques, such as lipidomics and proteomics, several biomarkers have been proposed to define the fatty liver stage (Fernando et al., 2010; 2011; 2012; Freeman et al., 2010; Haber et al., 2002; Helander, 2003; Newton et al., 2009). Proteomics is a powerful tool for identifying the changes in protein expression, regulation, and function. Alcohol and/or its metabolites affect the expression, activity, stability, structure, and localization of some proteins, and may modify their interaction with other molecules (Neuhold et al., 2004). These changes in proteins are of interest as they may play an important role in determining the physiological responses to pathologic conditions due to alcohol abuse. Proteomics approaches have been used to identify markers for several diseases (Calligaris et al., 2011) such as Alzheimer’s disease (Galasko, 2005), lung carcinogenesis (Gomperts et al., 2011), leukemia (Kanaujiya et al., 2011), asthma, and chronic obstructive pulmonary disease (Verrills at al., 2011). Identification of such biomarkers has been attempted for ALD (Newton et al., 2009; Witzmann and Strother, 2004) and NAFLD (Bell et al., 2010; Pais et al., 2011; Rodriguez-Suarez et al., 2010; Younossi et al., 2005).
Protein expression may vary at different stages of disease due to endogenous protective/adaptive responses. The identification, characterization, and functional alterations in these proteins will have a significant impact in the establishment of candidate biomarkers for an early detection and progression of the disease. It is possible that multiple proteins (protein signature), rather than a single protein, can be identified that reflect the initial disease state and its progression to a terminal stage. Alcoholic steatosis and alcoholic steatohepatitis can be modeled in rats by a high fat diet with ethanol (Lieber and DeCarli, 1989). Using a Lieber-DeCarli diet model, protein markers were detected much earlier than the histopathological markers (Newton et al., 2009). Previously, decreased serum transferrin (Teli et al., 1995), increased ethyl glucuronide (Wurst et al., 2000), and betaine-homocysteine S-methyltransferase (BMHT) (Newton et al., 2009) have been proposed for detection of alcoholic steatosis. Down regulation of carbamoyl phosphate synthase 1 (CSP 1), 78 kDa glucose regulated protein (GRP 78/HSPA5), and acyl-CoA dehydrogenase, and up regulation of serum albumin have been reported in nonalcoholic steatohepatits (Rodriguez-Suarez et al., 2010). Nonalcoholic steatosis causes slight decreases in serum CSP 1 and GRP 78, while in nonalcoholic steatohepatits such changes were more significant. However, none of these proteins allow discrimination of the different stages of ALD. Furthermore, one of the most common problems involved in establishing protein biomarkers has been the lack of consistency among various studies (Zhihua et al., 2011).
In our previous work using lipidomics, we identified differentially regulated liver lipids in rats fed 5% ethanol in Lieber-DeCarli liquid diet for 1–3 months (Fernando et al., 2010; 2011). Herein, we used discovery proteomics and multivariate regression adaptive splines (MARS) modeling to distinguish the differentially expressed proteins responsible for the altered liver lipid metabolome resulting from ethanol exposure with a high fat content (35%) (Lieber and DeCarli, 1989), and to determine the mechanism leading to steatosis/steatohepatitis with or without ethanol. Statistical analysis of our proteomic data shows the changes in the expression of proteins involved in alcohol, lipid, and amino acid metabolism. Differential expression of proteins observed in serum/plasma at 1 and 3 months of ethanol exposure and a high fat diet for 3 months have potential to serve as biomarkers reflecting different stages of ALD.
Materials and Methods
Animals, treatment, and histopathology
Male Fischer 344 rats (~ 6 weeks old) purchased from Harlan (Indianapolis, IN) were housed in a humidity- and temperature-controlled animal room with automatic 12h light/dark cycles. After one week, animals were housed individually in cages and provided with regular Lieber-DeCarli liquid diet (Lieber and DeCarli, 1989) (Dyets Inc., Bethlehem, PA). Animal studies were approved by the University of Texas Medical Branch at Galveston Institutional animal care and use committee. Liquid diets containing ethanol or equivalent calories substituted by maltose-dextrin were prepared according to the manufacture’s instructions. The concentration of ethanol was gradually increased from 1% to 5% and then maintained at 5% for 3 months. The preparation of the diet and data collection of the animals was performed as described previously (Fernando et al., 2010; 2011). Animals from the control and ethanol-fed group were euthanized at the end of 1 and 3 months by administration of an intraperitonial injection of Nembutal (Fernando et al., 2010; 2011). Livers were excised, blotted, and weighed, and either fixed for histopathological studies, or stored at −80°C and used as needed. Hematoxylin and eosin (H&E), 4-hydroxynonenal (4-HNE) protein adducts, and CD3 staining was performed to examine the histopathological changes as described previously (Fernando et al., 2010; 2011).
Two dimensional gel electrophoresis (2DE)
Sample preparation
Frozen liver tissue samples (75 mg, in triplicate for each animal and three animals from each control and ethanol-fed group at each time point) were homogenized in 500 µl DeStreak rehydration buffer (GE Healthcare Lifesciences, Pittsburg, PA) with protease inhibitor cocktail (Sigma-Aldrich, Milwaukee, WI). Following homogenization, benzonase (Sigma-Aldrich, Milwaukee, WI) was added to the homogenates and the mixture incubated at room temperature for 1 h. The homogenates were centrifuged at 13,000 g for 15 minutes at 25° C. The resulting supernatant was collected and the protein concentrations were estimated using the reducing agent and detergent compatible (RCDC) protein assay kit (BioRad, Hercules, CA) and the samples were stored at −80° C until further analysis.
Electrophoresis
To ensure the reproducibility and prevent experimental variations in the 2D gels, all 2D gels were carried out under the same experimental conditions. Samples were run in triplicate gels (for statistical significance) with three liver samples (biological replicates) for each of two time points: 1 month control and ethanol-fed and 3 month control and ethanol-fed. All protein samples were adjusted to 1 µg/µl with DeStreak rehydration buffer. Isoelectric focusing (IEF) of the samples was performed with 11-cm precast immobilized pH gradient (IPG) strips of pH 3 to 10. Two hundred microliters of 1 µg/µl protein samples were loaded onto an IPG strip and rehydrated overnight. IEF was performed at 20° C with the following parameters: 50V for 11 h, 250 V for 1 h, 500 V for 1 h, 1,000 V for 1 h, 8000 V for 2 h, and 8000 V for 6 h, for a total 48,000 V hrs. After IEF, the IPG strips were stored at −80° C until 2D SDS-PAGE was performed. For the 2D SDS-PAGE, the IPG strips were incubated in 4 ml of equilibration buffer (6M urea, 2% SDS, 50 mM Tris-HCl (pH 8.8), 20% glycerol) containing 10 µl of 0.5 M tris(2-carboxyethyl)phosphine (TCEP) for 15 minutes at 22°C with shaking. The strips were then incubated in another 4 ml of equilibration buffer with 25 mg/ml of iodoacetamide for 15 min at 22° C with shaking. Electrophoresis was performed at 150 V for 2.25 h at 4° C with 8 to 16% precast polyacrylamide gels in Tris-glycine buffer [25 mM Tris-HCl, 192 mM glycine, 0.1% SDS (pH 8.3)].
Fluorescent staining, imaging, and gel analysis
After 2DE, gels were fixed, stained with Sypro Ruby (Invitrogen, Carlsbad, CA), and destained essentially according to the manufacture’s recommendations. Briefly, gels were fixed in 10% methanol, 7% acetic acid in double distilled water for 2 h at room temperature (RT). Subsequently, the Sypro Ruby stain was applied overnight at RT followed by destaining in 10% ethanol for 1 h. Sypro stained gels were imaged at 100 µm resolution with ProExpress 2D Proteomic Imaging System (PerkinElmer Life and Analytical Sciences, Waltham, MA) at 480 nm excitation and 620 nm emission filters. The exposure time was adjusted to achieve a value of 55,000 to 63,000-pixel intensity (maximum saturation) on the most intense protein spots on the gels. The 2D gel images were subsequently analyzed using Progenesis SameSpots software version 4.0 (Nonlinear Dynamics, Ltd., Newcastle Upon Tyne, UK). The program read all images into an “experiment” and performed quality control tests. One of the images was then selected as the reference gel, which has two purposes: to align all other gels to it, and as the reference for spot volume (intensity) normalization. SameSpots performed alignment with the help of user-drawn and automatically added vectors connecting pixels on each image to the corresponding pixels on the reference image. Spots were then detected based on the aligned set of gels, and the background calculated and subtracted from raw spot volumes. Spot volumes were normalized to those of the reference gel by calculating a “bias factor” reflecting the assumption that most protein expressions do not change. The bias factor is then applied to all proteins across all the samples to normalize to an average expression of 1.0 as described by Nonlinear Dynamics (http://www.nonlinear.com). Protein expression was compared by grouping the samples into four comparison sets: 1 month control vs. 1 month ethanol-fed, 3 month control vs. 3 month ethanol-fed, 1 month control vs. 3 month control, and 1 month ethanol-fed vs. 3 month ethanol-fed with each group representing 18 gels. In the above comparisons, fold-changes (expression ratios) are calculated from normalized spot volumes averages and p-values by ANOVA from log-transformed normalized volumes. Fold-changes ≥ |1.5| and p ≤ 0.05 of log normalized spot volumes were considered to indicate significant differential expression.
Mass spectrometry, and protein identification
Differentially expressed protein gel spots were excised and prepared for matrix-assisted laser desorption ionization-time of flight (MALDI-TOF/TOF) mass spectrometry analysis using DigiLab’s (Holliston, MO) ProPic I robotic instrument by following the manufacture’s protocol. Gel plugs were incubated with trypsin (20 µg/ml in 25 mM ammonium bicarbonate, pH 8.0) (Promega Corp., Madison, WI) at 37° C for 24 h. MALDI-TOF/TOF was performed using an Applied Biosystems 4700 for peptide mass fingerprinting and sequencing. Protein identification was performed by recording both MS and MS/MS data and using these to search the NCBI rat database with MASCOT (Matrix Science, London, UK). The searches used a Bayesian algorithm (Zhang and Chait, 2000) in which high probability matches were indicated by a high protein score (see www.matrixscience.com) and a low “expectation score” (E) calculated from it. E is an estimate of the number of matches that would be expected in the searched database if the matches were completely random – hence, the lower the E-value, the higher the probability of the identification being valid. We used a threshold of E ≤ 10−3 for a confident identification.
Statistical analyses: Clustering, Biological network analysis and nonparametric modeling by Multivariate Adaptive Regression Splines (MARS) Modeling
Hierarchical clustering and principal component analysis of the different experimental groups (1 month control vs. 1 month ethanol-fed, 3 months control vs. 3 months ethanol-fed, 1 month control vs. 3 months control, and 1 month ethanol-fed vs. 3 months ethanol-fed) were performed using Spotfire Decision Site 9.0 software (TIBCo Spotfire, Somerville, MA). Herein, the normalized volumes of the spots with a fold change ≥ |1.5| and p ≤ 0.05 and E ≤ 10−3 were used in the cluster analysis. Biological networks were derived by pathway analysis using the Ingenuity Pathway Analysis (IPA) program (Ingenuity systems, Redwood City, CA). Significant proteins identified in each comparison were uploaded as input to IPA using SwissPROT accession codes as identifiers.
We used the program Multivariate Adaptive Regression Splines (MARS; Salford Systems Inc., San Diego, CA) to: (1) reduce large input data sets to a small number of potential biomarkers (“feature reduction”) to discriminate the effect of alcohol on proteomic expression from that of an alcohol-free diet, and (2) rank the predictor variables in the order of importance to the model. Our implementation of the program is as a module in Salford Predictive Mining suite (SPM 6.8). MARS is an automated, nonparametric regression modeling tool capable of discovering complex patterns and inter-variable interactions that exist in high dimensional data such as proteomic data that are otherwise difficult to discover (Friedman, 1991; MARS user Manual, 2001). Also, a nonparametric method such as MARS is appropriate for proteomic data which are not normally distributed and included outliers. MARS’s regression model is built on transformed predictor variables (called basis functions). In the first stage, it generates models by fitting and combining piecewise linear regressions with distinct slopes in different parts of the predictor variable space until the specified number of basis functions are reached. In the second stage, basis functions are removed progressively to determine their contribution to the model until an optimal model is obtained. Cross validation is used to minimize overfitting. MARS then ranks the variables in the final model as follows: it drops a variable, refits the model, and calculates the reduction in the goodness of fit; this is repeated for each variable in the model. The raw predictor variables in our case are log2-transformed spot normalized volumes, and the target variable is the effect of ethanol. MARS has been used by us recently to aid in the development of biomarkers for Dengue hemorrhagic fever (Brasier et al., 2012).
Western Blotting
Homogenates of frozen liver were prepared by homogenizing in cold RIPA buffer containing protease inhibitors (Boston Bio Products, MA). Proteins in the supernatants were resolved on NUPAGE Novax 4–12% Bis-Tris gels (Invitrogen), and transferred onto nitrocellulose membranes. The membranes were blocked with 5% milk and incubated with primary antibodies against ALDH2 (# ab108306 from abcam, Cambridge, MA), CPS1 (E-30) (# SC-10516 from Santa Cruz Biotechnology, Santa Cruz, CA), ADH (# 2980-1 from EPITOMICS Inc, Burlingame, CA) and ACSL1 (# NB110-99585 from NOVUS Biologicals, Littleton, CO) overnight at 4° C followed by secondary antibody for 1 h at RT. Beta actin (# ab 8227, abcam) antibody was used as internal standards (loading controls). Results were quantified by Quantity One 1D analysis software (Bio Rad, Hercules, CA) and were expressed as a fold-change of the control group, after normalizing against respective β-actin.
Results
Liver Histology and Immunohistochemistry
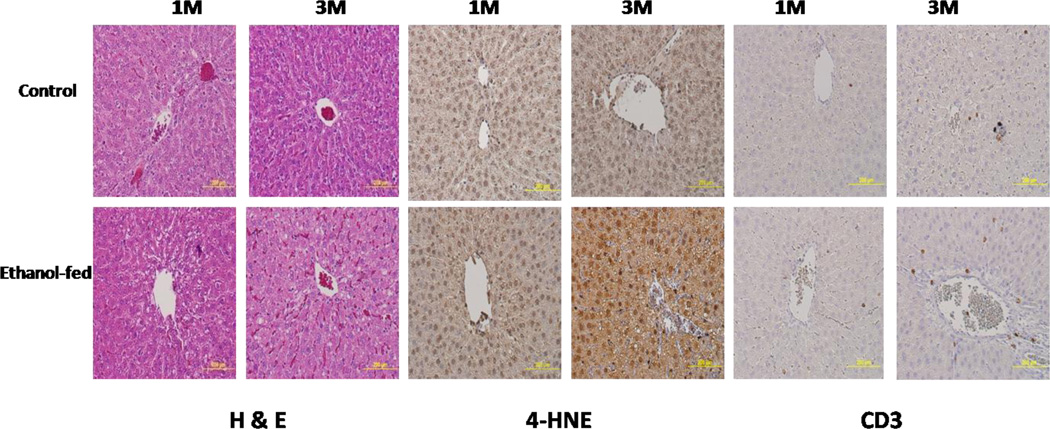
H&E staining, 4-HNE, and CD3 immunostaining of the liver sections of control and ethanol-fed animals at 1 and 3 months are shown in Fig. 1. H&E staining showed significant vacuolation with lipid-filled vesicles in 1 month ethanol-fed animals as compared to the controls, and more fat deposition in the 3 month ethanol-fed animals than in 1 month ethanol-fed animals. The samples were blinded and examined for altered histopathology. Fatty infiltration observed was localized in pericentral region around central vein). As compared to their corresponding controls, the liver sections of 3 month ethanol-fed animals displayed increased immunostaining with (a) anti-protein-4HNE antibodies depicting ethanol induced mild oxidative stress and (b) anti-CD3 antibodies, an inflammatory cell marker. However, there were no significant differences in the 1 month ethanol-fed vs. controls.
Fig. 1.
Histology and immunohistochemistry of representative liver sections of rats fed 5% ethanol in liquid diet daily for 1 month (1M) and 3 months (3M). H&E stained representative liver sections from the controls and ethanol-fed animals show significant fatty deposition, and the immunostaining for 4-HNE and CD3 in controls and ethanol-fed animals for 1 and 3 months show mild oxidative stress and inflammation.
Differentially expressed proteins
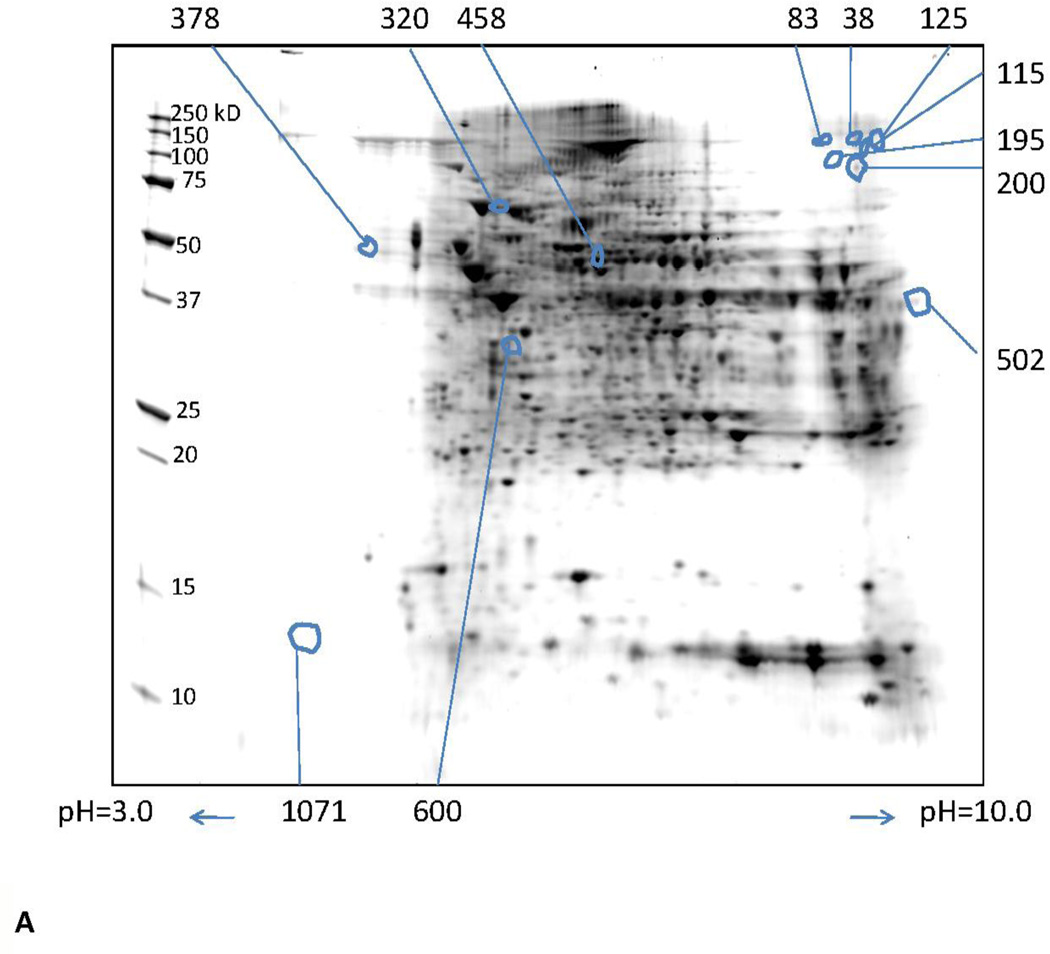
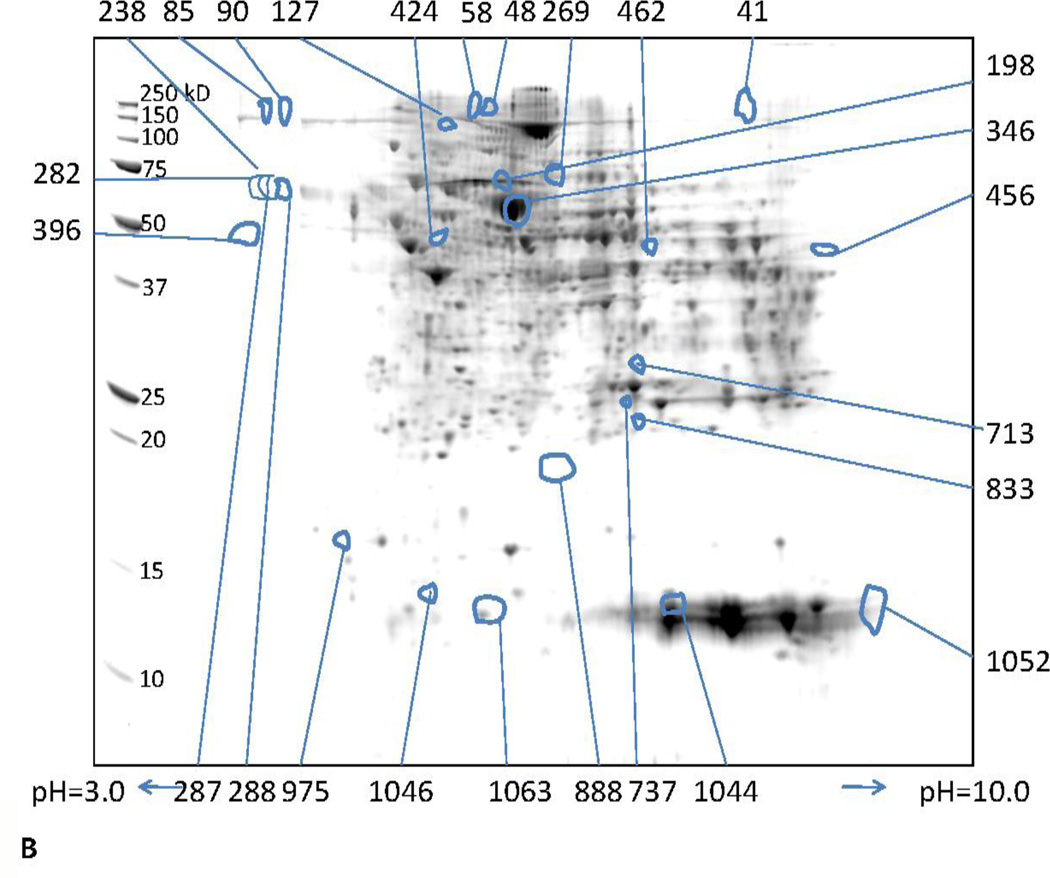
Isolation and quantification of differentially expressed proteins at 1 and 3 months was performed by 2DE. Representative gel images obtained at 1 and 3 months are shown in Fig. 2. A total of 1134 protein spots were detected in the pH range of 3–10 and molecular weight range of 10–250 kDa using the SameSpots image analysis software. One hundred forty five spots with a fold-change of |1.5| and greater and a p value ≤ 0.05 were considered differentially expressed.
Fig. 2.
Representative 2D gels showing proteins identified by MALDI-TOF/TOF. These proteins showed a 1.5 fold or greater difference between ethanol-fed and control (p ≤ 0.05) at (A) 1 and (B) 3 months. The numbers in the figure are the spot identifiers given by the software.
Identification of the differentially expressed proteins at 1 month (early fatty liver stage)
Twelve spots representing 12 different proteins were significantly different in ethanol-fed animals vs. controls (Supplementary Table 1). All the identified proteins represent a single isoform. Of the 12 spots, 10 proteins were down-regulated. Beta enolase and calsequestrin were up-regulated. Even though betaine-homocysteine S-methyltransferase 2 (methionine metabolism) and myoglobin (apoptosis) were also up-regulated significantly (p =0.002 and 0.009), but only with a fold change of 1.4 and, therefore, are not listed in the table. In addition, aldehyde dehydrogenase (involved in ethanol metabolism) and cytochrome b5 type A (involved in apoptosis) also showed an upward trend with a fold change of 1.4 but were not statistically significant (p=0.744 and 0.068, respectively). Two down-regulated proteins that were statistically significant, alcohol dehydrogenase—responsible for ethanol oxidation to acetaldehyde—and carbamoyl phosphate synthase—responsible for regulating triacylglycerol, fatty acid, and phospholipid binding (lipid metabolism). Surprisingly, no spots corresponding to the peroxiredoxin family (responsible for oxidative stress) were differentially expressed at ethanol exposure of 1 month.
Identification of the differentially expressed proteins at 3 months (late fatty liver stage)
Twenty-six spots representing 15 different proteins were differentially expressed in the 3 month ethanol-fed animals vs. pair-fed controls (Table 1). Some proteins appeared as multiple spots suggesting post-translational modifications (PTMs). Carbamoyl phosphate synthase appeared at five spots, hemoglobin and D-dopachrome tautomerase at two spots, and serum albumin at six spots. Of the total proteins that were differentially expressed, ten were up-regulated and five were down-regulated (Table 1).
Table 1.
Differentially expressed proteins in ethanol-fed rat livers vs. control livers at 3 months
| Spot # | Protein | Symbol | Accession number | M.Wt. (exp) | pI (exp) | Protein Score | Expectation score | Fold Change | Sequence coverage% | Peptide count | Function |
|---|---|---|---|---|---|---|---|---|---|---|---|
| 85 | carbamoyl phosphate synthase | CPS1 | gi|8393186 | 148000 | 3.72 | 510 | 6.29E -47 | 1.9 | 23 | 32 | metabolism- ATP binding, anion homeostasis, carbamoyl-phosphate synthase (ammonia) activity, phospholipid and, protein complex binding |
| 48 | 243750 | 6.12 | 393 | 3.15E-25 | 1.8 | 15 | 23 | ||||
| 127 | 116000 | 5.97 | 625 | 1.99E-58 | 1.5 | 28 | 34 | ||||
| 90 | 146000 | 3.86 | 169 | 7.92E-13 | 1.9 | 11 | 17 | ||||
| 58 | 225000 | 6.06 | 276 | 5.0E-24 | 1.6 | 13 | 19 | ||||
| 396 | aldehyde dehydrogenase | ALDH2 | gi|25990263 | 49391 | 3.74 | 181 | 5.00 E-14 | 2.1 | 19 | 8 | oxidation, apoptosis, alcohol and carbohydrate metabolism |
| 833 | myoglobin | MB | gi|11024650 | 20849 | 7.28 | 152 | 3.97 E-11 | 1.7 | 20 | 3 | differentiation, apoptosis, oxygen transport, heme, metal binding |
| 269 | long-chain-fatty-acid-CoA ligase 1 | ACSL1 | gi|25742739 | 68939 | 6.75 | 272 | 3.97 E-23 | 1.5 | 23 | 15 | fatty acid metabolism and lipid metabolism |
| 713 | keratin, type I cytoskeletal 10 | KRT10 | gi|57012436 | 26869 | 7.26 | 165 | 1.99 E-12 | 1.5 | 9 | 5 | protein binding, epidermis metabolism |
| 737 | carbonic anhydrase I | CA1 | gi|157817869 | 25590 | 7.16 | 279 | 7.92 E-24 | 1.5 | 24 | 6 | one carbon metabolic process, carbonate dehydratase activity |
| 1044 | rat Hemoglobin | gi|242556327 | 13167 | 7.61 | 376 | 1.58 E-33 | 1.8 | 62 | 8 | oxygen transport and binding, cell differentiation, apoptosis | |
| 424 | 47359 | 5.35 | 249 | 7.92 E-21 | 1.5 | 41 | 5 | ||||
| 1052 | rat Hemoglobin | LOC | gi|164448680 | 12417 | 9.43 | 331 | 5.00 E-29 | 2.0 | 42 | 5 | oxygen transport and binding, cell differentiation, apoptosis |
| 100134871 | |||||||||||
| 1063 | D-dopachrome tautomerase | DDT | gi|149043740 | 12000 | 6.45 | 160 | 6.29 E-12 | −1.7 | 47 | 5 | melanin biosynthetic process |
| 1046 | 13042 | 5.47 | 151 | 5.00E-11 | −1.5 | 40 | 4 | ||||
| 888 | peroxiredoxin-1 | PRDX1 | gi|16923958 | 18217 | 6.45 | 117 | 1.26 E-07 | −1.5 | 14 | 3 | hydrogen peroxide catabolic process, apoptosis, response to reactive oxygen |
| 41 | cystathionine gammalyase | CTH | gi|8393215 | 8.26 | 199 | 7.92 E-16 | −1.6 | 26 | 8 | glutathione metabolic process | |
| 462 | glutamate dehydrogenase 1 | GLUD1 | gi|6980956 | 43500 | 7.45 | 134 | 2.51 E-09 | 1.6 | 13 | 8 | glutamate biosynthesis, survival, apoptosis |
| 456 | argininosuccinate synthase | ASS1 | gi|25453414 | 43906 | 9.22 | 226 | 1.58 E-18 | −1.5 | 33 | 13 | amino acid biosynthesis, apoptosis, survival, urea cycle |
| 975 | cytochrome b5 type A | CYB5A | gi|11560046 | 15559 | 4.67 | 171 | 1.99 E-12 | −1.5 | 65 | 5 | cell death, apoptosis, transport |
| 287 | serum albumin precursor | ALB | gi|158138568 | 65909 | 3.71 | 461 | 5.00 E-42 | 2.5 | 15 | 8 | apoptosis, cell death, fatty acid, DNA, protein, oxygen binding, transport. |
| 198 | 83594 | 6.14 | 174 | 2.70E-17 | 1.6 | 18 | 10 | ||||
| 238 | 73106 | 3.73 | 209 | 8.60E-17 | 1.8 | 10 | 5 | ||||
| 282 | 67045 | 3.62 | 355 | 2.20E-31 | 2.3 | 13 | 7 | ||||
| 288 | 65909 | 3.88 | 328 | 1.10E-28 | 2.4 | 15 | 8 | ||||
| 346 | 56818 | 6.11 | 653 | 3.40E-61 | 1.5 | 21 | 15 | ||||
Carbamoyl phosphate synthase, long chain fatty acid CoA ligase (fatty acid and lipid metabolism), and aldehyde dehydrogenase responsible for the metabolism of ethanol were up-regulated at 3 months. However, alcohol dehydrogenase, another enzyme involved in ethanol metabolism, showed a downward trend but was not statistically significant (−1.2 fold, p=0.060). Cytochrome b5, involved in the oxidative metabolism of ethanol via cytochrome P450 and peroxiredoxin-1 (hydrogen peroxide catabolic process and apoptosis), was also down-regulated at this time point.
Identification of the differentially expressed proteins in 3 months due to the high fat diet
Twenty five spots representing twenty three proteins were differentially expressed in the control animals between 1 and 3 months and are shown in Table 2. Two proteins in the comparison appeared as multiple spots with differential expression—argininosuccinate synthase in the same upward direction, while catalase appeared in up and down directions suggesting post translational modifications (PTMs).
Table 2.
Differentially expressed proteins in control livers at 3 month vs. 1 month
| Spot # | Protein | Symbol | Accession number | M.Wt. (exp) | pI (exp) | Protein score | Expectation score | Fold Change | Sequence coverage% | Peptide count | Function |
|---|---|---|---|---|---|---|---|---|---|---|---|
| 443 | ATP synthase, H+ transporting, mitochondrial F1 complex, alpha subunit, isoform 1, isoform CRA_d | ATP5A1 | gi|149029483 | 45328 | 7.63 | 158 | 9.98E-12 | 1.5 | 21 | 8 | Lipid metabolism, proton transport |
| 525 | hydroxyacid oxidase 1 | HAO1 | gi|157821243 | 36607 | 7.63 | 317 | 1.26E-27 | 1.5 | 35 | 11 | Fatty acid oxidation, response to oxidative stress |
| 180 | elongation factor 2 | EEF2 | gi|8393296 | 89063 | 6.99 | 155 | 1.99E-11 | 1.6 | 24 | 20 | Translational elongation, nucleotide, GTP, etc. binding |
| 655 | betaine-homocysteine S-methyltransferase 2 | BHMT2 | gi|158081741 | 29721 | 7.26 | 99 | 7.92E-06 | 1.5 | 9 | 4 | Methionine metabolism, transfer of a methyl group to betaine to homocysteine, protein, lipids, etc. |
| 152 | carbamoyl-phosphate synthase | CPS1 | gi|8393186 | 97656 | 5.89 | 668 | 9.98E-63 | −1.7 | 27 | 36 | Regulates triacyl glycerols, glycogen, ATP, PL, FA binding |
| 438 | elongation factor-1 alpha | Eef1a1 | gi|1220484 | 46141 | 9.41 | 223 | 3.15E-18 | 2.7 | 19 | 8 | Translational elongation |
| 387 | formimidoyltransferase-cyclodeaminase | FTCD | gi|16758338 | 50379 | 5.79 | 298 | 9.98E-26 | 1.5 | 31 | 12 | Folic acid binding, histidine, folic acid and derivative metabolic process |
| 467 | argininosuccinate synthase | ASS1 | gi|25453414 | 43094 | 9.38 | 174 | 2.51E-13 | 3.1 | 28 | 11 | Amino acid biosynthesis, apoptosis, survival, urea cycle |
| 449 | 44719 | 9.32 | 174 | 2.50E-13 | 2.0 | 29 | 12 | ||||
| 326 | iodothyronine 5' monodeiodinase | P4HB | gi|202549 | 59848 | 5.13 | 148 | 9.98E-11 | −1.5 | 23 | 10 | Protein binding, isomerase activity |
| 497 | acetyl-Coenzyme A acyltransferase 2 | ACAA2 | gi|149027151 | 38828 | 8.55 | 275 | 1.99E-23 | −1.5 | 46 | 9 | Catalyze fatty acid beet oxidation, cholesterol biosynthesis, lipid, fatty acid metabolic process |
| 392 | aldehyde dehydrogenase | ALDH2 | gi|25990263 | 49594 | 3.45 | 144 | 2.51E-10 | −1.9 | 19 | 8 | Oxidation, apoptosis, alcohol and carbohydrate metabolism |
| 116 | keratin, type II cytoskeletal 75 | KRT75 | gi|166218811 | 130000 | 8.78 | 101 | 5.00E-6 | 1.5 | 19 | 11 | Structural molecule activity |
| 843 | glutathione S-transferase Ya subunit | GSTA5 | gi|204497 | 19965 | 8.96 | 105 | 1.99E-06 | 1.6 | 15 | 3 | Glutathione activity, metabolic process |
| 1002 | glutathione S-transferase Y-b subunit (EC 2.5.1.18) | GSTM1 | gi|204499 | 15000 | 8.23 | 102 | 22042.1 | 3.4 | 27 | 7 | Glutathione activity, metabolic process |
| 494 | aspartate aminotransferase, | GOT2 | gi|6980972 | 39438 | 9.42 | 415 | 1.99E-37 | 3.3 | 31 | 14 | Related to NAFLD and ALD, response to ethanol, fatty acid transport |
| 126 | chain B, Low resolution, molecular envelope structure of type I collagen. | gi|254221096 | 118000 | 9.43 | 274 | 2.51E-23 | 5 | 13 | 10 | Glycoprotein, hydroxylation | |
| 117 | chain A, low resolution, molecular envelope structure of type I collagen | gi|254221095 | 128000 | 8.62 | 319 | 7.92E-28 | −1.6 | 10 | 9 | Glycoprotein, hydroxylation | |
| 400 | 3-hydroxy-3-methylglutaryl-coenzyme A synthase 2 | HMGCS2 | gi|51259246 | 49391 | 9.38 | 77 | 1.26E-03 | 1.6 | 10 | 4 | Cholesterol biosynthesis, regulated by cholesterol |
| 83 | Ldha protein | LDHA | gi|38014570 | 156250 | 8.62 | 111 | 5.00E-07 | −1.5 | 21 | 6 | NAD metabolic process, glycolysis, lactate metabolic process, oxidation reduction, positive regulation of apoptosis |
| 479 | muscle creatine kinase | CKM | gi|6671762 | 40656 | 4.0 | 233 | 3.15E-19 | −1.5 | 28 | 10 | Creatine metabolic process |
| 632 | tropomyosin 1 alpha chain | gi|157787199 | 31295 | 4.98 | 850 | 6.29E-81 | 1.5 | 51 | 20 | Protein binding | |
| 317 | catalase** | CAT | gi|6978607 | 60985 | 9.24 | 198 | 5E-25 | 2.7 | 28 | 13 | Regulate reactive oxygen species |
| 325 | catalase** | CAT | gi|6978607 | 59848 | 3.48 | 108 | 9.98E-7 | −1.7 | 14 | 7 | Regulate reactive oxygen species |
| 281 | serum albumin precursor | ALB | gi|158138568 | 67045 | 3.51 | 103 | 3.15E-06 | −1.8 | 13 | 7 | Transport, binding of DNA, fatty acid etc. |
Proteins that were up-regulated due to the high fat diet included, ATP synthase, hydroxacid oxidase 1, elongation factor 1 and 2, betaine homocysteine S-methyltransferase 2, formimidoyltransferase-cyclodeaminase, arginosuccinate synthase, keratin type II cytoskeletal 75, glutathione S-transferase Y-a and Y-b, aspartate amino transferase, type I collagen (chain B), 3-hydroxy-3-methylglutaryl-Coenzyme A synthase 2, tropomyosin 1, and catalase while down-regulation was observed for carbamoyl phosphate synthase, iodothyronie 5’ monodeiodinase, acetyl-coenzyme A acyltransferase 2, aldehyde dehydrogenase, type I collagen (chain A), lactate dehydrogenase, muscle creatine kinase, catalase, and serum albumin precursor.
Some proteins listed in this table were regulated up or down in the 1 and/or 3 month of ethanol feeding. Aspartate aminotransferase and LDHa proteins were differentially expressed in the 1 month time point while arginosuccinate synthase, aldehyde dehydrogenase and serum albumin were differentially expressed in the 3 month time point. The protein carbamoyl phosphate synthase were differentially expressed in both 1 and 3 month time points. Table 3 summarizes all the proteins that showed a differential change and how these changes are affected by ethanol feeding for each comparison. We identified several proteins that reflect changes due to ethanol-induced fatty liver, diet-induced fatty liver and fatty liver in common either with diet or with ethanol and ethanol-induced late fatty liver stage, which may serve as potential biomarkers.
Table 3.
Comparison of the differentially expressed proteins in all three comparisons
| Protein | Ethanol1M (E/C) | Ethanol 3M (E/C) | Control (3M/1M) |
|---|---|---|---|
| Tifunctional enzyme subunit alpha | −1.7 | NF | NF |
| Heat shock 70kDa protein 5 | −1.7 | NF | NF |
| Peroxisomal multifunctional enzyme type 2 | −1.5 | NF | NF |
| 3-Hydroxyacyl-CoA Dehydrogenase | −1.5 | −1.2 (0.006) | NF |
| Alcohol dehydrogenase | −1.6 | −1.2 (0.06) | NF |
| Carbonic anhydrase I | 1.2 (0.05) | 1.5 | NF |
| Long-chain-fatty-acid-CoA ligase 1 | NF | 1.5 | NF |
| Peroxiredoxin-1 | NF | −1.5 | NF |
| Cytochrome b5 type A | 1.4 (0.07) | −1.5 | NF |
| Ribonuclease UK114 | −2 | NF | −1.2 (0.75) |
| Regucalcin | −1.5 | NF | −1.2 (0.17) |
| Aspartate aminotransferase | −1.5 | NF | 3.3 |
| Hydroxyacid oxidase 1 | NF | NF | 1.5 |
| Elongation factor 2 | NF | NF | 1.6 |
| rCG55067 | NF | NF | 1.6 |
| Formimidoyltransferase-cyclodeaminase | NF | NF | 1.5 |
| 3-hydroxy-3-methylglutaryl-Coenzyme A synthase 2 | NF | 1.2 (0.35) | 1.6 |
| Elongation factor-1 alpha | NF | −1.4 (0.15) | 2.7 |
| Argininosuccinate synthase | NF | −1.5 | 2.0 |
| ATP synthase, H+ transporting, mitochondrial F1 complex, alpha subunit, isoform 1, isoform CRA_d | NF | −1.3 (0.0003) | 1.5 |
| Glutathione S-transferase Ya subunit | NF | −1.3 (0.09) | 1.6 |
| Glutathione S-transferase Y-b subuni | NF | −1.3 (0.13) | 3.4 |
| Keratin, type II cytoskeletal 75 | NF | −1.2 (0.23) | 1.5 |
| Keratin, type I cytoskeletal 10 | NF | 1.5 | 1.3 (0.03) |
| Hemoglobin subunit beta-2 | NF | 2 | 1.4 (0.01) |
| Glutamate dehydrogenase 1 | NF | 1.6 | −1.3 (0.06) |
| Serum albumin precursor | NF | 2.5 | −1.8 |
| Carbamoyl-phosphate synthase | −1.5 | 1.8 | −1.7 |
| Ldha protein | −2 | −1.3 (p=0.06) | −1.5 |
| D-dopachrome tautomerase, isoform CRA_b | −1.2 (0.05) | −1.7 | −1.2 (0.21) |
| Myoglobin | 1.4 (0.01) | 1.7 | 1.2 (0.13) |
| Aldehyde dehydrogenase | 1.4 (0.74) | 2.1 | −1.9 |
| Cystathionine gamma-lyase | −1.2 (0.05) | −1.6 | 1.2 (0.11) |
| Betaine-homocysteine S-methyltransferase 2 | 1.4 (0.004) | 1.2 (0.002) | 1.5 |
| Iodothyronine 5' monodeiodinase | −1.4 (0.01) | 1.3 (0.10) | −1.5 |
| Chain B, Low Resolution, Molecular Envelope Structure Of Type I Collagen. | 1.5 (0.18) | −1.9 (0.36) | 5 |
| Chain A, Low Resolution, Molecular Envelope Structure Of Type I Collagen | −1.4 (0.02) | 1.3 (0.10) | −1.6 |
| Muscle creatine kinase | 1.2 (0.33) | −1.3 (0.69) | −1.5 |
| Tropomyosin 1 alpha chain | 1.2 (0.13) | −1.3 (0.15) | 1.5 |
| Acetyl-Coenzyme A acyltransferase 2 | −1.2 (0.02) | 1.2 (0.08) | −1.5 |
| Catalase | 1.5 (0.91) | −1.5 (0.18) | 2.7 |
| Calsequestrin 1 | 1.8 | 1.6 (0.44) | 1.2 (0.71) |
| Beta-enolase | 1.5 | 1.2 (0.07) | 1.4 (0.01) |
NF-no fractional change in the ratio considered, In the case where multiple spot appeared for the same protein the spot with the highest mascot score is reported. Shaded numbers represent the highest differential change among the comparisons and in parenthesis represent the corresponding p value. 1M and 3M represents one month and three months.
Hierarchical cluster analysis and principal component analysis (PCA)
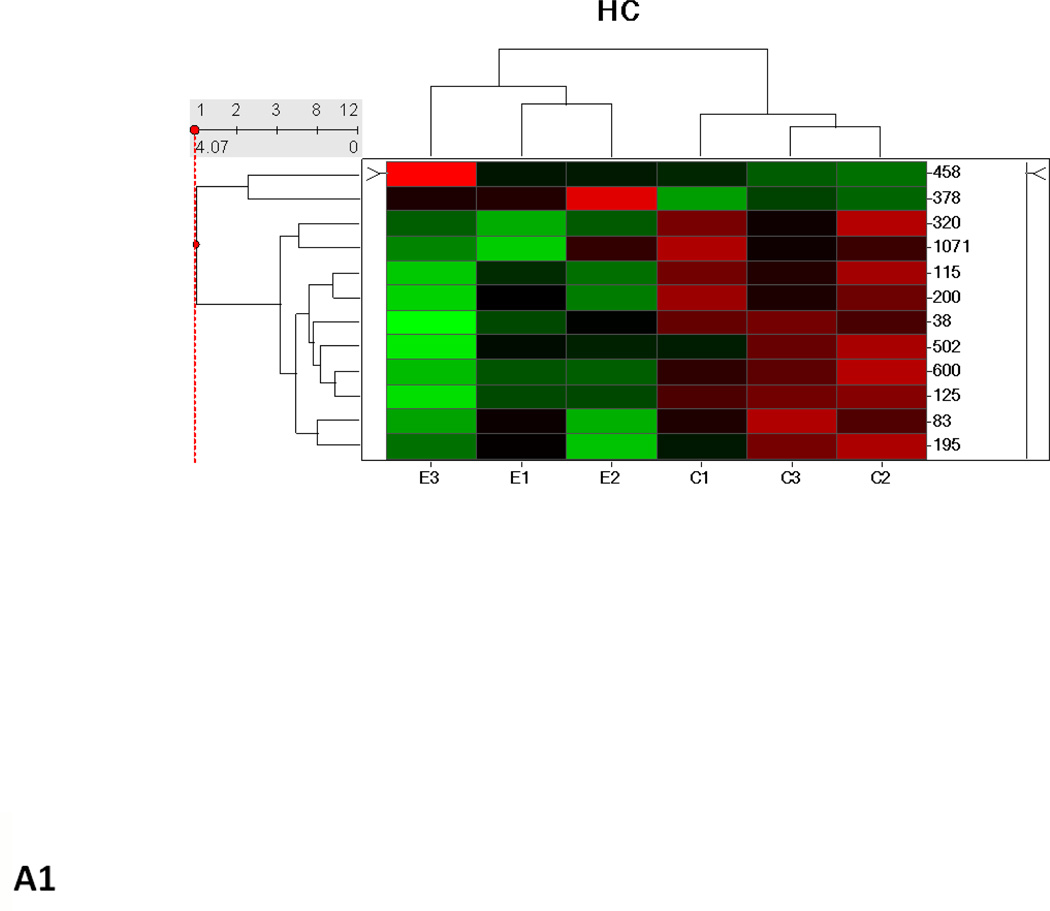
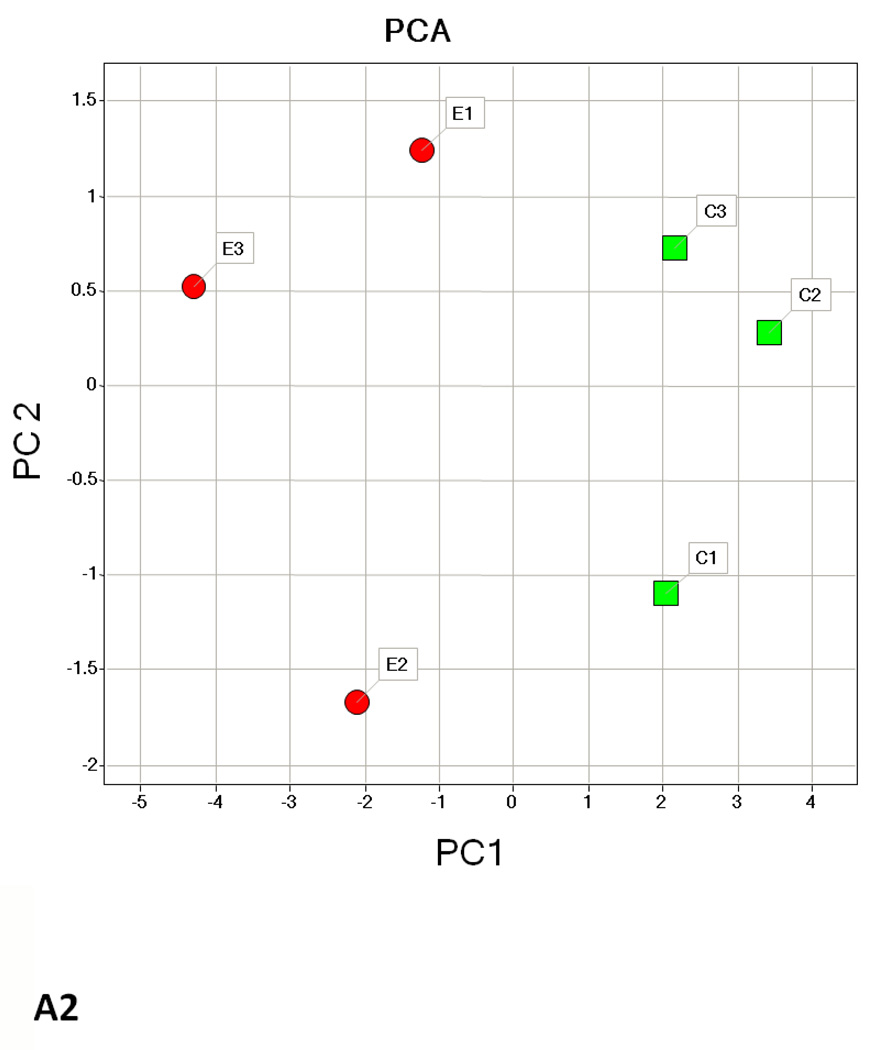
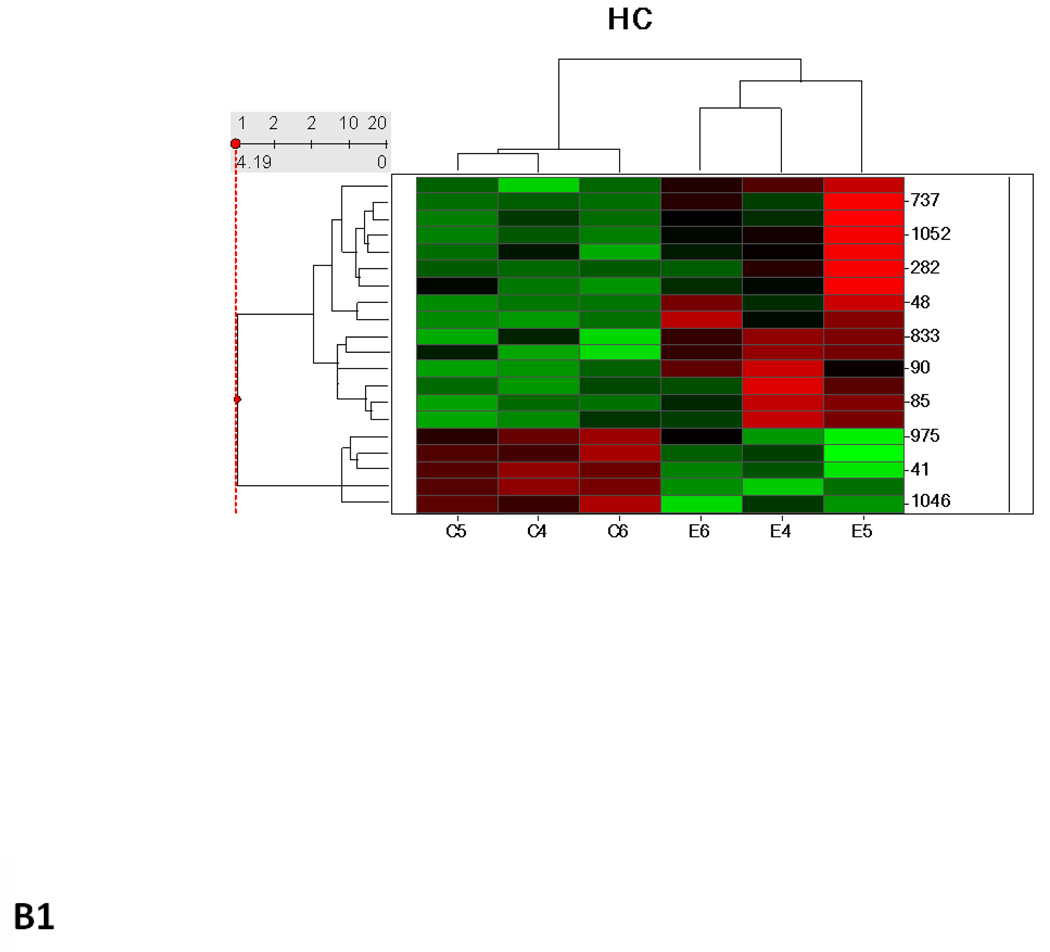
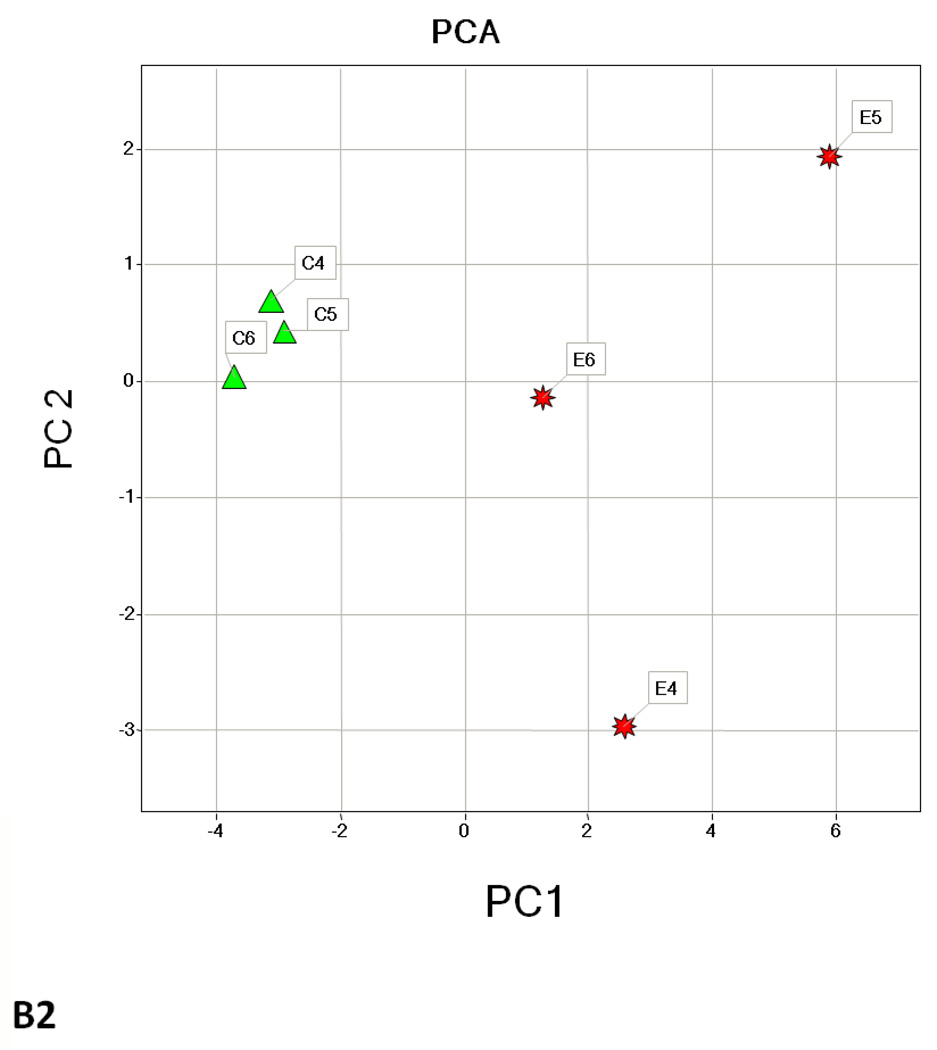
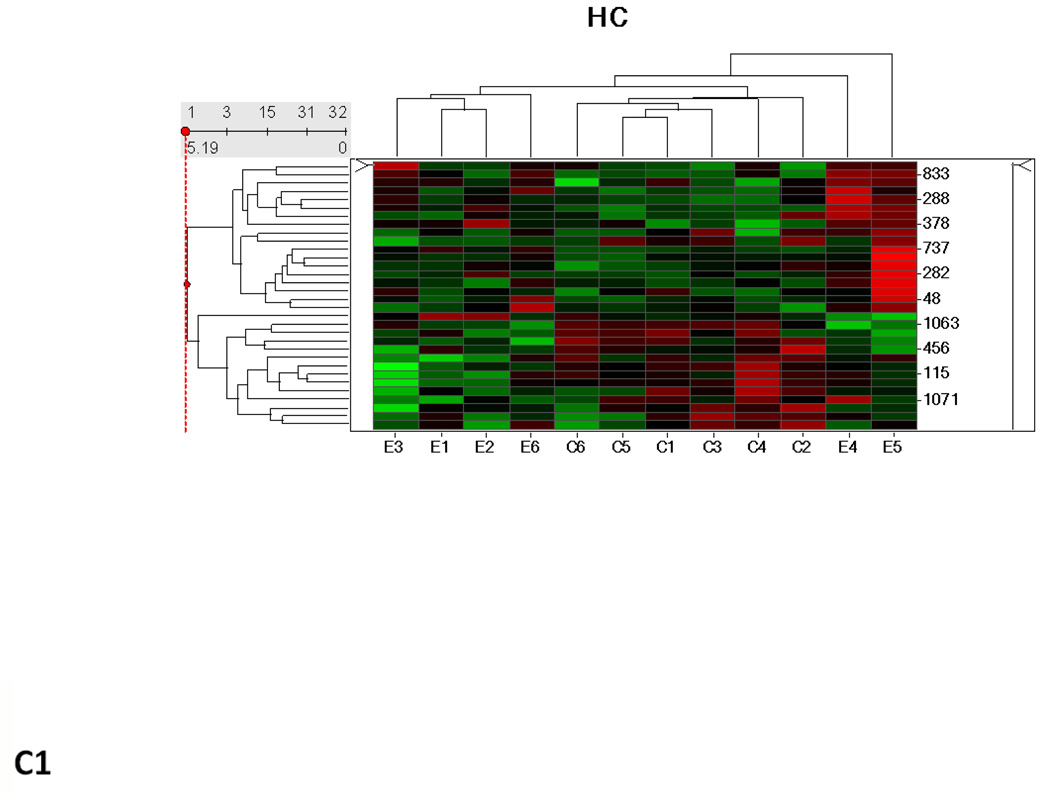
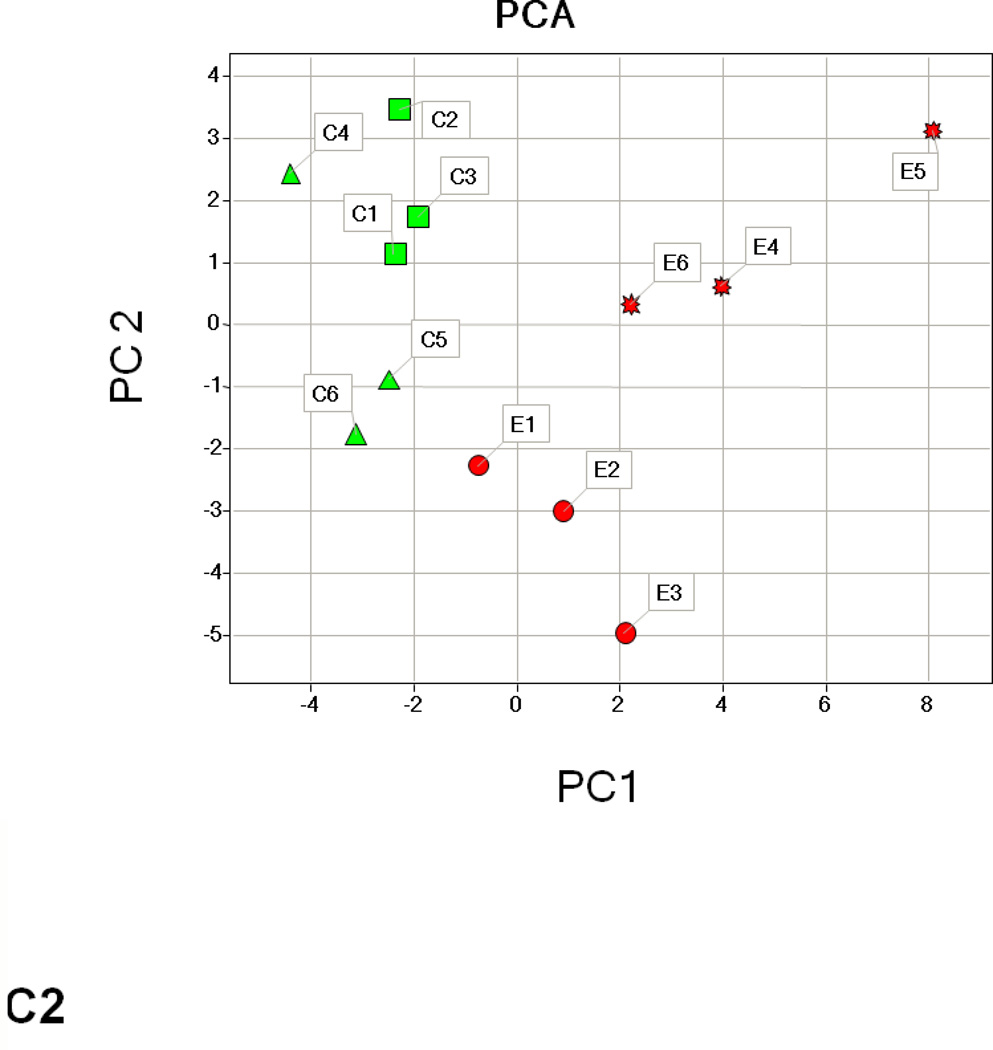
Hierarchical clustering analysis and PCA of the different experimental groups (1 month time point, 3 month time point, and 1 and 3 months together) obtained from the differential analysis is shown in Fig. 3. The PCA of the average normalized volumes of the significant proteins from the 1 and 3 month comparisons show a clear differentiation of the ethanol-fed animals from the control animals (Figs. 3A2 and 3B2). In the combined comparison of 1 and 3 months (Fig. 3C2), the clustering pattern shows that of the three ethanol-fed animals at 3 month time point, one animal clusters with the 1 month ethanol-fed rats, suggesting a lower degree of damage in its liver as compared to the other two ethanol-fed rats. The clustering of the control rats between 1 and 3 months represents a clear separation of each animal between 1 and 3 months (Supplementary Figure 1).
Fig. 3.
Hierarchial cluster and PCA analysis of 1 month (A1, A2), 3 months (B1, B2) and 1 and 3 months together (C1, C2). The spots chosen in for the 1 and 3 months samples were based on the criteria described in the methods (p ≤ 0.05 and fold change 1.5 or above). C1–C6 represents pair-fed control rats and E1–E6 represents ethanol-fed rats. Green squares and triangles represents 1 and 3 months controls while red squares and stars represent 1 and 3 months ethanol-fed rats.
Identification of features important to ALD using MARS modeling
The MARS analysis was based on the set of protein spots responding to ethanol at 1 month and 3 months, but without those spots responding to just diet at 3 months, with control 1 month as the master control set. More explicitly, the significant spots from (control 1 month vs. ethanol 1 month) and (control 1 month vs. ethanol 3 month) comparisons were combined, from which the significant spots in the (control 1 month vs. control 3 month) comparison were removed. This left 296 spots. The log2-transformed normalized volumes of these spots in the entire sample set (18 control and 18 ethanol-fed samples, including replicates) were used as input. The optimal MARS model was selected on the basis of lowest cross-validation error. This model had seven protein spots, which were identified by MALDI/TOF-TOF analysis. The proteins along with their variable importance (a relative indicator from 0% to 100%) in the MARS model for ALD were D-dopachrome tautomerase (#1063, score 100%), 1,2-dihydroxy-3-keto-5-methylthio pentenedioxygenase (#904 score 59.99%), electron transfer flavoprotein subunit beta (#755, score 50.46%), D-dopachrome decarboxylase (#1053, score 45.10%), superoxide dismutase (#840, score 27.29%), and transitional endoplasmic reticulum ATPase (#197, score 22.44%). Of the spots identified, only those with protein expectation scores ≤ 0.001 were considered reliable identifications. The MARS model for the initial stages of ALD were represented by seven basis functions which the final output is given by a linear combination of all these basis functions. The protein with the highest MARS score for ethanol-induced changes was found from the discovery proteomics analysis and is present in Tables 1. D-dopachrome decarboxylase (as seen in Table 3) is only specific to ethanol-related liver damage.
Western Blotting
Selected proteins that showed significant changes at 1 and 3 months (control vs. ethanol-fed) were further characterized by Western blot. As shown in Supplementary Fig. 2, ADH1C was down-regulated in the ethanol-fed rats at 1 month but not at 3 months, while ALDH2 was up-regulated in the ethanol-fed rats at 3 months but not at 1 month (Supplementary Fig. 3).
Discussion
Fatty liver is very common among alcohol drinkers and in some cases nonalcohol drinkers and affects approximately 90 to 100% of long-term heavy drinkers (Arteel et al., 2003). Alcoholic steatohepatitis is a limiting step in ALD as ~50% of individuals develop cirrhosis and fibrosis (Lucey et al., 2009; Miranda-Mendez et al., 2010; Newton et al., 2009). Once alcoholic steatohepatitis develops, abstinence from drinking reverses this condition in only 10% of the individuals (French, 2002; Newton et al., 2009). Hence early detection of the various stages of progressive ethanol-induced liver injury is important in managing its reversal and/or therapeutic management. In our study, H&E stained liver sections at 1 month ethanol-fed rats showed fat accumulation that increases at 3 months. No signs of oxidative damage and inflammation were observed in the livers of ethanol-fed animals at 1 month, while mild oxidative stress and inflammation was observed at 3 months, which suggest progression of fatty liver stage (1 month) to an early steatohepatitis stage (3 months).
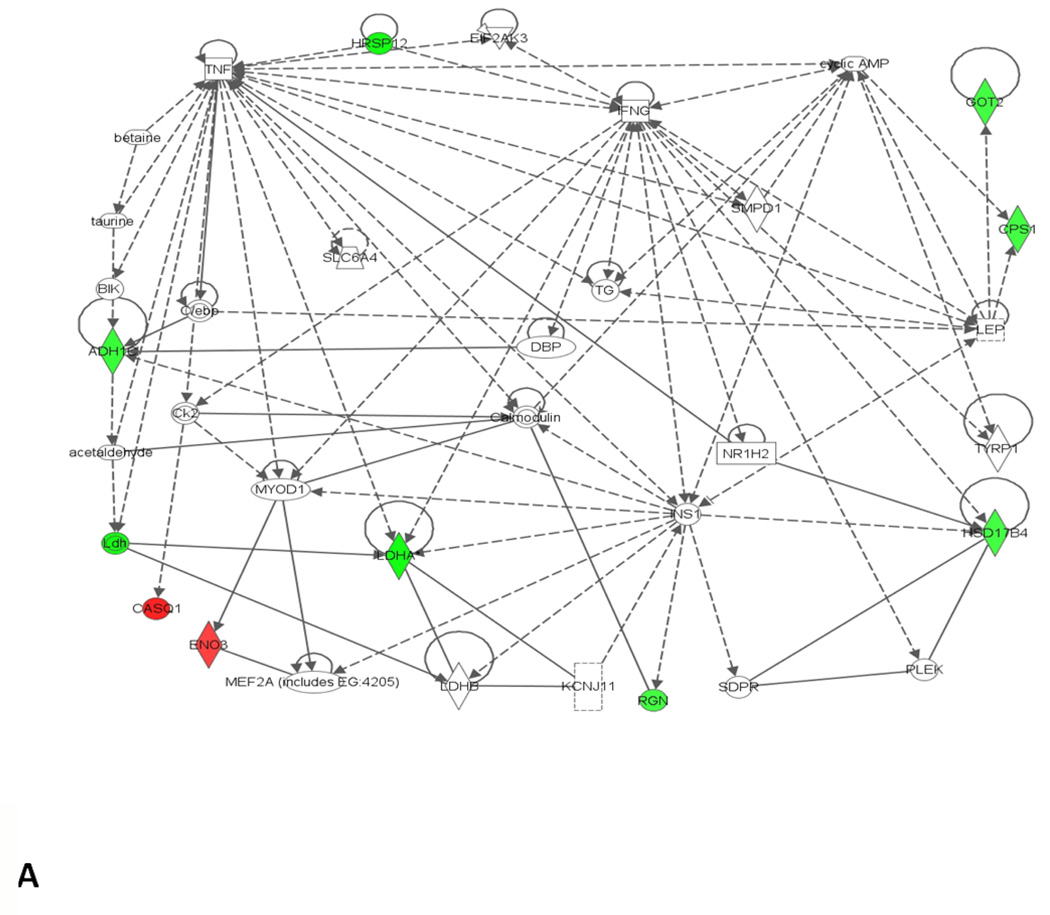
Among the twelve proteins that are differentially expressed in the ethanol-fed vs. control animals at 1 month, down-regulation of alcohol dehydrogenase (ADH1C), carbamoyl phosphate synthase (CPS1), and 78 kDa glucose-regulated protein (HSPA5) are important for alcohol metabolism and cellular stress. Down-regulation of ADH1C, found among chronic alcoholics, may be an early event in the fatty liver progression, and may be related to impaired ethanol oxidative metabolism (Ciuclan et al., 2010). Similarly, down-regulation of proteins such as CPS1 and HSPA5, has been suggested as a biomarker for the early diagnosis of nonalcoholic steatohepatitis (NASH) (Rodriguez-Suarez et al., 2010). Other differentially expressed proteins are mainly involved in lipid metabolism (6 proteins), molecular transport (4 proteins), cell death (3 proteins), and small molecule biochemistry (7 proteins; fatty acid and lipid metabolism, calcium signaling, urea cycle, and glycolysis). The network interactions (shown in Fig. 4A) represent identified proteins together with some non-obvious proteins such as tumor necrosis factor (TNF-α) and interferon gamma (IFN-γ). Oxidative stress is implicated in liver cell injury by directly triggering apoptosis or by predisposing the cells to TNF-α induced apoptosis (Liu et al., 2002). IFN-γ has many functions such as apoptotic effect, antiviral effect, and in the production of reactive oxygen species (Schroder et al., 2004). Proteins that we found indicating hepatotoxicity are involved in liver cholestasis (ADH1C), liver damage (RGN), liver steatosis (HADHA), liver necrosis/cell death (RGN), and hepatocellular carcinoma (HSPA5). Changes in RGN and CASQ1 may lead to endoplasmic reticulum (ER) stress/unfolded protein response, and affecting its essential functions to store/release calcium for biosynthesis of lipids and sterols (Ji, 2012).
Fig. 4.
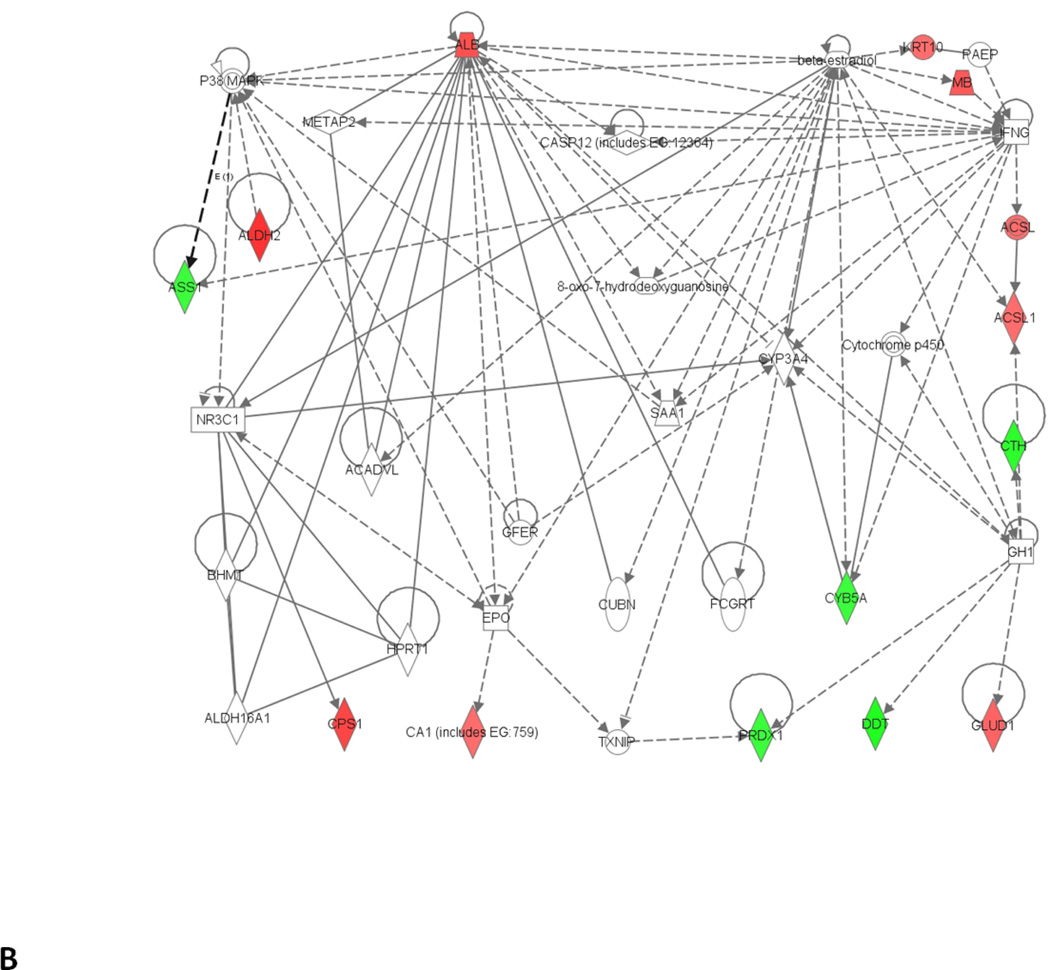
Network analysis of differentially expressed proteins that were significantly altered at different time points and identified by MS/MS. (A) 1 month; (B) 3 months. Green represents the down regulated proteins while red represents the up regulated proteins. Functions associated to network A include lipid metabolism, molecular transport, and small molecular biochemistry while functions associated to network B includes amino acid metabolism, small molecular biochemistry and gene expression.
Our findings on ethanol-induced steatosis at the 1 month time point are similar to those reported earlier for alcoholic steatosis and NASH (Newton et al., 2009; Rodriguez-Suarez et al., 2010). Ethanol-induced fatty liver showed a differential expression of proteins involved in fatty acid and amino acid metabolism, oxidative stress, and chaperone function (Newton et al., 2009). HSPA5 and CPS1 were found to be carbonylated in alcoholic steatosis, effecting their cellular dysfunction as they degrade more rapidly than noncarbonylated proteins. BHMT was not differentially expressed in ethanol-fed rats at 3 or 6 weeks as compared to the controls, but was found to be carbonylated and suggested to be a potential biomarker for ethanol-induced steatosis (Newton et al., 2009). BHMT converts betaine and homocysteine to dimethylglycine and methionine and maintains homocysteine and methionine homeostasis. A homocysteine mediated mechanism has been suggested for the development of fatty liver (Werstuck et al., 2001). The increase in BHMT2 (1.4 fold) therefore represents a candidate biomarker for alcohol induced fatty liver (Zhihua et al., 2011). Similarly, observed altered enzymes and proteins of the urea cycle (CPS1), and calcium and fatty acid metabolism indicate abnormal hepatic metabolism with a pathogenesis and progression similar to NAFLD (Rodriguez-Suarez et al., 2010). Carbonylated lactate dehydrogenase and 3-hydroxyacyl CoA dehdyrogenase upon ethanol feeding have been suggested as potential biomarkers (Newton et al., 2009). Regucalcin, responsible for calcium signaling and has been implicated in hepatocellular carcinoma (HCC) was differentially expressed at fatty liver stage and could also be a potential biomarker for ethanol-induced fatty liver (Zhihua et al., 2011).
The 3 month analyses indicated down-regulation of liver peroxiredoxin 1. Peroxiredoxins catalyze the reduction of hydrogen and alkyl peroxides in the presence of thioredoxin reductase and NADPH (Rhee et al., 2005; Wood et al., 2003). Furthermore, in our study, ALDH2 was up regulated, probably as a protective/adaptive response against ethanol toxicity to convert acetaldehyde to less toxic acetate. ALDH2 was however, found to be down-regulated, in 3 and 6 weeks where only fatty liver was observed (Newton et al., 2009). Glutamate dehydrogenase and serum albumin (connected with apoptosis) were up-regulated, and down-regulation of cytochrome b5A (CYB5A) and arginosuccinate synthase (ASS1) were consistent with earlier findings in fatty liver and HCC (Newton et al., 2009; Zhihua et al., 2011). The expressions of these four proteins were not statistically significant at 1 month and could be indicators of early stages of steatohepatitis as observed by histopathology. CPS1, which removes excess ammonia from the cell, was up-regulated at 3 months as compared to its down-regulation observed at 1 month. Significant changes in BHMT2 at 1 month may represent a progressive change of this protein with different stages of ALD, as it has been down-regulated in HCC (Zhihua et al., 2011). ASS1 catalyzes the synthesis of arginosuccinate from citrulline and aspartate and is involved in the third step of the urea cycle in the liver (Husson et al., 2003). Glutamate dehydrogenase plays a key role in the nitrogen and glutamate metabolism, energy homeostasis, and is expressed in the liver. Serum albumin, synthesized and secreted from the liver, is involved in the transport of lipophilic compounds including free fatty acids. Up-regulation of this protein may indicate increased transport of free fatty acids to the liver consistent with our lipidomic data (Fernando et al., 2011). As previously suggested free fatty acids could be responsible for ethanol-induced fatty liver (Nanji, 2004). Long chain fatty acid CoA ligase 1 (ACSL 1), an enzyme which belongs to the acyl-CoA synthetase long-chain family member 1, participates in lipid metabolism in regulating fatty acid oxidation. Up-regulation of ACSL 1 further supports increased fatty acid metabolism in the liver of 3 month ethanol-fed rats. The changes in these liver enzymes further highlight cellular dysfunction of the liver. All the proteins that were differentially expressed in the ethanol-fed rats as compared to the corresponding controls at 3 months were associated with amino acid metabolism (5 proteins), small molecule biochemistry (10 proteins), cell death (8 proteins), and lipid metabolism (4 proteins) and are shown in Fig. 4B. ASCL1, ALB, ALDH2, CA1, CPS1, CYB5A, and PRDX 1 are directly involved in inflammatory diseases, while ASCL1, ALB, ALDH2, ASS1, CA1, CPS1, CTH, CYB5A, and GLUD1 are directly involved in metabolic diseases (IPA, Ingenuity systems, Redwood City, CA). PRDX 1 was the only protein directly involved in oxidative stress. The non-obvious interactions obtained from pathway analysis shows the involvement of p38 map kinase (P38MAPK) and caspase 12 (CASP 12), which are regulated by TNF-α.
We also examined the impact of fatty diet and extracted the unique proteins from that effect as well as the ethanol effect. Analysis of control animals between 1 and 3 months gave an insight in the early fatty liver development due to a high fat content in the Lieber-DeCarli diet and can be similar to NAFLD caused by a high fat diet (Bravo et al., 2011; Koteish and Diehl, 2001). Up-regulation of 3-hydroxy-3-methyl glutaryl CoA (cholesterol biosynthesis), ATP synthase (lipid metabolism), hydroxyacid oxidase 1 (fatty acid oxidation), and down-regulation of carbamoyl phosphate synthase (regulates triglycerol, ATP, phosphilipid, and fatty acid binding), supports that the liver metabolism is affected by this diet. The up-regulation observed in BHMT and formimidoyl transferase (folic acid binding) shows the effect of high fat content on methionine. However, the changes observed here are at very early stages of the development of fatty liver in a small number of rats and thus definite conclusions cannot be drawn. Pathway analyses using these altered protein levels are shown in Supplementary Figure 4. The proteins represent two different pathway profiles: (a) drug metabolism, glutathione depletion and lipid metabolism and (b) lipid metabolism, molecular transport and small molecule biochemistry. Of these two, the second network is similar to the one obtained at 1 month control vs. ethanol-fed time point shows that in both ALD and NAFLD, fatty liver is developed by similar networks and supports the two hit model (Koteish and Diehl, 2002). Here, 10 proteins were directly involved with cell death, 10 with lipid metabolism, and 3 proteins involved in inflammation.
Nonparametric analysis of the protein spots yielded fewer proteins and narrowed the list of possible markers for ethanol-induced liver changes. Interestingly, the protein spot (DDT) obtained with the highest variable importance was already identified by discovery proteomics analysis. D-dopachrome tautomerase (DDT) responsible for the biosynthesis of melanin, an antioxidant, could be of high importance as this protein was validated by two independent approaches and could serve as an ideal biomarker for ethanol-related early steatohepatitis. Recent studies have shown that DDT, an adipokine, regulates lipid metabolism by inhibiting genes involved in lipogenesis and lipolysis (Iwata et al., 2012). DDT is present in tissues and detected in serum (Coleman et al., 2008; Merk et al., 2011). Our previous metabolomic studies have shown the involvement of free fatty acids in the formation of steatosis and steatohepatitis and thus further strengthen the involvement of DDT in the development of ALD related diseases (Fernando et al., 2010; 2011; Iwata et al., 2012).
In conclusion, the diagnosis of ethanol induced steatosis and steatohepatitis can be accomplished histologically as well as by utilizing other biomarkers characterized through proteomics/lipidomics. These new biomarkers will allow noninvasive detection of a disease and/or different stages of ethanol-induced fatty liver once thoroughly validated in serum/plasma. One of the limitations of this model is that nonalcoholic steatosis can result in controls after receiving a high fat diet for 3 months as previously reported by us. However, the differentially expressed proteins observed in ethanol-fed rats are solely due to the affect of ethanol because both control and ethanol-fed groups are fed the same base diet. We used MARS modeling to narrow down possible biomarkers and our results show that different proteins are differentially expressed at different disease states while myoglobin, BHMT2, and cytathionine gamma-lyase show progressive changes as the disease progressed (Table 3). We suggest that down-regulated CPS1, ADH1C, HSPA5 and up-regulated BHMT2 could serve as potential markers for early detection of fatty liver, while down-regulation of DDT, PRDX1, CYB5A and up-regulation of CPS1, ALDH2 and ACSL1 could serve as marker signatures for the early detection of steatohepatitis. This necessitates further investigation of the differential expression of these proteins in plasma/serum of animal’s models as well as in humans.
Supplementary Material
Highlights.
Proteins related to ethanol-induced steatosis and mild steatohepatitis are identified.
ADH1C and ALDH2 involved in alcohol metabolism are differentially expressed at 1 and 3 months.
Discovery proteomics identified a group of proteins to serve as potential biomarkers.
Using nonparametric analysis DDT is identified as a possible marker for liver damage.
Acknowledgements
This publication was made possible by NIH grant number R01AA016364 and its contents are solely the responsibility of the authors and do not necessarily represent the views of the NIH or NIAAA. The authors would like to thank Bioinformatics Program at UTMB for the Ingenuity and Spotfire Software programs, the National Institute of Environmental Health Science Center (supported by NIEHS grant P30ES06676) for the center grant at UTMB and the NHLBI Proteomics Center contract HHSN268201000037C (JEW-Dr. Alex Kurosky, PI) and Dr. K. K. Bhopale for the animal experimentation.
Footnotes
Publisher's Disclaimer: This is a PDF file of an unedited manuscript that has been accepted for publication. As a service to our customers we are providing this early version of the manuscript. The manuscript will undergo copyediting, typesetting, and review of the resulting proof before it is published in its final citable form. Please note that during the production process errors may be discovered which could affect the content, and all legal disclaimers that apply to the journal pertain.
Conflict of interest statement
The authors do not have any conflict of interest to disclose.
References
- Arteel G, Marsano L, Mendez C, Bentley F, McClain CJ. Advances in alcoholic liver disease. Best Pract Res Cl Ga. 2003;17:625–647. doi: 10.1016/s1521-6918(03)00053-2. [DOI] [PubMed] [Google Scholar]
- Banerjee A, Russell WK, Jayaraman A, Ramaiah SK. Identification of proteins to predict the molecular basis for the observed gender susceptibility in a rat model of alcoholic steatohepatitis by 2-D gel proteomics. Proteomics. 2008;8:4327–4337. doi: 10.1002/pmic.200700368. [DOI] [PubMed] [Google Scholar]
- Bell LN, Theodorakis JL, Vuppalanchi R, Saxena R, Bemis KG, Wang M, Chalasani N. Serum Proteomics and Biomarker Discovery Across the Spectrum of Nonalcoholic Fatty Liver Disease. Hepatology. 2010;51:111–120. doi: 10.1002/hep.23271. [DOI] [PMC free article] [PubMed] [Google Scholar]
- Bergheim I, McClain CJ, Arteel GE. Treatment of alcoholic liver disease. Dig Dis. 2005;23:275–284. doi: 10.1159/000090175. [DOI] [PMC free article] [PubMed] [Google Scholar]
- Brasier AR, Garcia J, Wiktorowicz JE, Spratt HM, Comach G, Ju H, Recinos A, Soman K, Forshey BM, Halsey ES, Blair PJ, Rocha C, Bazan I, Victor SS, Wu Z, Stafford S, Watts D, Morrison AC, Scott TW, Kochel TJ, Gr VDFW. Discovery Proteomics and Nonparametric Modeling Pipeline in the Development of a Candidate Biomarker Panel for Dengue Hemorrhagic Fever. Cts-Clin Transl Sci. 2012;5:8–20. doi: 10.1111/j.1752-8062.2011.00377.x. [DOI] [PMC free article] [PubMed] [Google Scholar]
- Bravo E, Palleschi S, Aspichueta P, Buque X, Rossi B, Cano A, Napolitano M, Ochoa B, Botham KM. High fat diet-induced non alcoholic fatty liver disease in rats is associated with hyperhomocysteinemia caused by down regulation of the transsulphuration pathway. Lipids Health Dis. 2011;10:60. doi: 10.1186/1476-511X-10-60. [DOI] [PMC free article] [PubMed] [Google Scholar]
- Calligaris D, Villard C, Lafitte D. Advances in top-down proteomics for disease biomarker discovery. J Proteomics. 2011;74:920–934. doi: 10.1016/j.jprot.2011.03.030. [DOI] [PubMed] [Google Scholar]
- Ciuclan D, Ehnert S, IIkavets I, Weng H, Gaitantzi H, Tsukamoto H, Ueberham E, Meindl-Beinker N, Breitkopf K, Dooley S. TGF-beta enhances alcohol dependent hepatocyte damage via down-regulation of alcohol dehydrogenase I. J Hepatol. 2010;52:407–416. doi: 10.1016/j.jhep.2009.12.003. [DOI] [PubMed] [Google Scholar]
- Coleman AM, Rendon BE, Zhao M, Qian MW, Bucala R, Xin D, Mitchell RA. Cooperative regulation of non-small cell lung carcinoma angiogenic potential by macrophage migration inhibitory factor and its homolog, D-dopachrome tautomerase. J Immunol. 2008;181:2330–2337. doi: 10.4049/jimmunol.181.4.2330. [DOI] [PMC free article] [PubMed] [Google Scholar]
- Day CP, James OF. Steatohepatitis: a tale of two "hits"? Gastroenterology. 1998;114:842–845. doi: 10.1016/s0016-5085(98)70599-2. [DOI] [PubMed] [Google Scholar]
- Fernando H, Bhopale KK, Boor PJ, Ansari GAS, Kaphalia BS. Hepatic lipid profiling of deer mice fed ethanol using (1)H and (31)P NMR spectroscopy: A dose-dependent subchronic study. Toxicol Appl Pharmacol. 2012;264:361–369. doi: 10.1016/j.taap.2012.07.026. [DOI] [PMC free article] [PubMed] [Google Scholar]
- Fernando H, Bhopale KK, Kondraganti S, Kaphalia BS, Shakeel Ansari GA. Lipidomic changes in rat liver after long-term exposure to ethanol. Toxicol Appl Pharmacol. 2011;255:127–137. doi: 10.1016/j.taap.2011.05.022. [DOI] [PMC free article] [PubMed] [Google Scholar]
- Fernando H, Kondraganti S, Bhopale KK, Volk DE, Neerathilingam M, Kaphalia BS, Luxon BA, Boor PJ, Shakeel Ansari GA. (1)H and (31)P NMR lipidome of ethanol-induced fatty liver. Alcohol Clin Exp Res. 2010;34:1937–1947. doi: 10.1111/j.1530-0277.2010.01283.x. [DOI] [PMC free article] [PubMed] [Google Scholar]
- Freeman WM, Salzberg AC, Gonzales SW, Grant KA, Vrana KE. Classification of alcohol abuse by plasma protein biomarkers. Biol Psychiatry. 2010;68:219–222. doi: 10.1016/j.biopsych.2010.01.028. [DOI] [PMC free article] [PubMed] [Google Scholar]
- Freeman WM, Vrana KE. Future prospects for biomarkers of alcohol consumption and alcohol-induced disorders. Alcohol Clin Exp Res. 2010;34:946–954. doi: 10.1111/j.1530-0277.2010.01169.x. [DOI] [PMC free article] [PubMed] [Google Scholar]
- French SW. Alcoholic hepatitis: inflammatory cell-mediated hepatocellular injury. Alcohol. 2002;27:43–46. doi: 10.1016/s0741-8329(02)00205-7. [DOI] [PubMed] [Google Scholar]
- Friedman JH. Multivariate Adaptive Regression Splines. Ann Stat. 1991;19:1–67. doi: 10.1177/096228029500400303. [DOI] [PubMed] [Google Scholar]
- Galasko D. Biomarkers for Alzheimer's disease--clinical needs and application. J Alzheimers Dis. 2005;8:339–346. doi: 10.3233/jad-2005-8403. [DOI] [PubMed] [Google Scholar]
- Gomperts BN, Spira A, Massion PP, Walser TC, Wistuba II, Minna JD, Dubinett SM. Evolving Concepts in Lung Carcinogenesis. Semin Resp Crit Care. 2011;32:32–43. doi: 10.1055/s-0031-1272867. [DOI] [PMC free article] [PubMed] [Google Scholar]
- Haber H, Jahn H, Ehrenreich H, Melzig MF. Assay of salsolinol in peripheral blood mononuclear cells of alcoholics and healthy subjects by gas chromatography-mass spectrometry. Addict Biol. 2002;7:403–407. doi: 10.1080/1355621021000005991. [DOI] [PubMed] [Google Scholar]
- Helander A. Biological markers in alcoholism. J Neural Transm-Supp. 2003:15–32. doi: 10.1007/978-3-7091-0541-2_2. [DOI] [PubMed] [Google Scholar]
- Husson A, Brasse-Lagnel C, Fairand A, Renouf S, Lavoinne A. Argininosuccinate synthetase from the urea cycle to the citrulline-NO cycle. Eur J Biochem. 2003;270:1887–1899. doi: 10.1046/j.1432-1033.2003.03559.x. [DOI] [PubMed] [Google Scholar]
- Iwata T, Taniguchi H, Kuwajima M, Taniguchi T, Okuda Y, Sukeno A, Ishimoto K, Mizusawa N, Yoshimoto K. The Action of D-Dopachrome Tautomerase as an Adipokine in Adipocyte Lipid Metabolism. PLoS One. 2012;7:e33402. doi: 10.1371/journal.pone.0033402. [DOI] [PMC free article] [PubMed] [Google Scholar]
- Ji C. Mechanisms of alcohol-induced endoplasmic reticulum stress and organ injuries. Biochem Res Int. 2012;2012 doi: 10.1155/2012/216450. 216450. [DOI] [PMC free article] [PubMed] [Google Scholar]
- Kanaujiya JK, Lochab S, Pal P, Christopeit M, Singh SM, Sanyal S, Behre G, Trivedi AK. Proteomic approaches in myeloid leukemia. Electrophoresis. 2011;32:357–367. doi: 10.1002/elps.201000428. [DOI] [PubMed] [Google Scholar]
- Koteish A, Diehl AM. Animal models of steatosis. Seminars in Liver Disease. 2001;21:89–104. doi: 10.1055/s-2001-12932. [DOI] [PubMed] [Google Scholar]
- Koteish A, Diehl AM. Animal models of steatohepatitis. Best Pract Res Cl Ga. 2002;16:679–690. doi: 10.1053/bega.2002.0332. [DOI] [PubMed] [Google Scholar]
- Lieber CS, DeCarli LM. Liquid diet technique of ethanol administration: 1989 update. Alcohol Alcohol. 1989;24:197–211. [PubMed] [Google Scholar]
- Liu H, Jones BE, Bradham C, Czaja MJ. Increased cytochrome P-450 2E1 expression sensitizes hepatocytes to c-Jun-mediated cell death from TNF-alpha. Am J Physiol Gastrointest Liver Physiol. 2002;282:G257–G266. doi: 10.1152/ajpgi.00304.2001. [DOI] [PubMed] [Google Scholar]
- Lucey MR, Mathurin P, Morgan TR. Alcoholic hepatitis. N Engl J Med. 2009;360:2758–2769. doi: 10.1056/NEJMra0805786. [DOI] [PubMed] [Google Scholar]
- MARS User Manual. Salford Systems; 2001. [Google Scholar]
- Merk M, Zierow S, Leng L, Das R, Du X, Schulte W, Fan J, Lue HQ, Chen YB, Xiong HB, Chagnon F, Bernhagen J, Lolis E, Mor G, Lesur O, Bucala R. The D-dopachrome tautomerase (DDT) gene product is a cytokine and functional homolog of macrophage migration inhibitory factor (MIF) P Natl Acad Sci USA. 2011;108:E577–E585. doi: 10.1073/pnas.1102941108. [DOI] [PMC free article] [PubMed] [Google Scholar]
- Miranda-Mendez A, Lugo-Baruqui A, Armendariz-Borunda J. Molecular basis and current treatment for alcoholic liver disease. Int J Environ Res Public Health. 2010;7:1872–1888. doi: 10.3390/ijerph7051872. [DOI] [PMC free article] [PubMed] [Google Scholar]
- Nanji AA. Role of different dietary fatty acids in the pathogenesis of experimental alcoholic liver disease. Alcohol. 2004;34:21–25. doi: 10.1016/j.alcohol.2004.08.005. [DOI] [PubMed] [Google Scholar]
- Neuhold LA, Guo QM, Alper J, Velazquez JM. High-Throughput Proteomics for Alcohol Research. Alcohol Clin Exp Res. 2004;28:203–210. doi: 10.1097/01.alc.0000113410.60985.0e. [DOI] [PubMed] [Google Scholar]
- Newton BW, Russell WK, Russell DH, Ramaiah SK, Jayaraman A. Liver Proteome Analysis in a Rodent Model of Alcoholic Steatosis. J Proteome Res. 2009;8:1663–1671. doi: 10.1021/pr800905w. [DOI] [PMC free article] [PubMed] [Google Scholar]
- Pais R, Pascale A, Fedchuck L, Charlotte F, Poynard T, Ratziu V. Progression from isolated steatosis to steatohepatitis and fibrosis in nonalcoholic fatty liver disease. Clin Res Hepatol Gas. 2011;35:23–28. doi: 10.1016/j.gcb.2010.06.004. [DOI] [PubMed] [Google Scholar]
- Rhee SG, Chae HZ, Kim K. Peroxiredoxins: A historical overview and speculative preview of novel mechanisms and emerging concepts in cell signaling. Free Radical Bio Med. 2005;38:1543–1552. doi: 10.1016/j.freeradbiomed.2005.02.026. [DOI] [PubMed] [Google Scholar]
- Rodriguez-Suarez E, Duce AM, Caballeria J, Arrieta FM, Fernandez E, Gomara C, Alkorta N, Ariz U, Martinez-Chantar ML, Lu SC, Elortza F, Mato JM. Non-alcoholic fatty liver disease proteomics. Proteom Clin Appl. 2010;4:362–371. doi: 10.1002/prca.200900119. [DOI] [PMC free article] [PubMed] [Google Scholar]
- Schroder K, Hertzog PJ, Ravasi T, Hume DA. Interferon-gamma: an overview of signals, mechanisms and functions. J Leukoc Biol. 2004;75:163–189. doi: 10.1189/jlb.0603252. [DOI] [PubMed] [Google Scholar]
- Teli MR, Day CP, Burt AD, Bennett MK, James OFW. Determinants of Progression to Cirrhosis or Fibrosis in Pure Alcoholic Fatty Liver. Lancet. 1995;346:987–990. doi: 10.1016/s0140-6736(95)91685-7. [DOI] [PubMed] [Google Scholar]
- Verrills NM, Irwin JA, Yan He X, Wood LG, Powell H, Simpson JL, McDonald VM, Sim A, Gibson PG. Identification of novel diagnostic biomarkers for asthma and chronic obstructive pulmonary disease. Am J Respir Crit Care Med. 2011;183:1633–1643. doi: 10.1164/rccm.201010-1623OC. [DOI] [PubMed] [Google Scholar]
- Werstuck GH, Lentz SR, Dayal S, Hossain GS, Sood SK, Shi YY, Zhou J, Maeda N, Krisans SK, Malinow MR, Austin RC. Homocysteine-induced endoplasmic reticulum stress causes dysregulation of the cholesterol and triglyceride biosynthetic pathways. J Clin Invest. 2001;107:1263–1273. doi: 10.1172/JCI11596. [DOI] [PMC free article] [PubMed] [Google Scholar]
- Witzmann FA, Strother WN. Proteomics and alcoholism. Int Rev Neurobiol. 2004;61:189–214. doi: 10.1016/S0074-7742(04)61008-7. [DOI] [PubMed] [Google Scholar]
- Wood ZA, Schroder E, Harris JR, Poole LB. Structure, mechanism and regulation of peroxiredoxins. Trends Biochem Sci. 2003;28:32–40. doi: 10.1016/s0968-0004(02)00003-8. [DOI] [PubMed] [Google Scholar]
- Wurst FM, Kempter C, Metzger J, Seidl S, Alt A. Ethyl glucuronide: a marker of recent alcohol consumption with clinical and forensic implications. Alcohol. 2000;20:111–116. doi: 10.1016/s0741-8329(99)00076-2. [DOI] [PubMed] [Google Scholar]
- Younossi ZM, Baranova A, Ziegler K, Del Giacco L, Schlauch K, Born TL, Elariny H, Gorreta F, VanMeter A, Younoszai A, Ong JP, Goodman Z, Chandhoke V. A genomic and proteomic study of the spectrum of nonalcoholic fatty liver disease. Hepatology. 2005;42:665–674. doi: 10.1002/hep.20838. [DOI] [PubMed] [Google Scholar]
- Zhang W, Chait BT. ProFound: an expert system for protein identification using mass spectrometric peptide mapping information. Anal Chem. 2000;72:2482–2489. doi: 10.1021/ac991363o. [DOI] [PubMed] [Google Scholar]
- Zhihua L, Ma Y, Yang J, Qin H. Upregulated and downregulated proteins in hepatocellular carcinoma: a systematic review of proteomic profiling studies. OMICS. 2011;15:61–71. doi: 10.1089/omi.2010.0061. [DOI] [PubMed] [Google Scholar]
Associated Data
This section collects any data citations, data availability statements, or supplementary materials included in this article.


