Abstract
In this study, we immobilized polydiacetylene vesicles (PDAVs) onto the surface of polystyrene (PS) microspheres (1 μm in diameter) by using both electrical charge and conjugated forces to form a reinforced composite structure. These reinforced complexes could be easily washed, separated by centrifugation, and resuspended by gentle agitation. After passing through a narrow 200 μm-diameter channel, the composite structures maintained their original shape, demonstrating their resilience and potential for use in microfluidic technologies. The number of PDAVs in the composite structure could be mediated by changing the extent of layer deposition, which affected the sensitivity of detection. It showed that PDAVs did not change their blue color after addition of detecting probes such as anti-H5N1, which was of great importance in the fabrication and modification of stable color-changeable biosensors based on PDAVs. By conjugating anti-H5N1 antibodies to the PS@PDAV via N -hydroxysuccinimide and 1-ethyl3-(3-dimethylaminopropyl) carbodiimide chemistry, a stable blue complex, anti-H5N1 microsphere (PS@PDAV-anti-H5N1) was formed. A target antigen of H5N1 (HAQ [H5N1 strain A/ environment/Qinghai/1/2008{H5N1} in clade 0]) was detected by PS@PDAV-anti-H5N1. At an optimal PDAV deposition level of three layers, the limit of detection was determined to be approximately 3 0 ng/mL of HAQ by using optical spectrum measurement and visual inspection, meeting the needs of fast and simple color-changeable detection. However, a much lower limitation of detection (1 ng/mL) was able to be obtained using laser-scanning confocal microscopy, which could be compared with the results obtained with other sophisticated equipment.
Keywords: reinforced composite structure, polystyrene, polydiacetylene, H5N1 virus detection
Introduction
Polydiacetylene (PDA), which can be obtained by photopolymerization via 1,4-addition of diacetylene (DA) under ultraviolet (UV) irradiation, exhibits distinctive electronic and optical properties due to the highly delocalized π-electron system of its polymer backbone.1 When exposed to external stimuli, including heat, pH, stress, ions, solvent, and biological substances, PDA can undergo conformational changes that cause a pronounced color change from blue to red and a dramatic shift in the λmax absorption of the polymer.2–8 The intriguing stimuli-induced color change makes PDA of interest in a variety of applications, such as colorimetric chemosensing or biomolecular sensing. PDA-based biosensors have been proven to be sensitive to a wide range of analytes, such as proteins, lipophilic enzymes, bacteria, viruses, and pharmacologically active compounds.9–13 However, PDA vesicles (PDAVs) are fragile and collapse easily, which limits their practical applications. To improve the versatility of PDAVs and enable multiplex detection, immobilization of the vesicles on solid substrates is needed. For this purpose, microsphere substrates are better than planar substrates, because biochemical reactions using microspheres can be performed more efficiently in solution. For example, target molecules can be detected using microspheres in microfluidic systems. Some papers have reported the creation of core/shell structures in which a monolayer of PDA molecules is immobilized on silica beads, based on Ca++ chelation or modification by 3-aminopropyltri-ethoxysilane.14,15 However, these methods based on chemical reaction created a monolayer of PDAVs, which limited the number of PDAVs. Moreover, the rapid sedimentation of high-density silica core limited the stable measurement of optical absorption in solution. Therefore, other methods for fabrication of PDA sensing are needed.
In the preparation of a biosensor based on the chromatic property of PDAVs, immobilization of detecting probes on it by chemical conjugation or physical methods would always cause the stress change in the ene-yne conjugated structure of PDAVs.16,17 Due to the weak mechanical property of PDAVs, color change often occurred before the detecting process started. Herein, we use a weak-force approach that enables multilayer adsorption of the DA vesicles (DAVs) on the polystyrene (PS) microspheres. The relationship between the reinforced effect and the stability as well as the sensitivity of H5N1 antigen detection was investigated.
Materials and methods
Materials
Ninety-eight-percent pure 10,12-pentacosadiynoic acid (DA) was purchased from Sigma-Aldrich (St Louis, MO, USA) and was further purified before use by dissolution in chloroform followed by filtration to remove polymerized monomers. PS microspheres (~ 1 μm, 1.4 wt% in water) were cleaned by centrifugation. Linear poly(ethylenimine) (PEI) and poly(sodium 4-styrenesulfonate) (PSS) (molecular weight 70,000) were purchased from Sigma-Aldrich. Bovine serum albumin (BSA) was purchased from Beijing Reagent Company (Beijing, China); N-hydroxysuccinimide (NHS) and 1-ethyl-3-(3-dimethylaminopropyl) carbodiimide (EDC) were purchased from Sigma-Aldrich; target antigen of H5N1 and the anti-H5N1 monoclonal antibody were provided by the Institute of Zoology, Chinese Academy of Sciences (Beijing, China). HAQ (H5N1 strain A/ environment/Qinghai/1/2008[H5N1] in clade 0) was used as the target antigen, which was first inactivated by formaldehyde, examined by inoculating embryonated chicken eggs, and then purified according to the reference.18 Anti-H5N1 is a monoclone antibody, which was produced in mice and purified. Its specific antibody titer was tested with enzyme-linked immunosorbent assay.
Preparation of DAVs
Purified DA powder in 10 mL of redistilled water was sonicated in an ultrasonicator bath (KQ-100B; Kunshan Ultrasonic Instrument, Shanghai, China) for 5–6 minutes at a temperature of approximately 80°C to produce a semitransparent, 1 mM solution. This solution was cooled to room temperature in the dark and stored overnight at 4°C to induce crystallization. The solution was then filtered with a 0.3 μm nylon filter membrane to remove impurities.
Preparation of multiple-layer composite microspheres
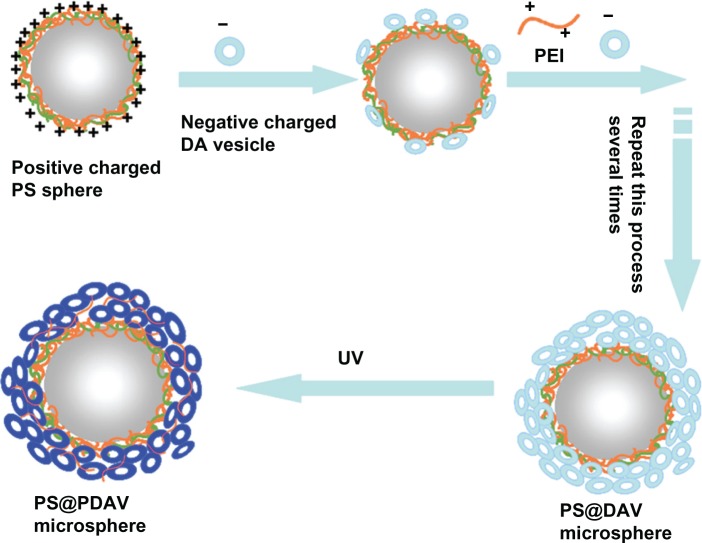
Positively charged PS microspheres were prepared as previously described (see Figure S1).19 Composite microspheres were prepared as follows. First, 0.5 mL of 1 mM DAV solution was added drop-wise to PEI-coated PS micro-spheres dispersed in 1 mL of water. After adsorption for 30 minutes, excess negatively charged DAVs were removed by centrifuging (4000 g) three times. Then, PEI was added again drop-wise to change the negatively charged surface of the PS microspheres. The size of the ultimate PS@PDAV microspheres was approximately 1.3 μm in diameter, and the final microspheres were of a uniform morphology on a large scale (see Supplementary materials). The deposited process was repeated several times, and changes in zeta potential following each addition were recorded on a Zetasizer (Malvern Instruments, Malvern, UK). The final solution was irradiated with UV light at 254 nm for 1 minute to polymerize the DA. The blue color of the solution intensified as the number of PDAVs increased, and the adsorption peak at approximately 640 nm did not change, indicating their backbone alternating ene–yne conjugated structure kept well. This procedure is depicted in Figure 1.
Figure S1.

The schematic illustration of preparation for positively charged PS microsphere. The electric charge of the negatively charged PS microspheres was regulated by different polyelectrolyte (PEI and PSS).
Abbreviations: PEI, linear poly(ethylenimine); PSS, poly(sodium 4-styrenesulfonate).
Figure 1.
A schematic illustration of the formation of reinforced structure microsphere.
Notes: The multiple-layer composite spheres of polystyrene polydiacetylene vesicles (PS@PDAV) were obtained by repeating the reaction of negatively charged DAV and positively charged PS spheres. Under ultraviolet light at 254 nm, blue PS@PDAV microspheres were formed by the polymerization of PS@DAV.
Abbreviation: PEI, poly(ethylenimine).
Conjugating anti-H5N1 antibody onto the PS@PDAV microspheres
The microsphere–antibody conjugates were prepared according to a modified version of a previously published procedure.20 The free carboxylic acid moieties of PDA on the outside layer of the conjugated microspheres were activated by a reaction with NHS and EDC at a molar ratio of 1:1.3:1.3 for 20 minutes. The removal of excess NHS and EDC was performed by centrifugation (4000 g) in three water-wash cycles. The anti-H5N1 antibody was added to a 1 mL solution of microspheres at a dilution of 1:3000, as was determined to be optimal by laser-scanning confocal microscopy (LSCM) (see Supplementary materials), and allowed to react for 3 hours at 4°C on a shaker. To avoid nonspecific absorption, a 150 (μg/mL BSA solution was added. All excess unbound components were removed from the microsphere solution by centrifugation (4000 g) with three water cycles.
Chromatographic detection of HAQ
Various amounts of HAQ were injected stepwise with a syringe into the conjugated microsphere solution with a constant pH of 6.9 at 36°C. The color change was visible with the naked eye and was recorded with a UV-visible spectrometer.
The transition from blue to red was quantified by the colorimetric response (CR), as suggested by Charych et al:16
where PB = Ablue/(Ablue + Ared), and Ablue and Ared are the absorbances of the blue component (λmax ≈ 650 nm) and the red component (λmax ≈ 540 nm), respectivey. PB0 is the initial percentage of the blue component before adding the analyte.
Fluorescence detection by laser-scanning confocal microscopy
LSCM imaging was performed with an Olympus (Tokyo, Japan) FV1000 (excitation and emission were recorded at 515 nm and 527 nm, respectively) and was analyzed by using Image-Pro Plus 5.0 software (Media Cybernetics, Rockville, MD, USA). A 100 × UPLSAPO (Olympus) oil objective lens (numerical aperture = 1.4) was used. The intensity calculated by the software was a mean density, which was the integral optical density per area. To obtain the result, the images needed to be converted to grayscale 8 and contrast inverted, followed by optical density correction by clicking the Intensity Calibration button. The value of the integral optical density and area was figured out after selection of proper measurement parameters.
During the experiment, various amounts of HAQ were injected with a syringe stepwise into the PS@PDAV-anti-H5N1 solution (pH 6.9). After incubation at 36°C for 20 minutes, the solution was then dripped quantitatively onto a clean slide and dried at 4°C for measurement.
Surface electromotive potential (ζ potential) measurement
The surface electrical charge of the microspheres (ζ potential) in solution was measured by a zeta-potential meter (Zetasizer Nano ZS; Malvern Instruments).
Microfluidic chip preparation
The microfluidic chip was made of polydimethylsiloxane with a channel diameter of 200 μm. The process for the preparation of the chip was the same as published previously21 Microchannels were prepared in a soda-lime glass wafer using standard photolithography with cross-channel dimensions of 200 × 30 μm (width × depth). A thoroughly cleaned glass plate was spin-coated with a photoresist exposed to UV light (365 nm, 6.8 mV/cm2), followed by acid etched, drilled, and then bonded. All of the joints were connected by silicone tubes. A kind of dual-syringe pump (TS-1A/ L0107-1A; Baoding Longer Precision Pump, Baoding, China) was used for flow.
The microsphere solution was passed through the microfluidic chip by an automatic sampler at a speed of 500 μL/minute.
Scanning electron microscopy and transmission electron microscopy measurement
Scanning electron microscopy (SEM) images were recorded on a Hitachi (Tokyo, Japan) S4800 microscope operated at 10 kV. For the SEM observation, suspensions were dropped onto a silicon wafer, followed by air-drying and gold coating.
Transmission electron microscopy (TEM) operation was carried out on a JEOL (Tokyo, Japan) JEM-1011CX microscope at 100 kV and images were captured digitally. The samples were obtained by dropping 2 μL of solution onto Formvar-covered copper grids.
Results and discussion
Reinforcement effect of PDAVs by immobilization on PS microspheres
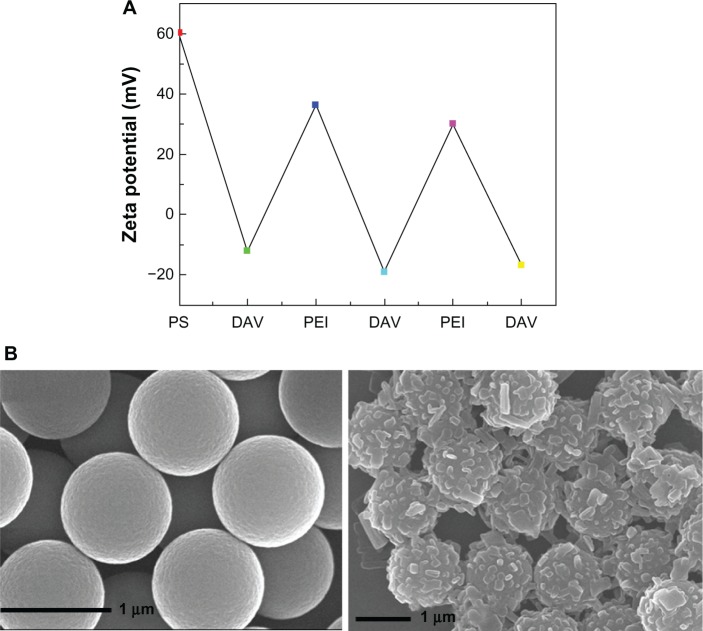
To improve the stability of the PDAVs, we fabricated a reinforced composite PS@PDAV by immobilizing PDAVs on PS microspheres using both electrical charge and hydrophobic forces. This process was directly described by the change of charge (in solution zeta potential) using the Zetasizer. As shown in Figure 2A, the zeta potential of the microspheres changed between positive and negative when DAVs and PEI were sequentially added into the solution of positively charged PS microspheres. Figure 2B is the SEM image of bare and PS@DAV microspheres separately. On the left is the SEM image of the bare PS microspheres with smooth and spotless surface at approximately 1 μm, and on the right is the SEM image of the PS@DAV microspheres. From the SEM images of the PS@PDAV microspheres, the individual PDAVs are hardly to be found; instead, they almost stayed on the surface of the PS microspheres via the strong electrostatic interaction.
Figure 2.
(A) Zeta (ζ) potential of polystyrene (PS) microspheres measured after the deposition of poly(ethylenimine) (PEI), poly(sodium 4-styrenesulfonate) (PSS) and diacetylene vesicles (DAVs). (B) Scanning electron microscopy images for bare PS microspheres (left) and PS@DAV (right).
Our experimental results showed PS@PDAV micro-spheres had much better mechanical strength characteristics than PDAVs alone because of their solid PS cores. PDAVs were tightly coated onto the surfaces of the PS microspheres by strong electrical charge interactions. Even when a collapse occurred, the PDAV assemblies stayed on the PS surface instead of diffusing into the solution or adsorbing onto the wall of the container, which ensured that PDAVs participated in the reaction.
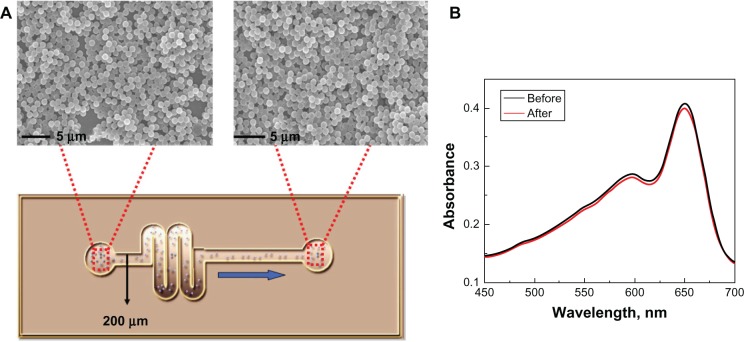
To demonstrate the high mechanical strength of PS@PDAV, Figure 3 shows the vesicles collapsing when dried onto a glass substrate. In contrast, the morphology of the complex microspheres is stable both in solution and dried onto solid substrates, which makes it possible to use them in a detection system with high mechanical strength. Most importantly, the good mechanical strength characteristics of the core/shell microspheres made it possible to use them in a microfluidic system. Here, we used a single-channel microfluidic chip for the test, as shown in Figure 4A. SEM images of the microspheres showed that the morphology of the microspheres did not change when passing through the channel of the microfluidic chip (Figure 4). At the same time, the color of PS@PDAV remained blue, and the chromatic property of HAQ detection remained unchanged. Therefore, these microspheres have the potential for use in microfluidic systems.
Figure 3.
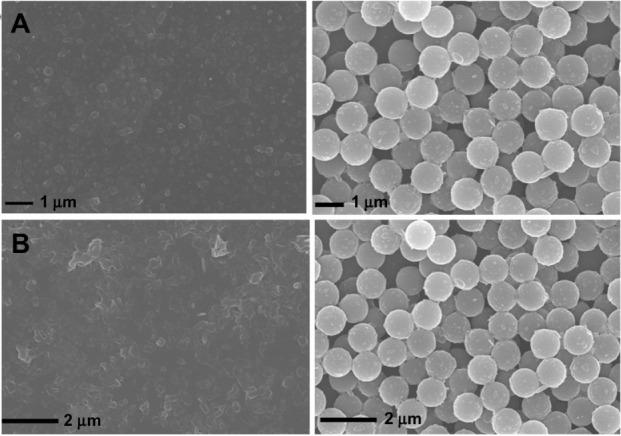
(A and B) Morphological stability of polydiacetylene vesicles (PDAVs) at different conditions. (A) Scanning electron microscopy images of PDAV (left) and PS@PDAV microspheres (right). (B) PDAV (left) and PS@PDAV microspheres (right) dried on a glass substrate overnight.
Figure 4.
(A) Scanning electron microscopy images of polystyrene polydiacetylene vesicle (PS@PDAV) microspheres before (left) and after (right) flowing through a microfluidic chip with a channel diameter of 200 μm. (B) The UV-visible absorbance spectra of PS@PDAV before (black line) and after (red line) flowing through the microfluidic chip as shown in (A).
In addition to the uniform morphology described above, the PS@PDAV microspheres exhibited other major advantages relative to traditional PDAVs. First, impurities in the solution were easily separated from the microspheres. Previously, PDAVs were separated from impurities by dialysis or high-speed centrifugation. However, dialysis is time-consuming compared to our method, and high-speed centrifugation causes adhesion of DAVs to the surface of the centrifuge tube, making them difficult to redisperse following centrifugation. In our case, the PS@PDAV microspheres could be almost entirely precipitated at 4000 g for approximately 5 minutes (Figure 5), and then be readily resuspended in solution simply by manual agitation. Secondly, the PS@ PDAV microsphere didn’t cause color change after the detecting probe was immobilized. Generally, the blue-phases PDAVs are not stable and usually turn to the red phase when conjugating antigen/antibody or other detecting probes, which greatly limited the application of the PDAVs in many cases. However, it has been found in our experiment that the immobilization of antibodies such as anti-H5N1 to the blue PS@PDAV didn’t cause blue–red phase changing, implying the effective conjugation length of the PDA backbone was not stressed much. This property could be attributed to the reinforced effect, which offers PDAVs higher resistance against large deformation by inserting or conjugating the biological probes into the color-changeable PDAVs.
Figure 5.
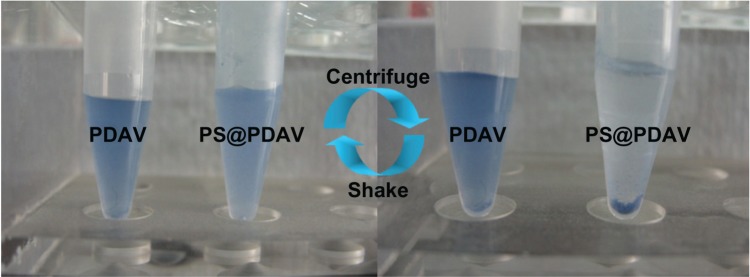
The sedimentation and resuspension of polydiacetylene vesicles (PDAVs) and PS@PDAV microsphere dispersions under centrifugation at 4000 g.Abbreviation: PS, polystyrene.
Effect of the number of PDAVs on the chromatic property and the recognition ability of the PS@ PDAV-anti-H5N1 microspheres
It is possible to control and increase the quantity of PDAV adsorbate by stepwise self-assembly. Single- and multilayer PS@PDAV microspheres were compared. Figure 6 shows SEM images of PS@PDAV microspheres with multiple depositions of PDAVs. The left panel of Figure 6A shows the initial PDAVs adsorbed onto the PS microspheres, and the right panel shows multilayer PS microspheres. From left to right, the surface roughness can be seen to increase, demonstrating that the number of PDAVs increased upon additional rounds of adsorption. Additionally, the UV-visible absorbance (λmax ≈ 640 nm) of solutions with different PDAV contents was detected by a UV-visible spectrometer, as shown in Figure 6B. The absorbance level was correlated with the number of PDAVs adsorbed onto the microspheres. Accordingly, the color gradient of the solutions followed the same trend. The initial solution of bare PS microspheres with PEI and poly(sodium 4-styrenesulfonate) was a white suspension, while the blue color of the solutions became deeper as the number of PDAV increased, as shown in Figure 6C. It is important that the blue color didn’t change during the increase in immobilization of the PDAVs, implying the conjugation length of the polydiacetylene backbone was not changed.
Figure 6.
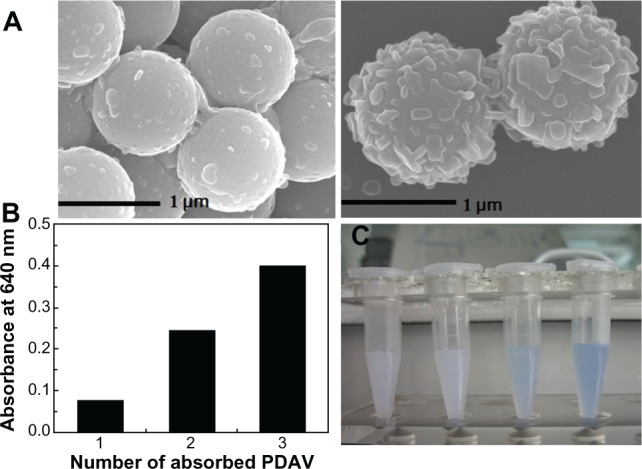
(A) Scanning electron microscopy images of polystyrene polydiacetylene vesicle (PS@PDAV) microspheres composed of different quantities of PDAV. One layer of PDAV adsorbed onto PS microspheres (left) and completed microspheres with optimized PDAV adsorption (right). (B) UV-visible absorbance (640 nm) of PS@PDAV microspheres with different quantities of PDAV. (C) The color of PS@PDAV microspheres coated with different quantities of PDAV (from left to right, the PDAV quantities were, respectively, 0 layers, 1 layer, 2 layers, and 3 layers).
To understand the relationship between the immobilized PDAV numbers in PS@PDAV-anti-H5N1 and the ability for HAQ detection, a series of PS@PDAV-anti-H5N1 with different layers of PDAVs were reacted with HAQ. Fluorescence response measured by LSCM showed that the detection sensitivity was increased as the number of immobilized PDAVs increased, exhibiting a new way for enhancing the detection sensitivity of a PDAV-based biosensor.
Before the detailed recognition of H5N1 virus, we optimized the concentration of anti-H5N1. Among a series of dilute concentrations, the detection sensitivity was best at a concentration of 1:3000 (see Supplementary materials). In our experiment, interestingly, the quantity of PDAVs adsorbed on the microspheres also affected the sensitivity of detection. The experiments were performed at the optimal concentration of anti-H5N1 for H5N1 (30 ng/mL) detection using different quantities of PDAV composite microspheres (one layer, two layers, and three layers), as shown in Figure 7. We found that three layers of PDAV-adsorbed microspheres were the most sensitive for reorganization.
Figure 7.
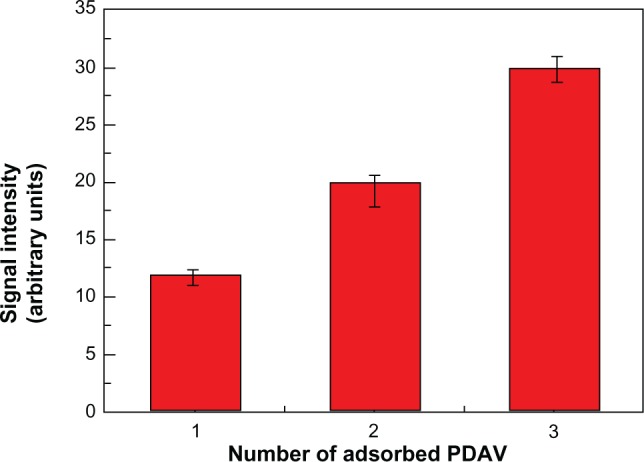
Fluorescence response of polystyrene polydiacetylene vesicle (PDAV) microspheres with different PDAV quantity for H5N1 virus detection at 30 ng/mL (antibody concentration was 1:3000).
Notes: The fluorescence signal was collected by laser-scanning confocal microscopy and calculated by Image-pro plus 5.0 software (Media Cybernetics, Rockville, MD, USA). From left to right, the number of PDAV layer was one, two, and three layers.
Rapid, naked-eye detection of HAQ
Figure 8A is an illustration of a chromatic immunoassay using anti-H5N1 microspheres for HAQ detection. Different concentrations of HAQ, including an HAQ-free control, were added to blue BSA-blocked anti-H5N1 microsphere solution. The chromatic change of PDA from blue to red occurred quickly (≤30 minutes). Figure 8B shows the UV-visible spectra at anti-H5N1 concentrations of 0 ng/mL, 20 ng/mL, 30 ng/mL, 50 ng/mL, and 60 ng/mL. As the HAQ concentration increased, the absorption peak at 640 nm gradually shifted to 540 nm.
Figure 8.
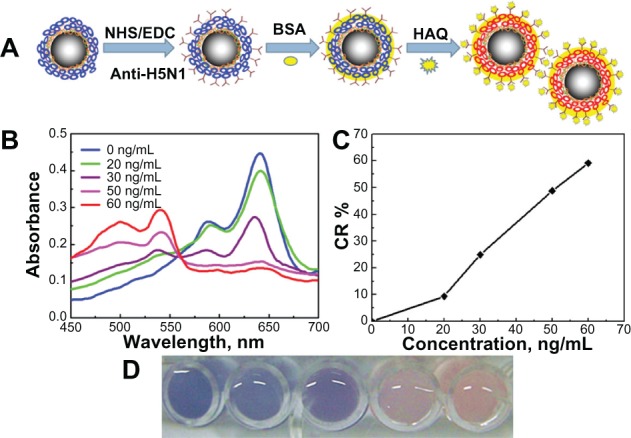
(A) Schematic illustration of a chromatic immunoassay using anti-H5N1 microspheres for HAQ detection. The carboxylic acid units of anti-H5N1 microspheres were treated with N-hydroxysuccinimide (NHS) and 1-ethyl-3-(3-dimethylaminopropyl) carbodiimide (EDC) to attach with anti-H5N1. Bovine serum albumin (BSA) was used to avoid nonspecific adsorption. When HAQ was added into the blue solution of polystyrene polydiacetylene vesicle anti-H5N1, the specific immunoreactions occurred and caused a red solution. (B) Absorbance spectra at different concentrations. (C) Colorimetric response (CR%) calculated from (B) at different concentrations. (D) Photograph images.
Notes: Analyte concentrations used (from left to right): 0 ng/mL, 20 ng/mL, 30 ng/mL, 50 ng/mL, and 60 ng/mL.
This result demonstrates that disturbance of the PDA backbone occurred when HAQ linked to the conjugated anti-H5N1 antibodies.22 The color change of the solution could be easily observed by the naked eye, as shown in Figure 8. According to the literature, the limit of detection for the target analyte was defined as a CR% value of approximately 10–15.23 Based on the data presented in Figure 8, a limit of detection for HAQ of approximately 30 ng/mL was obtained, meeting the needs of fast and simple color-changeable detection.
High-sensitivity detection of HAQ by using LSCM
Although reinforced anti-H5N1 PS@PDAV microspheres have many merits, the low detection sensitivity determined using the UV-visible spectra restricts their application in some cases. Measuring the fluorescence of PS@PDAV-anti-H5N1 induced by recognizing HAQ improved the lower limit of detection significantly. Fluorescent rings of varied brightness, as determined by LSCM, characterized the signal. The concentration of HAQ was quantified from the fluorescent intensity of the rings, as calculated by Image-pro plus 5.0 software. Figure 9 shows LSCM images and fluorescent intensities of different-concentration HAQ (0 ng/mL, 0.1 ng/mL, 1 ng/mL, 5 ng/mL, 10 ng/ mL, 50 ng/mL, and 100 ng/mL). From the LSCM images, we can see that both the signal intensity and the brightness of the images increased as the concentration of HAQ increased from 0 ng/mL to 100 ng/mL. As a result, a limit of detection of 1 ng/mL was obtained.
Figure 9.
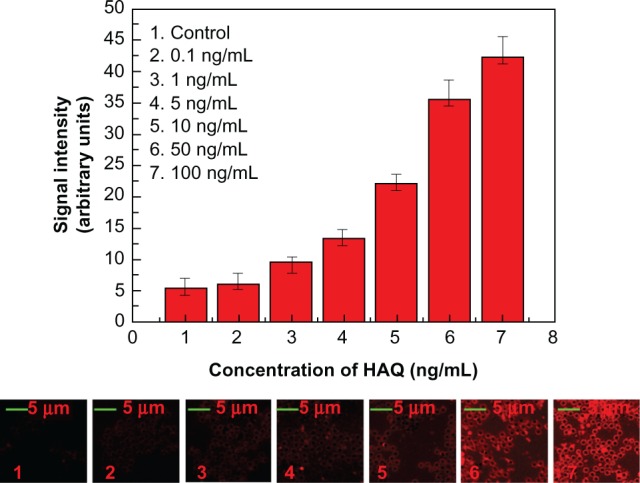
Fluorescence signals using anti-H5N1 and relative laser-scanning confocal microscopy images for HAQ at various concentrations: 0 ng/mL, 0.1 ng/mL, 1 ng/mL, 5 ng/mL, 10 ng/mL, 50 ng/mL, 100 ng/mL.
To investigate the detection specificity of anti-H5N1 antibody-conjugated microspheres, other biomolecules such as MC-LR, human immunoglobulin G, and Escherichia coli were detected for comparison. The concentration of each analyte was 50 ng/mL. Figure 10 shows that no LSCM signal was observed for the high concentration of any of the analytes tested, demonstrating the high specificity of HAQ detection by anti-H5N1 antibody-conjugated microspheres.
Figure 10.
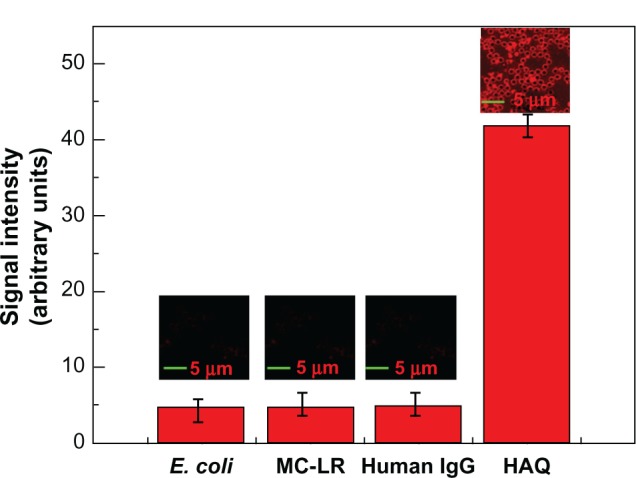
Laser-scanning confocal microscopy images (the upper parts) and the corresponding signal intensity calculated by Image-pro plus 5.0 software (Media Cybernetics, Rockville, MD, USA) (the red columns).
Notes: From left to right in the figure are the image and response of anti-H5N1-conjugated microsphere reacted with the following analytes: Escherichia coli, microcystin-LR, human immunoglobulin G, and HAQ. Scale bars, 5 μm.
Conclusion
This study describes an approach to the preparation of an effective biosensor for H5N1 recognition on a reinforced composite structure composed of PDAVs deposited on PS microspheres. It overcomes the unstable transducer property of PDAVs, which often change their color due to the insertion or conjugation of biological probes. The as-prepared reinforced chromatic assay is robust and easy to operate, easy to purify under centrifuge and redisperse just by shaking with the hand, keeping its form and chromatic property after passing through the microfluid channel. Although the exact mechanism of the reinforcement effect is not clear yet, the phenomenon itself has already shown great significance in application. Further study of the mechanism of this finding and its sensitivity improvement by changing the structure as well as the environment factors for the practical application will be an attractive area for research in the future.
Acknowledgments
This work was supported by the National Natural Science Foundation of China (20933007, 21021003, 91127012, 21161130521, KJCX2-YW-H18, and 0760621234).
Footnotes
Disclosure
The authors report no conflicts of interest in this work.
Supplementary materials
Preparation of positively charged PS microspheres
The positively charged PS microspheres were prepared as follows. As shown in Figure S1, 1 mg/mL solutions (containing 0.1 M NaCl) of PEI and poly(sodium 4-styrenesulfonate) were added into the negatively charged PS microspheres (sulfate-sta-bilized zeta potential ≈ –28.6 mV) solution (approximately 1.4 wt% in water) alternatively. The reaction lasted for 20 minutes, each time followed with four repeated centrifugations (4000 g) to remove excess polyelectrolyte with water washing. This process was repeated several times until the PS microspheres were coated with three layers of polyelectrolyte.
Size characterization of PDAVs and PS@PDAV microspheres
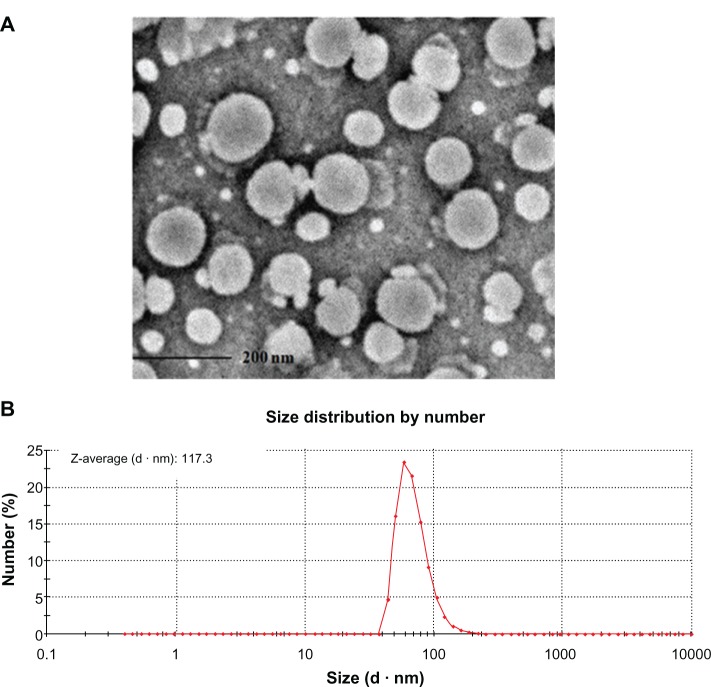
As shown in Figure S2, from the TEM and the dynamic light scattering data, the average size of PDAV was about 117 nm. From Figure S3, after immobilization of the PDAVs, the size of the PS@PDAV microspheres was changed compared with PS microspheres.
Figure S2.
(A) TEM image of PDAV. The scale bar was 200 nm. (B) the size distribution of PDAV measured by Zeta potential measurement.
Figure S3.
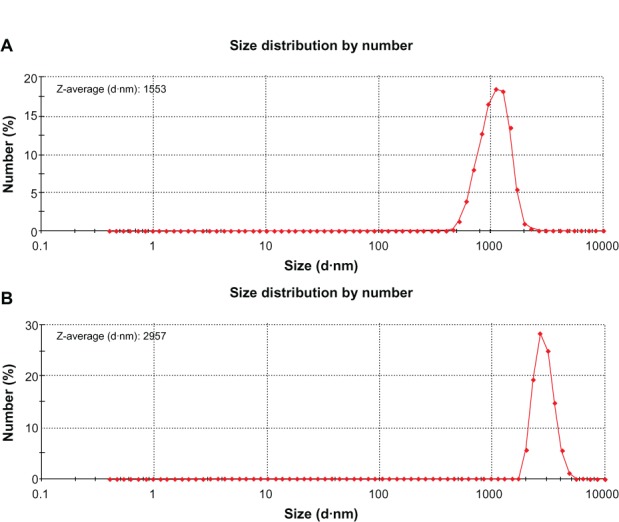
The size distribution of PS microspheres (A) and PS@PDAV microspheres (B) measured by using Zeta potential measurement.
The average size was 1.29 μm and the standard deviation (SD) was 9%, as shown in Figure S4. By demographic analysis, the mean particle size of PS@PDAV microspheres is approximately 1.3 μm with an SD of 9%. Statistically, 67% of the particles are on a scale between 1.25 μm and 1.35 um, among which particles of 1.3 μm account for approximately 26% of the total. Therefore, the final size of the PS@PDAV microspheres increased to approximately 1.3 μm, and the final spheres are of a uniform large-scale morphology.
Figure S4.
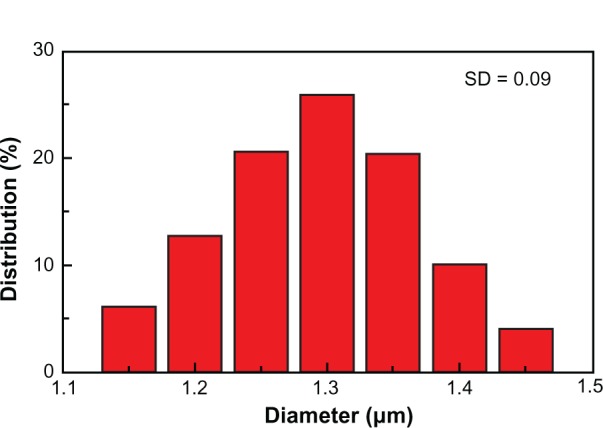
Size distribution of PS@PDAV microspheres based on the SEM measurement.
LSCM analysis of PS@PDAV microspheres
When exposed to external stimuli, the backbone of PDAVs would be disturbed and cause a pronounced color change from blue to red. The red PDAVs showed a fluorescence property when excited by a certain-wavelength laser. To characterize PDAV adsorption onto PS microspheres further, the assemblies were observed by LSCM. A 100 × UPLS APO oil objective lens (NA = 1.4) was used for observation, and excitation and emission were recorded at 515 and 527 nm, respectively. Figure S5A and B show LSCM images of blue PS@PDAV microspheres and red PS@PDAV microspheres, respectively. These images indicate that blue PS@PDAV microspheres failed to fluoresce and appeared black in LSCM, while red PS@PDAV microspheres emitted a bright ring of fluorescence when excited by a 515 nm laser. In the magnifed image of red PS@PDAV composites (Figure S5C), the fluorescence-intensity distribution analysis of a random microsphere was analyzed using Image-Pro Plus 5.0 software. From the distribution diagram, the intensity inside the composite bead was clearly weaker than the intensity on the outside, and it was approximately equal at a symmetrical site outside the bead. These results verified that the PDAVs were successfully immobilized on the PS microspheres, and the lipid coverage appeared to be uniform.
Figure S5.
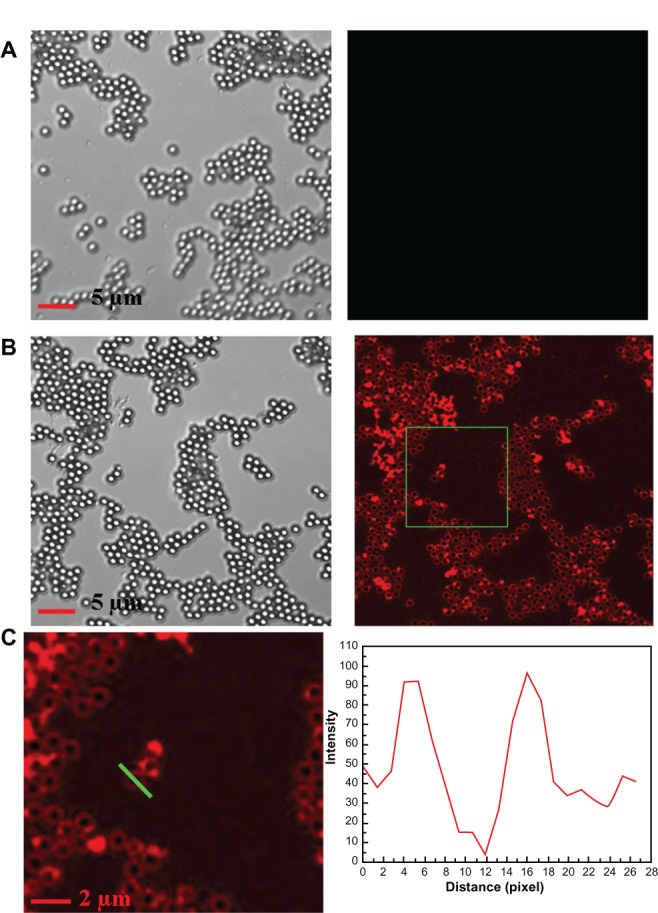
(A) LSCM images of blue PS@PDAV microspheres; (B) LSCM images of the red PS@PDAV microspheres; (C) Magnifed image of a part of (B) and fluorescence intensity distribution along the straight, green line.
Optimization of anti-H5N1 antibody concentration for detection of HAQ
These experiments were performed with uniform conditions and H5N1 virus concentration to determine the optimal concentration of anti-H5N1 antibody. Here, microspheres with three layers of PDAVs were used. Free carboxylic acid moieties of PDA on the outsides of the microspheres were treated with NHS and EDC to permit conjugation with the amino group of anti-H5N1. To avoid nonspecific absorption to the vessel wall, a 150 μg/mL BSA solution was added. Then, anti-H5N1 microspheres were prepared with antibody diluted to 1:2000, 1:3000, 1:4000, and 1:5000. Anti-H5N1 microspheres were incubated for 20 minutes at 36°C, followed by addition of HAQ (30 ng/ mL). Samples were then spotted quantitatively onto slides and dried at low temperature. The fluorescence signals were collected by LSCM using uniform conditions (based upon the strongest intensity to avoid overexposure) and analyzed using Image-Pro Plus 5.0 software, as shown in Figure S6.
Figure S6.
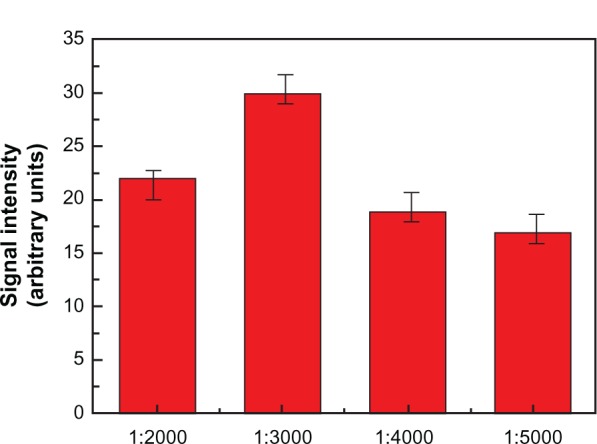
Fluorescence responses measured by LSCM when different concentration of anti-H5N1 (1:2000, 1:3000, 1:4000 and 1:5000) reacted with 30 ng/mL HAQ.
References
- 1.Lu Y, Yang Y, Sellinger A, et al. Self-assembly of mesoscopically ordered chromatic polydiacetylene/silica nanocomposites. Nature. 2001;410(6831):913–917. doi: 10.1038/35073544. [DOI] [PubMed] [Google Scholar]
- 2.Chae SK, Park H, Yoon J, Lee CH, Ahn DJ, Kim JM. Polydiacetylene supramolecules in electrospun microfbers: fabrication, micropatterning, and sensor applications. Adv Mater. 2007;19(4):521–524. [Google Scholar]
- 3.Jonas U, Shah K, Norvez S, Charych DH. Reversible color switching and unusual solution polymerization of hydrazide-modified diacetylene lipids. J Am Chem Soc. 1999;121(19):4580–4588. [Google Scholar]
- 4.Kew SJ, Hall EAH. pH response of carboxy-terminated colorimetric polydiacetylene vesicles. Anal Chem. 2006;78(7):2231–2238. doi: 10.1021/ac0517794. [DOI] [PubMed] [Google Scholar]
- 5.Nallicheri RA, Rubner MF. Investigations of the mechanochromic behavior of poly(urethane-diacetylene) segmented copolymers. Macromolecules. 1991;24(2):517–525. [Google Scholar]
- 6.Tashiro K, Nishimura H, Kobayashi M. First success in direct analysis of microscopic deformation mechanism of polydiacetylene single crystal by the X-ray imaging-plate system. Macromolecules. 1996;29(25):8188–8196. [Google Scholar]
- 7.Lee J, Kim HJ, Kim J. Polydiacetylene liposome arrays for selective potassium detection. J Am Chem Soc. 2008;130(15):5010–5011. doi: 10.1021/ja709996c. [DOI] [PubMed] [Google Scholar]
- 8.Yoon J, Jung YS, Kim JM. A combinatorial approach for colorimetric differentiation of organic solvents based on conjugated polymer-embedded electrospun fbers. Adv Funct Mater. 2009;19(2):209–214. [Google Scholar]
- 9.Cornell BA, Braach-Maksvytis VLB, King LG, et al. A biosensor that uses ion-channel switches. Nature. 1997;387(6633):580–583. doi: 10.1038/42432. [DOI] [PubMed] [Google Scholar]
- 10.Trester-Zedlitz M, Kamada K, Burley SK, Fenyö D, Chait BT, Muir T W. A modular cross-linking approach for exploring protein interactions. J Am Chem Soc. 2003;125(9):2416–2425. doi: 10.1021/ja026917a. [DOI] [PubMed] [Google Scholar]
- 11.Jelinek R, Okada S, Norvez S, Charych D. Interfacial catalysis by phospholipases at conjugated lipid vesicles: colorimetric detection and NMR spectroscopy. Chem Biol. 1998;5(11):619–629. doi: 10.1016/s1074-5521(98)90290-3. [DOI] [PubMed] [Google Scholar]
- 12.Reichert A, Nagy JO, Spevak W, Charych D. Polydiacetylene liposomes functionalized with sialic acid bind and colorimetrically detect infuenza virus. J Am Chem Soc. 1995;117(2):829–830. [Google Scholar]
- 13.Jelinek R, Kolusheva S. Polymerized lipid vesicles as colorimetric biosensors for biotechnological applications. Biotechnol Adv. 2001;19(2):109–118. doi: 10.1016/s0734-9750(00)00064-1. [DOI] [PubMed] [Google Scholar]
- 14.Jun BH, Baek J, Kang H, Park YJ, Jeong DH, Lee YS. Preparation of polydiacetylene immobilized optically encoded beads. J Colloid Interface Sci. 2011;355(1):29–34. doi: 10.1016/j.jcis.2010.12.018. [DOI] [PubMed] [Google Scholar]
- 15.Nie Q, Zhang Y, Zhang J, Zhang M. Immobilization of polydiacety-lene onto silica microbeads for colorimetric detection. J Mater Chem. 2006;16(6):546–549. [Google Scholar]
- 16.Charych D, Nagy J, Spevak W, Bednarski M. Direct colorimetric detection of a receptor-ligand interaction by a polymerized bilayer assembly. Science. 1993;261(5121):585–588. doi: 10.1126/science.8342021. [DOI] [PubMed] [Google Scholar]
- 17.Ma Z, Li J, Liu M, et al. Colorimetric detection of Escherichia coli by polydiacetylene vesicles functionalized with glycolipid. J Am Chem Soc. 1998;120(48):12678–12679. [Google Scholar]
- 18.Reimer C, Baker R, vanFrank R, Newlin TE, Cline GB, Anderson NG. Purifcation of large quantities of infuenza virus by density gradient centrifugation. J Virol. 1967;1(6):1207–1216. doi: 10.1128/jvi.1.6.1207-1216.1967. [DOI] [PMC free article] [PubMed] [Google Scholar]
- 19.Wang D, Rogach AL, Caruso F. Semiconductor quantum dot-labeled microsphere bioconjugates prepared by stepwise self-assembly. Nano Lett. 2002;2(8):857–861. [Google Scholar]
- 20.Xia Y, Deng J, Jiang L. Simple and highly sensitive detection of hepatotoxin microcystin-LR via colorimetric variation based on poly-diacetylene vesicles. Sens Actuators B Chem. 2010;145(2):713–719. [Google Scholar]
- 21.Han J, Zhang J, Xia Y, Li S, Jiang L. An immunoassay in which magnetic beads act both as collectors and sensitive amplifers for detecting antigens in a microfluidic chip (MFC)-quartz crystal microbalance (QCM) system. Colloids Surf A Physicochem Eng Asp. 2011;379(1–3):2–9. [Google Scholar]
- 22.Deng J, Sheng Z, Zhou K, Duan M, Yu CY, Jiang L. Construction of effective receptor for recognition of avian infuenza H5N1 protein HA1 by assembly of monohead glycolipids on polydiacetylene vesicle surface. Bioconjug Chem. 2009;20(3):533–537. doi: 10.1021/bc800453u. [DOI] [PubMed] [Google Scholar]
- 23.Su Y, Li J, Jiang L. Chromatic immunoassay based on polydiacetylene vesicles. Colloids Surf B Biointerfaces. 2004;38(1–2):29–33. doi: 10.1016/j.colsurfb.2004.08.010. [DOI] [PubMed] [Google Scholar]


