

Abstract
Hurler syndrome (MPS-IH) is a rare autosomal recessive lysosomal storage disease. Besides a variety of other features, Hurler syndrome is characterized by a range of skeletal abnormalities known as dysostosis multiplex. Despite the successful effect of haematopoietic stem cell transplantation on the other features, dysostosis remains a disabling symptom of the disease. This study analyzed the status and development of the orthopaedic manifestations of 14 Dutch Hurler patients after stem cell transplantation.
Data were obtained retrospectively by reviewing patients’ charts, radiographs and MRIs. Existing methods to measure the deficiencies were modified to optimally address the dysostosis. These measurements were done by two of the authors independently. The odontoïd/body ratio, kyphotic angle, scoliotic angle and parameters for hip dysplasia and genu valgum were measured and plotted against age. The degree of progression was determined. The intraclass correlation coefficient (ICC) was calculated to determine the reliability of the measurements.
All patients showed hypoplasia of the odontoïd, which significantly improved during growth. Kyphosis in the thoracolumbar area was present in 13 patients and proved to be progressive. Scoliosis was observed in eight patients. Hip dysplasia was present in all patients and showed no tendency of improvement. In all but one patient, knee valgus remained more than two standard deviations above normal.
Dysostosis remains a major problem after haematopoietic stem cell transplantation in Hurler patients. Moreover, except for dens hypoplasia, it appears to be progressive and therefore surgical interventions may be necessary in the majority of these patients.
Introduction
Hurler syndrome, also known as Mucopolysaccharidosis type IH (MPS-IH), is a rare genetic lysosomal storage disease with an autosomal recessive inheritance pattern and an incidence of 1 in 100,000 live births (Lowry and Renwick 1971). Because of a deficiency in the enzyme α-L-iduronidase (IUDA), the glycosaminoglycans (GAGs) dermatan and heparan sulphate accumulate in the lysosomes with a detrimental effect on cells and tissues (Neufeld and Muenzer 2001). Clinical features include cognitive delay, coarse facial features, hearing loss, corneal clouding, cardiorespiratory disease, inguinal and umbilical hernias, hepatosplenomegaly, carpal tunnel syndrome and skeletal abnormalities known as dysostosis multiplex (Cleary and Wraith 1995; Muenzer et al. 2009). Without therapy, most children die in the first decade of life (Muenzer and Fisher 2004).
In 1981 Hobbs et al. described the first successful haematopoietic stem cell transplantation (HSCT) in a Hurler patient (Hobbs et al. 1981). The donor derived blood cells, with normal enzyme function, appeared to effectively arrest the further accumulation of the incompletely degraded GAGs (Boelens 2006). Currently, HSCT has become standard treatment and most patients live longer with less severe clinical features. However, despite the beneficial effect of HSCT on cognitive development and many physical functions, its effect on most orthopaedic problems remains limited (Hobbs et al. 1981; Braunlin et al. 2003; Peters et al. 1998; Souillet et al. 2003; Gatzoulis et al. 1995; Vellodi et al. 1997; Weisstein et al. 2004; Field et al. 1994; Guffon et al. 1998). ‘Bone marrow transplantation does not appear to alter the natural history of the musculoskeletal disorders in Hurler syndrome…’ stated Weisstein et al. (2004). Others, however, have the impression that some musculoskeletal problems are less severe in patients who underwent HSCT compared to untreated patients (Vellodi et al. 1997; Hite et al. 2000).
Dysostosis multiplex is a general term used for the large spectrum of skeletal abnormalities in Hurler syndrome. The general phenomenon is failure of ossification and aberrant bone remodelling of which the exact pathophysiological mechanism remains to be elucidated (Field et al. 1994; van der Linden et al. 2011). Recently it was shown that a reduced cathepsin K activity, due to the accumulation of GAGs, leads to impaired osteoclast activity and decreased subepiphyseal cartilage resorption (Wilson et al. 2009). Focal failure of ossification is seen in the processus odontoideus C1, the anterosuperior quarters of the vertebral bodies at the thoracolumbar junction, the lateral roof of the acetabulum and in the lateral margin of the metaphysis of the proximal tibia (Field et al. 1994). This may lead to, respectively, hypoplasia of the dens, vertebral beaking with thoracolumbar kyphosis, hip dysplasia and genu valgum.
The vast majority of the Dutch Hurler population is treated at our institution. Since April 2003, all patients receive bone marrow transplantation and are followed systematically in agreement with the recommendations of the worldwide MPS registry initiative (Muenzer et al. 2009). With increasing size and age of the population, many questions regarding the optimal treatment of the disabling musculoskeletal abnormalities have accumulated. To answer these questions, we recently performed a systematic review on musculoskeletal deformities in Hurler disease after HSCT (van der Linden et al. 2011). An important conclusion was that systematic patient follow-up is a first requirement to gain insight in the development of these skeletal abnormalities. In a first attempt to address the natural course of these abnormalities, the aim of the present study was to retrospectively analyze the status and development of the main orthopaedic manifestations in our Hurler population. We specifically investigated the rate of progression and whether there was an interrelation of the severity of deficiencies. Furthermore, we evaluated the accuracy of several radiological measurements to monitor these deficiencies.
Methods
Patients and Data Collection
All known patients with Hurler syndrome (n = 14), confirmed by enzyme or gene assay and treated with HSCT, were analyzed. Since April 2003, the patients were monitored systematically by means of history taking, physical examination and imaging by several medical disciplines. Data were obtained by reviewing the patient charts, radiographs and magnetic resonance images (MRI) made before September 1, 2011. For the patients that underwent surgical treatment (n = 4; see also Table 2 and 3), data were included until the moment of corrective surgery. Specifically designed radiological measurements for the amount of odontoïd dysplasia, degree of kyphosis and malformation of the pelvis were done by two authors (FS and MK or RS). Established measurements quantifying the degree of scoliosis and genu valgum were done by one author (FS). All images were analyzed using a Picture Archiving and Communications System (PACS) workstation (EasyVision DX/CL/RG/Home, Phillips Medical Systems, The Netherlands). All measurements were plotted against patient age in years. If applicable, right and left measurements were done separately. The study was approved by the local ethics board.
Table 2.
Spinal deformities
| Patient no. | Odontoïd/body ratio at latest follow-up | Kyphotic angle at latest follow-up | Beaking | Disc disappearance | Anterolisthesis | Retrolisthesis | Scoliotic angle at latest follow-up | Myelum compression [level] |
|---|---|---|---|---|---|---|---|---|
| 1 | 0.8a | 56° | L1, L2 | Th12-L1 | – | – | 56° | Yes [C0-1, C2-4] |
| 2 | 1.4 | 14° | – | – | L4-L5 grade II L5-S1 grade IV |
Th12-L1 grade II | – | No |
| 3 | 1.7 | 63° | L2 | L1-L2 | L1-L2 grade II | – | 12° | No |
| 4 | 2.3 | 71° | L2, L3 | – | L1-L2 grade IV | L3-L4 grade III | 19° | No |
| 5 | 1.7 | 78°b | L1, L2 | Th12-L1 | Th12-L1 grade IV | – | 18° | No |
| 6 | 1.3 | 38° | L1 | Th12-L1 | Th12-L1 grade III | – | – | Yes [Th12- L1] |
| 7 | 1.9 | 66° | L2 | Th12-L1 | Th12-L1 grade II | L2-L3 grade II | 15° | Yes [C3] |
| L1-L2 | ||||||||
| 8 | 1.5 | 24° | L2 | – | L1-L2 grade I | L2-L3 grade I | – | No |
| 9 | 1.5 | 43° | L2 | L1-L2 | Th12-L1 grade I | L2-L3 grade III | 12° | No |
| L1-L2 grade II | ||||||||
| 10 | 1.5 | 71° | L2 | Th12-L1 | Th12-L1 grade III | L2-L3 grade III | – | No |
| L1-L2 | L1-L2 grade III | |||||||
| 11 | 1.9 | 41° | L2 | Th12-L1 | L1-L2 grade II | – | 12° | No |
| L1-L2 | ||||||||
| 12 | 1.5 | 50° | L1, L2 | – | Th12-L1 grade III | – | – | No |
| 13 | 1.9 | 42° | L1, L2 | – | Th11-Th12 grade I | – | 20° | No |
| Th12-L1 grade II | ||||||||
| 14 | 1.5 | 32° | L2 | – | L1-L2 grade II | L2-L3 grade II | – | No |
aBefore cervical decompression
bBefore thoracolumbar spondylodesis
Odontoïd Dysplasia
Measurements were done on 3 or 4 mm T2-weighted MRI images. We used the method described by Cokluk et al. that calculates odontoïd process/body C2 ratio in the midsagittal plane (Fig. 1a) (Cokluk et al. 2006). In healthy children this ratio was found to be 2 (Cokluk et al. 2006). The length of the odontoïd process was defined as the distance between the tip of the odontoïd to the remnant of the dentocentral synchondrosis, the length of the body was the distance between the remnant of the dentocentral synchondrosis to the inferior border of C2. According to Cokluk et al. an odontoïd/body ratio ≥ 2 was considered normal, a ratio ≥ 1.5 < 2 as mild hypoplasia, a ratio ≥ 1.0 < 1.5 as moderate hypoplasia and a ratio < 1.0 as severe hypoplasia of the odontoïd. The presence of increased soft tissue around the tip of the odontoïd process was scored as yes or no.
Fig. 1.
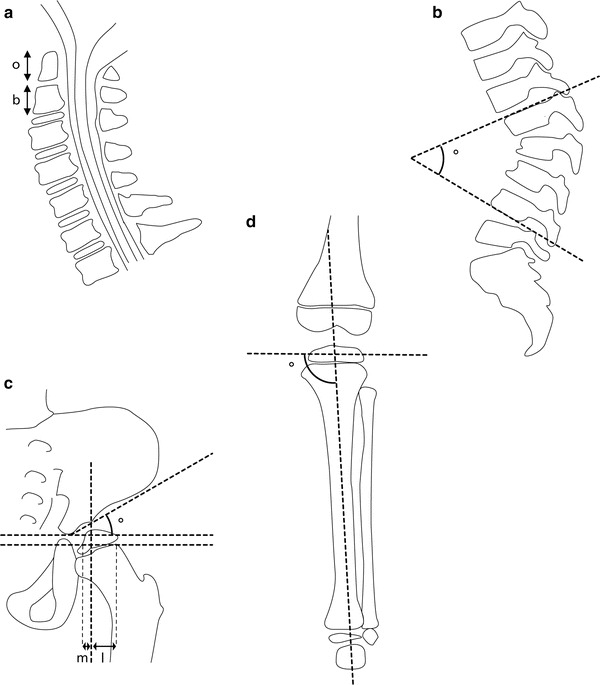
Radiological measurements: (a) The odontoïd/body ratio was calculated by dividing the length of the odontoïd process (o) by the length of the body of the 2nd cervical vertebra (b). (b) The kyphotic angle was defined as the angle over the 4 thoracolumbar vertebrae with the largest angle of kyphosis. (c) The acetabular index (AI) was defined as the angle between the horizontal Hilgenreiner’s line and the line connecting the superolateral edge of the acetabulum with the triradiate cartilage. The percentage of bony coverage was calculated by drawing the Hilgenreiner’s line and perpendicular to this a line touching the lateral border of the bony acetabulum. A line parallel to the Hilgenreiner’s line through the lateral subcapitalphyses was drawn next. By virtually connecting the metaphyseal and epiphyseal medial and lateral edges, the contour of the caput femoris was reconstructed and the intersection point with the transphyseal line was taken medially and laterally. The distance m represents the bony coverage. The percentage of coverage was calculated by dividing m by the distance m + l. (d) The medial proximal tibial angle (MPTA) was measured as the medial angle between a line drawn at the level of the tibial epiphysis, parallel to the growth plate of the proximal tibia and a line connecting the centre of the proximal tibial epiphysis to the midwidth of the talus at the ankle mortise
Thoracolumbar Spine
To quantify the maximum kyphotic angle, the angle of kyphosis over the four thoracolumbar vertebrae with the largest kyphotic angle was measured on a lateral standing or sitting radiograph of the spine without brace (Fig. 1b). Beaking of the anterior vertebral body and disappearance of the disc were scored as yes or no and its corresponding level was noted. Antero- and retrolisthesis were scored using the Meyerding classification, where each grade represents 25 % of displacement with regard to the endplate of the vertebra below (Sharrard 1993). The degree of scoliosis was determined by measuring the Cobb angle on a sitting or standing anterior-posterior radiograph of the spine. Scoliosis was defined as a Cobb angle over 10°. Patient charts were reviewed to determine whether brace therapy was applied.
Hip Dysplasia
The acetabular index (AI) of both the right and left hip were measured on a standard X-ray of the pelvis. The angle was defined as the angle between the horizontal Hilgenreiner’s line and a line connecting the superolateral edge of the acetabulum with the triradiate cartilage (Fig. 1c) (Sharrard 1993). The average of both hips of both observers was plotted. The tables of Tonnis and Brunken (1968) were used for reference values. On the basis of the AI, the hips were classified as normal (AI within 1 SD of the mean), acetabular ossification delay (1 SD < AI < 2 SD), or dysplastic (AI > 2 SD), according to the classification system used by Tönnis and Brunken (Tonnis and Brunken 1968; Tonnis 1976). The development of AI in Hurler patients was calculated, as well as graphically compared to the control population (Tonnis and Brunken 1968). Since lateral acetabular ossification failure is a characteristic feature of Hurler patients, we strived to quantify this by measuring the percentage of bone coverage of the caput femoris. We used a modified version of Reimers lateral percentage of migration by drawing lines at the AP pelvis as described below (see also Fig. 1c) (Reimers 1980). First, Hilgenreiner’s line through the triradiate cartilages with perpendicular to this, a line touching the lateral border of the bony acetabulum. Then parallel to Hilgenreiner’s line, a line through the lateral subcapital physes. By virtually connecting the metaphyseal and epiphyseal medial and lateral edges, the contour of the caput femoris was reconstructed and the intersection point with the transphyseal line was taken medially and laterally. The distance m from the medial vertical line to the bold vertical line represents the bony coverage; the percentage of coverage with respect to the distance m + l was calculated as well. The containment at the latest follow-up images (either AP radiograph or MRI) was scored as contained or dislocated.
Genu Valgum
To determine the lower limb alignment, the medial proximal tibial angle (MPTA) was measured according to Sabharwal et al. (2008). The MPTA was measured as the medial angle between a line drawn at the level of the tibial epiphysis, parallel to the growth plate of the proximal tibia and a line connecting the centre of the proximal tibial epiphysis to the midwidth of the talus at the ankle mortise (see also Fig. 1d). Since lower leg radiographs for follow-up were made of the left knee only, we analyzed the MPTAs just for the left knees. Reference values as described by Sabharwal et al. (2008) were used for comparison. Knees with an MPTA greater than the mean value plus two standard deviations were classified as having a valgus deformity.
Statistical Analysis
If applicable, the average of measurements obtained by two observers was used. To analyze the developmental changes in time, we made use of linear mixed models with fixed effects for age and random intercepts per child (Hedeker and Gibbons 2006). In the case of genu valgum, the skeletal changes are not linear, since the normal development of a knee valgus is parabolic. Therefore, a fixed quadratic term for age was included in order to better model the curve. To assess the reliability of the measurements we used, intraclass correlation coefficients (ICC) were calculated. For this purpose, we used a method described by Vangeneugden et al. (2004) which takes into account repeated measurements. To determine if the severity of one of the deformities was related to the severity of the other items, an interrelation coefficient was determined. In order to do so, we used calculated random intercepts to rank the children as per abnormality. Afterwards, an ICC of the rankings was calculated, based on the variance components from a one-way ANOVA with a random effect for patient.
Results
Patients
At the time of final data inclusion, the mean age of patients was 83 ± 27 months (range 45–126 months; see also Table 1). Successful bone marrow transplantation, defined as >10 % donor chimerism, was achieved at a mean age of 18.6 ± 8.3 months (range 8–37 months). Follow-up since transplantation ranged from 15 to 89 months (mean 52 ± 22 months). In ten cases, patients received their graft from an unrelated donor, three patients received their graft from a sibling and one patient received her graft from her mother. In five cases, successful transplantation was achieved by using bone marrow, in seven cases cord blood was used and in two cases peripheral blood. Enzyme replacement therapy (ERT) before HSCT was administered in nine patients. At the latest follow-up, there was full chimerism (≥ 95 % chimerism) in 13 patients. In one patient there was 18 % chimerism. Latest measurements of IUDA enzyme-activity showed a mean of 44 ± 21 nmol/h/mg (range 11–84 nmol/h/mg), with a normal reference range of 25–90 nmol/h/mg. GAG excretion in urine, which has age dependent reference values, ranged from 13–87 mg/mmol creatinine (mean 26.7 ± 18.9).
Table 1.
Characteristics of 14 Dutch patients with Hurler Syndrome
| Patient no. | Gender | Age at latest follow-up (months) | Age at HSCT (months) | Follow-up duration after HSCT (months) | Donor source (carrier status) | Donor material | ERT before HSCT | Chime rism (%) |
IUDA-activity (nmol/h/mg) | GAG excretion (mg/mmol creat) |
|---|---|---|---|---|---|---|---|---|---|---|
| 1 | Male | 126 | 42 | 84 | Unrelated | Peripheral blood | No | 100 | 24 | 26 |
| 2 | Female | 114 | 29 | 84 | Mother (carrier) | Bone marrow | Yes | 100 | 32 | 21 |
| 3 | Male | 112 | 29 | 83 | Unrelated | Bone marrow | No | 100 | 53 | 13 |
| 4 | Female | 109 | 8 | 101 | Unrelated | Peripheral blood | No | 18 | 11 | 26 |
| 5 | Male | 104 | 28 | 76 | Unrelated | Cord blood | Yes | 100 | 84 | 16 |
| 6 | Male | 101 | 20 | 81 | Unrelated | Cord blood | Yes | 100 | 74 | 18 |
| 7 | Male | 88 | 15 | 74 | Unrelated | Cord blood | No | 100 | 36 | Unknown |
| 8 | Female | 79 | 24 | 56 | Unrelated | Cord blood | Yes | 100 | 40 | 17 |
| 9 | Male | 67 | 13 | 54 | Sibling (carrier) | Bone marrow | Yes | 100 | 36 | 19 |
| 10 | Male | 60 | 12 | 48 | Unrelated | Cord blood | Yes | 100 | 41 | 23 |
| 11 | Female | 59 | 13 | 46 | Sibling | Bone marrow | Yes | 96 | 57 | 22 |
| 12 | Female | 59 | 12 | 47 | Unrelated | Cord blood | Yes | 100 | 66 | 25 |
| 13 | Male | 46 | 11 | 35 | Sibling (carrier) | Bone marrow | No | 98 | 26 | 34 |
| 14 | Male | 33 | 19 | 26 | Unrelated | Cord blood | Yes | 100 | 29 | 87 |
HSCT haematopoietic stem cell transplantation, ERT enzyme replacement therapy, IUDA-activity α-l-iduronidase activity, GAG excretion glycosaminoglycan excretion
Odontoïd Hypoplasia
An MRI of the cervical spine was available for all patients. All patients had hypoplasia of the dens on their first MRI (odontoïd/body ratio below 2 (Cokluk et al. 2006); see also Table 2, Figs. 2a, 3). Aplasia was not seen. Severe hypoplasia (a ratio below 1) was seen in one patient. On the most recent MRI studies, two patients showed moderate odontoïd hypoplasia (≥ 1.0 < 1.5), ten patients showed mild hypoplasia (≥ 1.5 < 2) and one a normal odontoïd/body ratio (> 2). During growth, the odontoïd/body ratio increased in 11 patients, decreased in one patient and remained unchanged in two patients. In general, a slight but significant improvement in odointoïd/body ratio was seen (slope value 0.066 per year; 95 % C.I. 0.04–0.09). The ICC for this measurement technique was 0.74, which is generally interpreted as good or strong. Based on the radiological reports, increased soft tissue around the tip of the odontoïd process was observed in all 14 patients.
Fig. 2.
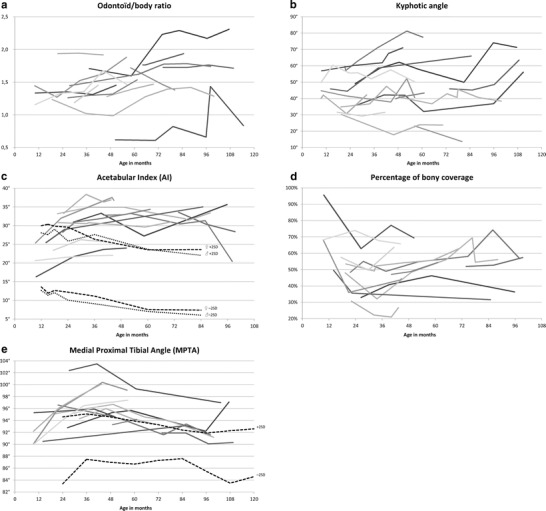
Progression of the skeletal abnormalities of the Hurler patient population over time: (a) odontoid/body ratio, (b) maximum kyphotic angle, (c) acetabular index, (d) percentage of bony coverage of the caput femoris, and (e) medial proximal tibial angle (MPTA). All measurements are plotted against patient age. Each line represents an individual patient. Reference lines of ± 2 standard deviations (SD) of the mean, are based on the data of Tonnis and Brunken (1968) for the acetabular index (c) and Sabharwal et al. (2008) for the MPTA (e)
Fig. 3.

Example of odontoïd hypoplasia. Illustrated is a T2 weighted MRI of the midsagittal cervical spine of a 5 year old female patient. The body of C2 and odontoid process can clearly be observed with in-between the dentocentral synchondrosis. This patient had an odontoid/body ratio of 1.4, which was classified as moderate hypoplasia
Thoracolumbar Kyphosis
Full weight bearing radiographs of the total spine were available for all patients. Kyphosis in the thoracolumbar area was present in 13 cases (see Table 2, Figs. 2b, 4a). A total of seven patients had had an attempt to control their kyphosis in a brace. However, in most cases, bracing was abandoned because of discomfort and absence of effect. The average angle of kyphosis at first presentation ranged from 23–60° (mean 42 ± 10.4°). At the latest follow-up visit, and in one case before corrective surgery, it ranged from 14 to 78° (mean 49 ± 19.1°). The kyphotic angle showed a slight but significant progression of 1.7° per year (95 % C.I. 0.82–2.5). The ICC of our measurement technique was 0.84, which is considered excellent. There were six patients that showed a considerable increase of >10°, the remaining eight were quite stable. All 13 patients with a kyphotic angle >20° showed signs of anteriorinferior beaking. The anterior part of the vertebral body of L2 was most often affected (12/13), sometimes in combination with L1 (4/13) or L3 (1/13). Isolated beaking of L1 was observed in one patient. Disc disappearance at the level of Th12-L1 and/or L1-L2 was seen in eight patients. Spondylolisthesis at the thoracolumbar level, grade I-IV, was seen in 12 patients. A total of seven of these patients also showed signs of lumbar retrolisthesis, below the level of the kyphosis, ranging from grade I–III.
Fig. 4.

Example of a thoracolumbar kyphosis. (a) Lateral radiograph of the thoracolumbar spine of a 5 year old sitting male patient. There is an obvious kyphosis of 78°, measured between T11 and L2, in addition to anterior beaking of T12 and L1 and severe spondylolisthesis of T11. (b) Radiograph after revision of an initial short segment posterior spinal fusion (Th11-L3) in the patient shown in Fig. 4a. To maintain correction, the segment above was fixated with a growing rod system
One of the patients (patient 5, see Table 2), with a progressive kyphotic angle > 80° was treated surgically. A short segment posterior fusion Th12 to L3 was done after pedicle subtraction osteotomy of L1. This resulted in a reduction from 80 to 12°. Unfortunately, the kyphosis of the segment superior to the spondylodesis progressed to 64° within 13 months. This was treated with a revision of the spondylodesis at the level of T11-L4 and superior extension with a growing rod system, which reduced the kyphosis to 14° (see also Fig. 4b). At the latest follow-up visit, 18 months after the revision, the kyphotic angle had again increased to 35°.
Scoliosis
Scoliosis (Cobb angle >10°) was observed in eight patients (57 %; see Table 2 for characteristics). Mostly, scoliosis became manifest around 4 years of age. At the latest follow-up visit, the scoliotic angle ranged from 12–56° (mean 20 ± 14.8°). Statistical analysis indicated a nonsignificant slight progression of 2.5° per year (95 % C.I. –0.03–5.1).
Spinal Cord Involvement
A full spine MRI was available for all patients. Asymptomatic narrowing of the spinal canal with signs of mild spinal cord compression on the T2-weighted images was found in two patients (pt. no. 6 at level Th12-L1 and pt. no. 7 at level C3: see also Table 2). Another patient developed a symptomatic cervical myelopathy at 85 months of age (pt. no.1, level C0-1 and C2-4). This patient was treated with a cervical decompression without fusion elsewhere, but developed a progressive kyphosis with neurological symptoms at and above the level of the decompression. Subsequently, a posterior spondylodesis from the occiput to C4 was done in combination with decompression of the foramen magnum. The fusion was still stable 18 months after surgery, and the patient regained some function. However, the strength of his right arm remained decreased (MRC 4/5).
Hip Dysplasia
Multiple radiographs of the pelvis were available for all but one patient. Another patient showed such a deformed acetabulum that adequate measurements were impossible. In the remaining patients (n = 12), the average AI at presentation was 28 ± 6.0° (range 15–35°) for the left and 28 ± 6.4° (range 18–37°) for the right hip (see Fig. 2c and Table 3). At the latest follow-up visit, the mean AI was 30 ± 7.1° (range 16–38°) at the left and 31 ± 6.1° (range 21–38°) at the right side. Although it seems that the right and left hip were almost similarly affected, the similarity within patients was rather poor with an ICC of only 0.53. In eight patients, an increase in the average AI of both hips was seen, indicating worsening of the hip dysplasia (see Fig. 5 for an example). Only two patients showed a decrease in the average AI of both hips over time, as seen in a healthy population. Another two patients showed neither improvement nor worsening of the AI. Overall, the AI increased minimally with an average angle of 0.37° per year (95 % C.I. –0.086–0.82, not significant). The interobserver ICC of the AI angle was 0.66 per hip, which is considered fair to moderate.
Table 3.
Measurements of the hips and knee at latest follow-up
| Patient no. | Left hip | Right hip | Left knee | ||
|---|---|---|---|---|---|
| AI | Percentage of bony coverage | AI | Percentage of bony coverage | MPTA | |
| 1 | 55° | 0 %b | 53° | 0 %b | 97° |
| 2 | 37° a | 31 %a | 31° a | 35 %a | – |
| 3 | 26° c | 58 %c | 31° c | 57 %c | 90° |
| 4 | 35° | 36 % | 37° | 37 % | 97° |
| 5 | 16° | 63 % | 25° | 51 % | 92° |
| 6 | 30° | 56 % | 37° | 57 % | 91° |
| 7 | 34° | 41 % | 36° | 22 % | 93° |
| 8 | 36° | 57 % | 26° | 69 % | 93° |
| 9 | 38° | 49 % | 31° | 60 % | 94° |
| 10 | 23° | 78 % | 25° | 61 % | 95° |
| 11 | 36° c | 46 %c | 38° c | 43 %c | 99° |
| 12 | 24° | 67 % | 21° | 65 % | 97° |
| 13 | 38° | 18 % | 36° | 35 % | 100° |
| 14 | 26° | 63 % | 25° | 64 % | 96° |
AI acetabular index, MPTA medial proximal tibial angle
aOnly one follow-up visit available
bPatient with bilateral hip luxation
cBefore corrective surgery (Pemberton with femoral osteotomy)
Fig. 5.
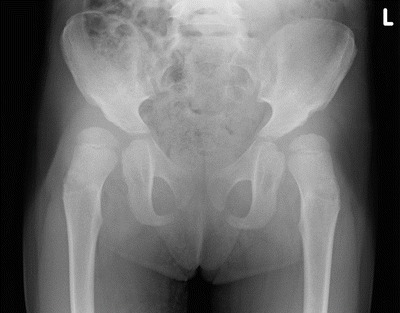
Example of hip dysplasia. Illustrated is a pelvic radiograph of a 3.5 year old female patient with bilateral hip dysplasia. Note the lateral acetabular failure of ossification. The AI in this patient was 38° on the right and 36° on the left side. The percentage of bony coverage was, respectively, 43 % and 46 %
The percentage of bony coverage appeared to remain quite stable with an initial value of 54 ± 19.9 % (range 26–100 %) for the left and 54 ± 16.0 % (range 35–91 %) for the right hip, and average values of, respectively, 53 ± 15.9 % (range 18–78 %) for the left and 52 ± 14.4 % (range 22–69 %) for the right hip at latest follow-up (0.66 % per year; 95 % C.I. –0.47–1.8, not significant). Again, the similarity between the left and right side was moderate with an ICC of 0.66. There was an increase in seven and a decrease in five patients. The interobserver ICC of this measurement was a fair 0.59. All patients showed some degree of failure of ossification at the lateral acetabulum, delayed ossification of the femoral head and coxa valga. Therefore, we did not attempt to score subluxation separately. Only the oldest patient (patient no. 1), who received successful HSCT relatively late, at 37 months of age, developed bilateral hip dislocations at the age of 40 months. This situation has been accepted. In two patients we treated the bilateral severe hip dysplasia at the age of, respectively, 4 years and 1 month (pt. no. 11) and 7 years and 11 months (pt. no. 3; see Table 3) with a combination of a Pemberton osteotomy and proximal femoral osteotomy.
Genu Valgum
Radiographs were available for all but one patient. Compared to the values described by Sabharwal et al., all patients in our study appeared to have an MPTA far above the mean of healthy children of similar age (see Fig. 2e and Table 3) (Sabharwal et al. 2008). In all but one patient the increase was more than two standard deviations, at least once in their life, indicating a valgus deformity (see Fig. 6 for an example). At initial presentation, the average MPTA for the left knee was 94 ± 3.3° (range 90–102°). At latest follow-up, a mean MPTA of 95 ± 3.1° (range 90–100°) was found. Like healthy children, the included patients showed a parabolic knee development with a maximum MPTA between 3 and 5 years of age. This appears to be delayed as compared to the healthy population, where this maximum is reached around the age of 2 years (Sabharwal et al. 2008). None of the patients were surgically treated for their valgus deformity during the course of this study.
Fig. 6.

Example of genu valgum. Illustrated is a long leg radiograph of a 3.5 year old male patient. The left valgus angle was 12° with an MPTA of 100°
Correlation Between Abnormalities
We could not demonstrate an interrelation between the severity of the different dysostosis multiplex manifestations within the subjects. However, as could be expected, a significant correlation between the acetabular index and the percentage of bony coverage of the caput femoris existed.
Discussion
In the current study, we collected data to evaluate the prevalence, progression and interrelation of the orthopaedic manifestations in the Dutch Hurler patient population. Although the general Hurler manifestations after stem cell transplantation were less severe compared to untreated patients, all patients showed worrisome dysostosis multiplex without improvement. More specifically, odontoïd dysplasia, kyphosis, spondylolisthesis, scoliosis, hip dysplasia and genu valgum were frequently observed.
Thoracolumbar kyphosis was present in nearly all patients regardless of the use of brace treatment. It usually occurred in combination with anterior beaking of L1 or L2, and disappearance of the intervertebral disc at the apex of the deformity. The radiological method we used, measuring the maximal angle between the four vertebrae at the apex of the kyphosis, is not clearly described in literature but appeared to work well with a very acceptable interobserver variability. During follow-up, the patients had a significant progression in their kyphotic angle. A progression of more than 10° was observed in nearly half of the patients. This could not be related to the presence of vertebral beaking or disc disappearance, but seemed related instead to larger kyphotic angles at initial presentation (see also Fig. 2b). How to treat these patients remains an important question. Short segment posterior fusions seem insufficient, possibly because the posterior ligamentous tether is deficient in this disorder as well. We used a growing rod extension over a short posterior fusion in one revision case, also with limited success because of the inherent kyphogenic tendency. The optimal solution for this problem has not been described yet. As suggested in our recent literature review, short segment anterior fusions combined with posterior stabilization may be required (van der Linden et al. 2011; Dalvie et al. 2001). Another potential way to avoid failure might be stabilization over a longer trajectory or earlier intervention. The patient that was operated on in the current study had a kyphotic angle of approximately 80°. However, we now consider a kyphosis angle > 60° an indication for surgery, since it is very likely that the angular deformity will progress from this point, resulting in unacceptable deformities in adult life (van der Linden et al. 2011). In addition to the kyphosis, the other frequently observed spinal deformities like antero-, retrolisthesis and scoliosis may require surgical treatment at some point in time as well.
The majority of patients showed mild to moderate odontoïd hypoplasia, which improved during follow-up. When critically reviewing the existing literature on Hurler´s disease, we found that dens hypoplasia was recently described in a similar manner in 30 Hurler patients (Miebach et al. 2011). Unfortunately, this paper reported absolute dens lengths instead of the ratio between the vertebral body and dens as described by Cokluk et al. (2006). Other papers on dens hypoplasia in Hurler´s disease failed to describe a clear measurement method (Vellodi et al. 1997; Hite et al. 2000; Tandon et al. 1996; Belani et al. 1993). We chose the current quantification method because it is easy to use and healthy control values are available. The interobserver reliability appeared to be good. In agreement with previous findings, dens hypoplasia improved in the large majority of patients (Hite et al. 2000; Miebach et al. 2011). The one patient that showed worsening was a patient that was not fully engrafted. When this trend continues, we believe that dens hypoplasia per se is not a major problem with respect to cervical stability or mobility in Hurler patients.
In addition to the odontoïd dysplasia, soft tissue deposition around the dense was observed in all patients as well. This is in line with the high percentage reported in our previous literature review (85.7 %, van der Linden et al. 2011). Although soft tissue deposition around the dense has often been described in Hurler’s disease (Weisstein et al. 2004; Kachur and Del Maestro 2000; Vellodi et al. 1997; Hite et al. 2000; Tandon et al. 1996), it is difficult to reliably quantify it, and reference values are lacking (Hite et al. 2000; Tandon et al. 1996). A potential serious consequence of both odontoïd hypoplasia with atlanto-axial subluxation and (extra)dural soft tissue deposition is cervical spinal cord compression, requiring surgical intervention. Cervical spinal cord compression was present in two of our patients, which is roughly in accordance with the 3.4 % reported in the literature (van der Linden et al. 2011). It is therefore, presumably, a less frequent complication in Hurler’s disease as compared to, for example, Hunter’s and Morquio’s disease (MPS II and IV), where cervical cord compression has been reported in 64 % to 100 % of the cases (Stevens et al. 1991; Parsons et al. 1996; Hughes et al. 1997).
Hip dysplasia appears to be a concern as well. Only one of our patients showed some improvement of the Acetabular Index over time. Hip dysplasia resulted in bilateral hip dislocation in one of our patients. Inspired by the good results of others (van der Linden et al. 2011; Taylor et al. 2008), we now started to surgically treat this problem with combinations of pelvic and femoral osteotomies. The clinical and technical results of the first two patients are positive. A pitfall of measuring the AI in Hurler patients was the impression of a false acetabulum on the X-ray, due to the lateral failure of ossification. Despite this knowledge, we encountered difficulties in measuring the AI reproducibly, resulting in an ICC in the fair to moderate range. The modified Reimers assessment of bony coverage of the caput femoris was even less reproducible with a fair ICC. Both measurements indicated a relatively weak correlation between the right and left hip, which means that both hips have to be addressed and followed separately in the clinic. In contrast to the healthy control population, there was no improvement of both the acetabular index and the percentage of bony coverage in the Hurler population. This can thus be considered a gradual worsening of the status of these hips. Therefore, it is likely that the vast majority of these patients will need bilateral surgical treatment to preserve hip containment in the future. As previously reported, surgical procedures to correct hip dysplasia in Hurler´s disease should always include corrections of the acetabulum (Weisstein et al. 2004; Field et al. 1994; Taylor et al. 2008; Masterson et al. 1996).
Knee valgus was obvious as well, and did not show a trend for significant improvement over time. A predictable correction of the mechanical axis of the leg in Hurler’s disease can be achieved with growth modulation techniques (Odunusi et al. 1999). This is a simple and effective method, which improves function and can be combined with other surgical interventions. Although none of our patients were treated with this technique yet, we are planning to perform this surgery in the near future. To analyze the degree of genu valgum we used the MPTA. Sabharwal et al. found an average of 89° in children from 1 to 2 years old. Between the age of 2 and 3 years, healthy children reach their peak valgus with an average angle of 91°. Thereafter the MPTA declines to an average angle of 88° in children between 8 and 9 years of age (Sabharwal et al. 2008). The tibial valgus in the Hurler population appeared to follow a similar trend; however, the peak was around 3.5–4 years of age and the valgus angle was generally more than 2SDs above normal.
Besides a correlation between the acetabular index and the percentage of bony coverage of the caput femoris, we were unable to detect a correlation between the severity of the different orthopaedic abnormalities within the individual patients. The absence of a clear interrelation between the severity of the different forms of dysostosis indicates that dysostosis cannot be generally categorized as mild or severe, but should be classified per patient per item.
An obvious limitation of this study is the retrospective design, with a relatively large variation in diagnostic delay and exact type of treatment. A subgroup of patients was treated with enzyme replacement therapy before transplantation. In addition, varying transplantation regimes were applied. Also, the spine problems of a subgroup of patients were initially treated with various bracing regimes. Furthermore, different X-ray regimes were used at first, for example sitting versus standing spine radiographs. Finally, sizes are small and preclude statistical comparisons. Since 2 years we have standardized the frequency and type of follow-up measurements according to the suggestions of the MPS registry (Muenzer et al. 2009). Hopefully this strategy will help our understanding of the disease and aid in developing new treatment algorithms.
In conclusion, dysostosis multiplex was found in all Dutch Hurler patients, despite successful bone marrow transplantation. In nearly all patients, progressive bilateral hip dysplasia was observed, which seems to warrant surgical intervention at some point. In addition, progressive thoracolumbar kyphosis was frequently observed, which did not respond well to brace treatment and short posterior segment fusion. Knee valgus was frequently observed as well, and appeared stable in most patients. If surgery for genu valgum is indicated, guided growth seems an appropriate technique. Only dens hypoplasia showed a tendency to improve over time, of which the clinical relevance remains speculative. Longer follow-up periods and a combination of our data with that of other institutes are necessary to determine more precisely how and when to optimally treat these patients.
Acknowledgements
We would like to thank assistant professor R.K. Stellato, Department of Biostatistics, Julius Center, UMC Utrecht, for her help with the statistical design and analysis of our data.
Take-Home Message
Dysostosis multiplex remains a major problem in Hurler patients after haematopoietic stem cell transplantation. Except for dens hypoplasia, it appears progressive and often requires surgical intervention.
Contribution of Individual Authors
The authors FS, MK and RS measured the degree of odontoïd dysplasia, kyphosis and malformation of the pelvis. The degree of scoliosis and genu valgum was measured by FS. Authors FS, MK and MV pooled and analyzed the data, and constructed the tables, figures and the first draft of the article. Authors FS, MK, MV, RS, PV and RC were involved in the set-up of the study, and in critically reviewing and editing the various drafts of the manuscript.
Guarantor of the Article
Dr. M.C. Kruyt
Competing Interests Statement
None of the authors have competing interests, based on the ‘Competing Interests Questions’.
Details of Funding
The authors confirm independence of sponsors.
Footnotes
Competing interests: None declared
References
- Belani KG, Krivit W, Carpenter BL, et al. Children with mucopolysaccharidosis: perioperative care, morbidity, mortality, and new findings. J Pediatr Surg. 1993;28:403–408. doi: 10.1016/0022-3468(93)90240-L. [DOI] [PubMed] [Google Scholar]
- Boelens JJ. Trends in haematopoietic cell transplantation for inborn errors of metabolism. J Inherit Metab Dis. 2006;29:413–420. doi: 10.1007/s10545-005-0258-8. [DOI] [PubMed] [Google Scholar]
- Braunlin EA, Stauffer NR, Peters CH, Bass JL, Berry JM, Hopwood JJ, Krivit W. Usefulness of bone marrow transplantation in the Hurler syndrome. Am J Cardiol. 2003;92:882–886. doi: 10.1016/S0002-9149(03)00909-3. [DOI] [PubMed] [Google Scholar]
- Cleary MA, Wraith JE. The presenting features of mucopolysaccharidosis type IH (Hurler syndrome) Acta Paediatr. 1995;84:337–339. doi: 10.1111/j.1651-2227.1995.tb13640.x. [DOI] [PubMed] [Google Scholar]
- Cokluk C, Aydin K, Rakunt C, Iyigun O, Onder A. The borders of the odontoid process of C2 in adults and in children including the estimation of odontoid/body ratio. Eur Spine J. 2006;15:278–282. doi: 10.1007/s00586-005-0946-y. [DOI] [PMC free article] [PubMed] [Google Scholar]
- Dalvie SS, Noordeen MH, Vellodi A. Anterior instrumented fusion for thoracolumbar kyphosis in mucopolysaccharidosis. Spine (Phila Pa 1976) 2001;26:E539–541. doi: 10.1097/00007632-200112010-00020. [DOI] [PubMed] [Google Scholar]
- Field RE, Buchanan JA, Copplemans MG, Aichroth PM. Bone-marrow transplantation in Hurler’s syndrome. Effect on skeletal development. J Bone Joint Surg Br. 1994;76:975–981. [PubMed] [Google Scholar]
- Gatzoulis MA, Vellodi A, Redington AN. Cardiac involvement in mucopolysaccharidoses: effects of allogeneic bone marrow transplantation. Arch Dis Child. 1995;73:259–260. doi: 10.1136/adc.73.3.259. [DOI] [PMC free article] [PubMed] [Google Scholar]
- Guffon N, Souillet G, Maire I, Straczek J, Guibaud P. Follow-up of nine patients with Hurler syndrome after bone marrow transplantation. J Pediatr. 1998;133:119–125. doi: 10.1016/S0022-3476(98)70201-X. [DOI] [PubMed] [Google Scholar]
- Hedeker D, Gibbons RD. Longitudinal data analysis. Hoboken: Wiley; 2006. [Google Scholar]
- Hite SH, Peters C, Krivit W. Correction of odontoid dysplasia following bone-marrow transplantation and engraftment (in Hurler syndrome MPS 1 H) Pediatr Radiol. 2000;30:464–470. doi: 10.1007/s002470000210. [DOI] [PubMed] [Google Scholar]
- Hobbs JR, Hugh-Jones K, Barrett AJ, et al. Reversal of clinical features of Hurler’s disease and biochemical improvement after treatment by bone-marrow transplantation. Lancet. 1981;2:709–712. doi: 10.1016/S0140-6736(81)91046-1. [DOI] [PubMed] [Google Scholar]
- Hughes DG, Chadderton RD, Cowie RA, Wraith JE, Jenkins JP. MRI of the brain and craniocervical junction in Morquio's disease. Neuroradiology. 1997;39(5):381–385. doi: 10.1007/s002340050429. [DOI] [PubMed] [Google Scholar]
- Kachur E, Del Maestro R. Mucopolysaccharidoses and spinal cord compression: case report and review of the literature with implications of bone marrow transplantation. Neurosurgery. 2000;47(1):223–228. doi: 10.1097/00006123-200007000-00046. [DOI] [PubMed] [Google Scholar]
- Lowry RB, Renwick DH. Relative frequency of the Hurler and Hunter syndromes. N Engl J Med. 1971;284:221–222. doi: 10.1056/NEJM197101282840425. [DOI] [PubMed] [Google Scholar]
- Masterson EL, Murphy PG, O'Meara A, Moore DP, Dowling FE, Fogarty EE. Hip dysplasia in Hurler’s syndrome: orthopaedic management after bone marrow transplantation. J Pediatr Orthop. 1996;16:731–733. doi: 10.1097/01241398-199611000-00006. [DOI] [PubMed] [Google Scholar]
- Miebach E, Church H, Cooper A, Mercer J, Tylee K, Wynn RF, Wraith JE. The craniocervical junction following successful haematopoietic stem cell transplantation for mucopolysaccharidosis type I H (Hurler syndrome) J Inherit Metab Dis. 2011;34:755–761. doi: 10.1007/s10545-011-9309-5. [DOI] [PubMed] [Google Scholar]
- Muenzer J, Fisher A. Advances in the treatment of mucopolysaccharidosis type I. N Engl J Med. 2004;350:1932–1934. doi: 10.1056/NEJMp048084. [DOI] [PubMed] [Google Scholar]
- Muenzer J, Wraith JE, Clarke LA, International Consensus Panel on Management and Treatment of Mucopolysaccharidosis I Mucopolysaccharidosis I: management and treatment guidelines. Pediatrics. 2009;123:19–29. doi: 10.1542/peds.2008-0416. [DOI] [PubMed] [Google Scholar]
- Neufeld EF, Muenzer J. The mucopolysaccharidoses. In: Scriver C, Beaudet A, Sly W, Valle D, Childs R, Kinzler K, editors. The metabolic and molecular bases of inherited disease. New York: McGraw Hill; 2001. pp. 3421–3452. [Google Scholar]
- Odunusi E, Peters C, Krivit W, Ogilvie J. Genu valgum deformity in Hurler syndrome after hematopoietic stem cell transplantation: correction by surgical intervention. J Pediatr Orthop. 1999;19(2):270–274. doi: 10.1097/00004694-199903000-00026. [DOI] [PubMed] [Google Scholar]
- Parsons VJ, Hughes DG, Wraith JE. Magnetic resonance imaging of the brain, neck and cervical spine in mild Hunter’s syndrome (mucopolysaccharidoses type II) Clin Radiol. 1996;51(10):719–723. doi: 10.1016/S0009-9260(96)80246-7. [DOI] [PubMed] [Google Scholar]
- Peters C, Shapiro EG, Anderson J, et al. Hurler syndrome: II. Outcome of HLA-genotypically identical sibling and HLA-haploidentical related donor bone marrow transplantation in fifty-four children. The Storage Disease Collaborative Study Group. Blood. 1998;91:2601–2608. [PubMed] [Google Scholar]
- Reimers J. The stability of the hip in children. A radiological study of the results of muscle surgery in cerebral palsy. Acta Orthop Scand Suppl. 1980;184:1–100. doi: 10.3109/ort.1980.51.suppl-184.01. [DOI] [PubMed] [Google Scholar]
- Sabharwal S, Zhao C, Edgar M. Lower limb alignment in children: reference values based on a full-length standing radiograph. J Pediatr Orthop. 2008;28:740–746. doi: 10.1097/BPO.0b013e318186eb79. [DOI] [PubMed] [Google Scholar]
- Sharrard WJW. Paediatric orthopaedics and fractures. Oxford: Blackwell Scientific Publications; 1993. [Google Scholar]
- Souillet G, Guffon N, Maire I, et al. Outcome of 27 patients with Hurler’s syndrome transplanted from either related or unrelated haematopoietic stem cell sources. Bone Marrow Transplant. 2003;31:1105–1117. doi: 10.1038/sj.bmt.1704105. [DOI] [PubMed] [Google Scholar]
- Stevens JM, Kendall BE, Crockard HA, Ransford A. The odontoid process in Morquio-Brailsford’s disease. The effects of occipitocervical fusion. J Bone Joint Surg Br. 1991;73(5):851–8. doi: 10.1302/0301-620X.73B5.1910048. [DOI] [PubMed] [Google Scholar]
- Tandon V, Williamson JB, Cowie RA, Wraith JE. Spinal problems in mucopolysaccharidosis I (Hurler syndrome) J Bone Joint Surg Br. 1996;78:938–944. doi: 10.1302/0301-620X78B6.1279. [DOI] [PubMed] [Google Scholar]
- Taylor C, Brady P, O'Meara A, Moore D, Dowling F, Fogarty E. Mobility in Hurler syndrome. J Pediatr Orthop. 2008;28:163–168. doi: 10.1097/BPO.0b013e3181649e25. [DOI] [PubMed] [Google Scholar]
- Tonnis D. Normal values of the hip joint for the evaluation of X-rays in children and adults. Clin Orthop Relat Res. 1976;119:39–47. [PubMed] [Google Scholar]
- Tonnis D, Brunken D. Differentiation of normal and pathological acetabular roof angle in the diagnosis of hip dysplasia. Evaluation of 2294 acetabular roof angles of hip joints in children] Arch Orthop Unfallchir. 1968;64:197–228. doi: 10.1007/BF02171260. [DOI] [PubMed] [Google Scholar]
- van der Linden MH, Kruyt MC, Sakkers RJ, de Koning TJ, Oner FC, Castelein RM. Orthopaedic management of Hurler's disease after hematopoietic stem cell transplantation: a systematic review. J Inherit Metab Dis. 2011;34:657–669. doi: 10.1007/s10545-011-9304-x. [DOI] [PMC free article] [PubMed] [Google Scholar]
- Vangeneugden T, Laenen A, Geys H, Renard D, Molenberghs G. Applying linear mixed models to estimate reliability in clinical trial data with repeated measurements. Control Clin Trials. 2004;25:13–30. doi: 10.1016/j.cct.2003.08.009. [DOI] [PubMed] [Google Scholar]
- Vellodi A, Young EP, Cooper A, et al. Bone marrow transplantation for mucopolysaccharidosis type I: experience of two British centres. Arch Dis Child. 1997;76:92–99. doi: 10.1136/adc.76.2.92. [DOI] [PMC free article] [PubMed] [Google Scholar]
- Weisstein JS, Delgado E, Steinbach LS, Hart K, Packman S. Musculoskeletal manifestations of Hurler syndrome: long-term follow-up after bone marrow transplantation. J Pediatr Orthop. 2004;24:97–101. doi: 10.1097/01241398-200401000-00019. [DOI] [PubMed] [Google Scholar]
- Wilson S, Hashamiyan S, Clarke L, Saftig P, Mort J, Dejica VM, Bromme D. Glycosaminoglycan-mediated loss of cathepsin K collagenolytic activity in MPS I contributes to osteoclast and growth plate abnormalities. Am J Pathol. 2009;175:2053–2062. doi: 10.2353/ajpath.2009.090211. [DOI] [PMC free article] [PubMed] [Google Scholar]