

Abstract
Urea cycle disorders (UCDs) result from inherited defects in the ammonia detoxification pathway, leading to episodes of hyperammonaemia and encephalopathy. The purpose of this study was to answer the question, “what is the likely plasma amino acid profile of a patient known to have a UCD presenting with hyperammonaemia during acute metabolic decompensation”, in order to support informed decisions regarding management.
We analysed the results of plasma ammonia levels and amino acid profiles taken simultaneously or within 30 min of each other during acute admissions of all patients with a UCD at the Royal Children’s Hospital, Melbourne, over 28 years. Samples from 96 admissions (79, 9 and 8 admissions for OTC, CPS and ASS deficiencies, respectively) from 14 patients fulfilled these criteria. Amino acid levels were measured by ion exchange chromatography with post-column ninhydrin derivatisation and interpreted in relation to age-related reference ranges.
Plasma concentrations of all measured essential amino acids were low or low-normal in almost all samples. There was a strong positive correlation between low plasma branched-chain amino acids and other essential amino acids, and a negative correlation between ammonia and phenylalanine to tyrosine (Phe:Tyr) ratio in patients with OTC deficiency, and between glutamine and Phe:Tyr ratio in all patients, indicating protein deficiency.
Conclusion: At admission, protein deficiency is common in patients with a UCD with hyperammonaemia. These results challenge the current guideline of stopping protein intake during acute decompensation in UCDs. Supplementation with essential amino acids (particularly branched-chain amino acids) at these times should be considered.
Introduction
Urea cycle disorders (UCDs) result from inherited defects in the hepatic ammonia detoxification pathway. The six urea cycle enzymes are carbamoyl phosphate synthetase I (CPS I) and its allosteric activator N-acetylglutamate synthetase (NAGS), ornithine transcarbamylase (OTC), argininosuccinic acid synthetase (ASS), argininosuccinic acid lyase (ASL), and arginase (ARG) (Leonard 2000). The clinical manifestations of these disorders are variable and UCD phenotypes range from neonates dying of the complications of hyperammonaemia in the first week of life to apparently asymptomatic adults. These disorders may lead to episodes of hyperammonaemia and encephalopathy during metabolic decompensation, which may occur at any age. Patients are treated with a normal-high calorie, low-protein diet and nitrogen-scavenging medications (sodium benzoate and/or sodium phenylbutyrate). Arginine, which becomes an essential amino acid in patients with a UCD (except for argininaemia), is also provided in sufficient amounts to overcome potential deficiency (Leonard and Morris 2002).
Amino acid profiles are a powerful determinant in the management of patients with a UCD and are considered a requisite in the follow-up of these patients (Leonard 2001; Summar 2001). However, there are very few published reports in which sufficient attention has been given to the timing of blood sampling (fasting hours), in order to obtain meaningful blood concentrations that can serve for therapeutic decision making. This study aimed to examine the relationships between plasma ammonia and amino acid profiles of patients with a UCD admitted during acute decompensation, in order to answer the question, “what is the likely plasma amino acid profile of a patient known to have a UCD presenting with hyperammonaemia during acute metabolic decompensation”, and thus to facilitate a preferred therapeutic decision. We also wanted to identify possible correlations between ammonia and specific amino acids at the time of decompensation.
Methods
We reviewed the results of plasma ammonia levels and amino acid profiles of all patients with a known UCD admitted to the Royal Children’s Hospital, Melbourne, due to metabolic decompensation, from January 1982 to December 2010. All patients have been treated in one centre under the same therapeutic protocol: protein restriction whilst providing sufficient energy intake, sodium benzoate and arginine (some patients with OTC deficiency were treated with citrulline for a short period). During acute admissions due to hyperammonaemia, protein intake is stopped for up to 24 h and is gradually re-introduced thereafter. Energy (calorie) intake is increased to >100% recommended daily intake. Sodium benzoate and arginine are given at a loading dose, followed by maintenance daily dose. The institutional ethics committee approved the study (HREC 32082A).
Inclusion criteria in this study were all acute admissions where plasma amino acid profiles and ammonia concentrations were undertaken simultaneously or within 30 min of each other. Information regarding the patients and the number of samples obtained from each is provided in Table 1. Seven patients with OTC (one male) provided 1–37 samples each; four patients with CPS I deficiency (one female) provided 1–6 samples each; three patients with ASS deficiency (one female) provided 1–4 samples. All samples for ammonia and amino acids were taken and analysed at the same site. Ammonia levels and plasma amino acid profiles were determined under the same protocols during these years. Amino acid concentrations were measured by ion exchange chromatography with post column ninhydrin derivatisation. Sequential models of Biochrom amino acid analysers have been used during the period in review. Quality assurance and validation testing were undertaken during transition between machines, using Sigma Aldrich standards and complying with external quality control programmes, as required for laboratory accreditation. Due to the fact that normal values of each amino acid vary with age, correlations were performed in two age groups of less than 6 and greater than 6 years, as per the two age-related normal ranges of our laboratory, which are based on Armstrong and Stave (1973) and Applegarth et al. (1979). There were only four samples from infants <3 months old (three neonates) and their results were incorporated within the <6-year-old group of patients. Each plasma amino acid concentration was first compared to the relevant reference range and then correlated to other amino acids and to ammonia. Ratios of particular amino acids were then calculated to determine the extent of any correlation with ammonia or glutamine. Amino acids were also divided into groups: Branched-Chain Amino Acids (BCAA), Large Neutral Amino Acids (LNAA), Essential Amino Acids (EAA) and Non-Essential Amino Acids (NEAA). Due to the absence of some amino acids from the profiles provided by our laboratory, EAA comprised valine, isoleucine, leucine, phenylalanine, threonine, tyrosine, methionine, lysine and histidine, but not tryptophan.
Table 1.
Clinical details and number of samples from patients with UCD (*Patient found to have mosaic c.533 C>T (p.T178M) mutation. Mosaicism estimated at 50% based on hair root follicles and saliva specimen)
| Patient | Disorder | Sex | Current age | Diagnostic confirmation | No. of samples (< 6 years) | No. of samples (> 6 years) |
|---|---|---|---|---|---|---|
| 1 | CPS I deficiency | Female | 4 years 2 months | Mutation | 1 | 0 |
| 2 | CPS I deficiency | Male | 6 years 2 months | Mutation | 1 | 0 |
| 3 | CPS I deficiency | Male | 7 years 9 months | Mutation | 1 | 0 |
| 4 | CPS I deficiency | Male | 15 years 4 months | Mutation | 0 | 6 |
| 5 | OTC deficiency | Female | 15 years | Biochemical (cascade screening) | 0 | 7 |
| 6 | OTC deficiency | Female | 12 years 4 months | Mutation | 2 | 16 |
| 7 | OTC deficiency | Female | 7 years 10 months | Biochemical (cascade screening) | 2 | 0 |
| 8 | OTC deficiency | Female | 9 years 1 month | Mutation | 34 | 3 |
| 9 | OTC deficiency | Male | 8 years 9 months | Mutation* | 11 | 1 |
| 10 | OTC deficiency | Female | Deceased | Biochemical (cascade screening) | 0 | 2 |
| 11 | OTC deficiency | Female | 2 years 9 months | Mutation | 1 | 0 |
| 12 | ASS deficiency | Male | Deceased | Biochemical | 1 | 0 |
| 13 | ASS deficiency | Male | 30 years 2 months | Biochemical (cascade screening) | 3 | 0 |
| 14 | ASS deficiency | Female | Deceased | Biochemical | 4 | 0 |
Data analysis and graphing was performed in Excel 2007® (Microsoft, Seattle, WA, USA) using native correlation and regression analysis together with the Analyse-It® add-on (www.analyse-it.com). Descriptive statistics including medians and interquartile ranges were calculated. Standard statistical tests used included Spearman’s rank, together with two-tailed p-value calculation. We used the Šida´k Correction to correct for the large number of comparisons; thus a stringent p-value of 0.004 or less was deemed significant.
Results
Samples from 96 admissions (79, 9 and 8 admissions for OTC, CPS and ASS deficiencies, respectively; none from ASL deficiency) from 14 patients fulfilled the inclusion criteria.
Figure 1a and 1b depicts the concentrations of each amino acid in the OTC-deficient group (the largest in our cohort), compared with an age-specific reference range. Plasma concentrations of ammonia, glutamine and citrulline in patients with CPS I, OTC and ASS deficiencies are presented in Table 2 (a small number of samples from patients with OTC deficiency were taken at the period when these patients were treated with citrulline, leading to a wide range of plasma citrulline concentrations in this group but a low median concentration, as would be expected).
Fig. 1.
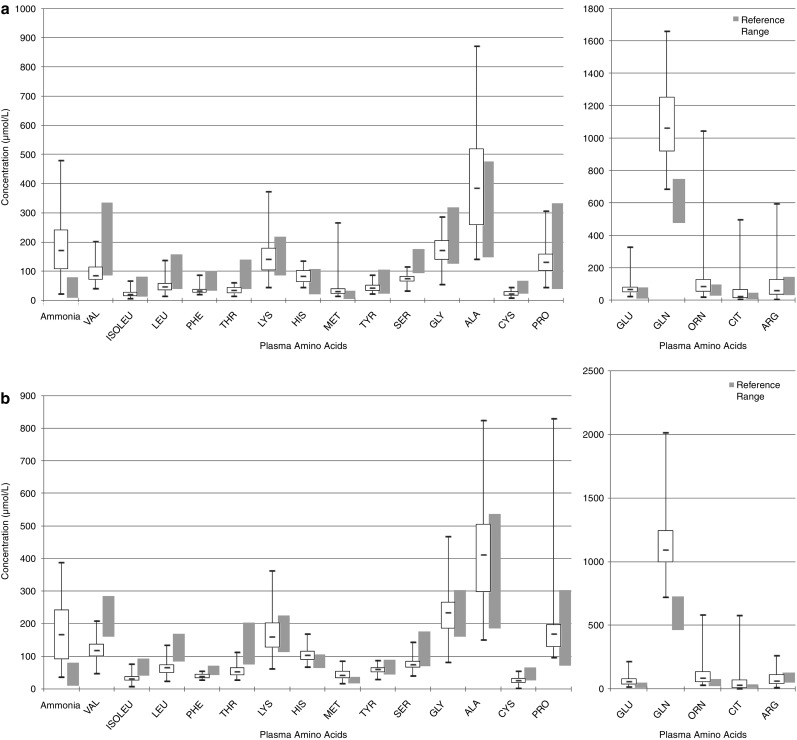
Plasma amino acids concentrations in patients with OTC deficiency < 6 years old (a) and > 6 years old (b). Boxes represent interquartile ranges. Horizontal bars within boxes represent the median. Vertical bars represent the range of concentrations
Table 2.
Ammonia, glutamine and citrulline concentrations (in μmol/L) in blood samples from patients with CPS I, OTC and ASS deficiencies
| CPS I <6 years n = 3 | CPS I >6 years n = 6 | OTC <6 years n = 50 | OTC >6 years n = 29 | ASS <6 years n = 8 | ASS >6 years n = 0 | |
|---|---|---|---|---|---|---|
| Ammonia | Median value = 86; range = 37–231; IQR = 62–159 | Median value = 131; range = 17–171; IQR = 67–154 | Median value = 172; range = 23–479; IQR = 109–241 | Median value = 167; range = 38–389; IQR = 93–243 | Median value = 209; range = 48–330; IQR = 175–286 | No samples |
| Glutamine | Median value = 780; range = 662–933; IQR = 721–857 | Median value = 846; range= 607–920.9; IQR = 710–897 | Median value = 1061; range = 688–1658; IQR = 919–1,250 | Median value = 1095; range = 723–2,015; IQR = 997–1,250 | Median value= 917; range = 320–1,299; IQR = 553–1,050 | No samples |
| Citrulline | Median value = 7; range= 4–9; IQR = 6–8 | Median value = 7; range= 4–263; IQR = 5–167 | Median value = 26; range=7–497; IQR = 14–66 | Median value = 32; range= 5–578; IQR = 13–69 | Median value = 3,297; range = 1,330–15,433; IQR = 2,300–4,090 | No samples |
IQR Interquartile range
Plasma concentration of most amino acids, particularly the essential amino acids, was low-normal or low. All three BCAA were below the normal range in 35/96 (36.5%) of all samples and in 30/79 (38.0%) of OTC-deficient patients. Of the BCAA, valine concentration was most frequently low (in 57/96 (59.4%) of all samples and 51/79 (64.9%) of OTC-deficient patients), and by the greatest margin when compared with its reference range.
Glutamate concentration was above the normal range in 38/96 (39.6%) of all patients and 31/79 (39.2%) of OTC-deficient patients. Valine concentration was low in 27/38 (71%) and 24/31 (77.4%) of these samples, respectively. Leucine concentration was low in 25/38 (65.8%) and 21/31 (67.7%) of these samples, respectively, and isoleucine was low in 23/38 (60.5%) and 18/31 (58.1%), respectively.
Plasma alanine concentrations were above the normal range in 23/96 (24.0%) of all samples and 20/79 (25.3%) of OTC-deficient patients. The plasma concentration of other amino acids varied. Arginine concentration varied, as would be expected given that the patients may or may not have had a dose of arginine just prior to coming to hospital.
Ammonia concentration correlated with glutamine concentration in samples from all patients and in those with OTC deficiency, particularly those who were <6 years old (ρ = 0.5 p < 0.0001 and ρ = 0.53 p < 0.0001, respectively) (Table 3; Fig. 2), but not in samples from children >6 years of age. There was only a trend towards a correlation between glutamine and ammonia in the CPS deficiency group (all patients: ρ = 0.70 p = 0.0347; there were only three samples of patients <6 years, too few to calculate a meaningful Spearman’s Rank; patients >6 years of age: ρ = 0.61 p = 0.1997). There was no correlation between glutamine and ammonia in the ASS deficiency group (ρ = 0.17 p = 0.693). Glutamine concentration was above the normal age-specific range in 87/96 (90.6%) of all samples and in 76/79 (96.2%) of patients with OTC deficiency. Given that there is a continuum of changes in amino acid concentrations in blood (and that the cut-off point between <6 and >6 is somewhat arbitrary), we explored the relationship between glutamine and age. A trend towards some correlation was found in OTC-deficient patients (ρ = 0.28; p = 0.0122) but not in other groups.
Table 3.
Spearman Rank correlations (ρ) between ammonia and amino acids and between amino acids themselves in all patients and in patients with OTC deficiency, based on age groups (* = p< 0.004)
| All patients (CPS, OTC, ASS deficiency) | OTC deficiency | |||||||
|---|---|---|---|---|---|---|---|---|
| All ages | <6 years | 6–18 years | All ages | <6 years | 6–18 years | |||
| Ammonia | GLN | ρ | 0.33 | 0.5 | 0.08 | 0.27 | 0.53 | −0.17 |
| p | * | * | 0.64 | 0.01 | * | 0.37 | ||
| Ammonia | PHE:TYR | ρ | −0.24 | −0.3 | −0.18 | −0.4 | −0.48 | −0.25 |
| p | 0.01 | 0.02 | 0.29 | * | * | 0.19 | ||
| GLN | GLU | ρ | 0 | 0.26 | −0.4 | −0.08 | 0.19 | −0.47 |
| p | 0.97 | 0.04 | 0.02 | 0.46 | 0.17 | 0.01 | ||
| GLN | PHE:TYR | ρ | −0.34 | −0.45 | 0 | −0.43 | −0.49 | −0.1 |
| p | * | * | 0.98 | * | * | 0.61 | ||
| BCAA# | PHE | ρ | 0.47 | 0.47 | 0.41 | 0.6 | 0.49 | 0.62 |
| p | * | * | 0.01 | * | * | * | ||
| BCAA# | TYR | ρ | 0.59 | 0.5 | 0.59 | 0.75 | 0.68 | 0.71 |
| p | * | * | * | * | * | * | ||
| BCAA# | THR | ρ | 0.53 | 0.44 | 0.57 | 0.7 | 0.57 | 0.77 |
| p | * | * | * | * | * | * | ||
| BCAA# | LYS | ρ | 0.52 | 0.49 | 0.40 | 0.57 | 0.54 | 0.41 |
| p | * | * | 0.01 | * | * | 0.03 | ||
| BCAA# | HIS | ρ | 0.24 | 0.33 | 0.13 | 0.43 | 0.39 | 0.36 |
| p | 0.01 | 0.01 | 0.47 | * | 0.01 | 0.05 | ||
| BCAA# | MET | ρ | 0.32 | 0.48 | 0.03 | 0.47 | 0.49 | 0.23 |
| p | * | * | 0.86 | * | * | 0.22 | ||
| ALA | GLN | ρ | 0.33 | 0.39 | 0.18 | 0.32 | 0.38 | 0.14 |
| p | * | * | 0.30 | 0.05 | 0.07 | 0.46 | ||
| ALA | PRO | ρ | 0.6 | 0.54 | 0.74 | 0.65 | 0.59 | 0.85 |
| p | * | * | * | * | * | * | ||
| ALA | Ammonia | ρ | 0.11 | 0.02 | 0.32 | 0.11 | 0.05 | 0.27 |
| p | 0.27 | 0.87 | 0.05 | 0.31 | 0.74 | 0.15 | ||
#BCAA = Molar sum of LEU, ILE, VAL
Fig. 2.

Correlation between Ammonia and Glutamine in patients <6 years of age. Diamond = OTC deficiency. Triangle = ASS deficiency. Cross = CPS I deficiency
There was a trend towards a negative correlation between glutamine and glutamate in the >6 year old patients in the whole cohort (ρ = −0.4; p = 0.0206) and in the OTC-deficient patients (ρ = −0.47; p = 0.0117), but not in the younger group.
The Phe:Tyr ratio has been used as a marker for protein turnover and whole body protein balance (de Betue et al. 2011). There was a negative correlation between glutamine and Phe:Tyr ratio (ρ = −0.34; p = 0.0008), particularly in the <6 year old age group (ρ = −0.45; p = 0.0003), which was very similar in the young OTC-deficient patients (r = −0.49; p = 0.0003) (Fig. 3). There was a somewhat smaller negative correlation between ammonia and Phe:Tyr ratio in this age group (ρ = −0.3; p = 0.0205), which was stronger in the OTC-deficient patients (ρ = −0.48; p = 0.0004) (Fig. 4). These correlations were not noted in older children.
Fig. 3.

Correlation between Glutamine and Phe:Tyr in patients <6 years of age. Diamond = OTC deficiency. Triangle = ASS deficiency. Cross = CPS I deficiency
Fig. 4.

Correlation between Ammonia and Phe:Tyr in patients <6 years of age. Diamond = OTC deficiency. Triangle = ASS deficiency. Cross = CPS I deficiency
There was a strong correlation between BCAA concentrations and those of other essential amino acids in the whole cohort, regardless of age (Table 3). There were only 4 out of 35 samples where the concentrations of all BCAA were low while those of the other essential amino acids (phenylalanine, tyrosine and threonine) were normal.
There was a strong correlation between plasma alanine and proline concentrations in all patients (ρ = 0.6; p < 0.0001), which was more obvious in patients of >6 years of age (ρ = 0.74; p < 0.0001) (Table 3). Plasma alanine concentrations did not correlate with ammonia concentrations (Table 3).
Discussion
Amino acid profiles are a powerful determinant in the management of patients with a UCD and are considered a requisite in the follow-up of these patients (Leonard 2001; Summar and Tuchman 2001). The rationale for this study was to provide information about the most likely plasma amino acid pattern in patients with a UCD at the time of decompensation and presentation to hospital, in order to guide appropriate treatment prescription. To this end, we reviewed the results of plasma amino acid profiles taken at the time of admission to our hospital due to hyperammonaemia, as a common denominator. To the best of our knowledge, this is the first study to document plasma amino acid profiles at times of decompensation, as opposed to chronic follow-up management. Statistical analysis of the results indicates that the correlations found when considering just OTC-deficient patients are stronger than when considering the whole cohort. This could be incidental, but it raises the question as to whether there might be alternative significant correlations within the other UCDs. Further analysis of many more samples from more patients is required in order to answer this question.
Previous studies have demonstrated that patients with a UCD may have low plasma concentrations of BCAA. One reason for this finding is transamination of BCAA to form glutamate from alpha-ketoglutarate, as a pivotal step in the formation of glutamine and ammonia detoxification. As a result, there is enhanced oxidation of these amino acids in muscle during hyperammonaemia (Holecek et al. 2011). Treatment with sodium phenylacetate/phenylbutyrate has been shown to further deplete BCAA availability (Scaglia et al. 2004; Scaglia 2010). In our cohort, in which no patient is or has been treated with sodium phenylbutyrate, low concentrations of BCAA correlated with low concentrations of other essential amino acids, suggesting general protein deficiency at the time of decompensation. Of particular note is the strong correlation between the concentrations of BCAA and the concentrations of phenylalanine, tyrosine, threonine and other large neutral amino acids, demonstrating that plasma levels of these amino acids are proportionately low. Further support for the notion of protein deficiency at presentation in the emergency department is found in the disproportionately lower valine levels, compared with leucine and Isoleucine (Adibi 1976). These observations are not surprising, given that samples were taken at admission for hyperammonaemia, possibly following an intercurrent illness with low protein intake and a drive towards glutamine production (calorie intake could vary, depending on the patient’s ability to consume high calorie formulae, as instructed when unwell). These results suggest that, unless reduced in parallel with other essential amino acids (suggesting a generalised protein deficiency), BCAA deficiency is likely to be the result of their enhanced disposal, such as with the use of sodium phenylbutyrate (Scaglia 2010).
The negative correlation between ammonia concentration and Phe:Tyr ratio in our samples, particularly in the <6 year old age group, lends support for the notion of a correlation between hyperammonaemia and protein deficiency (de Betue et al. 2011). Although plasma amino acid profiles measured at the time of decompensation may not be appropriate for determining chronic protein deficiency, this finding can be extrapolated to highlight the risk of hyperammonaemia in chronic protein malnutrition due to a very restricted low-protein diet, as previously reported (Bachmann 2005). This notion should lead to careful individual monitoring of each patient, to avoid over-treatment, particularly given the documented protein aversion of patients with a UCD (Gardeitchik et al. 2012).
The observations of a correlation between age and metabolite concentration, and in particular the correlations between metabolites in one age group and not the other, may shed light on some of the previous findings reported in the literature. For example, Wilson et al. have shown that at high plasma glutamine concentrations, ammonia concentrations vary. They suggested that a possible reason for this was that glutamine synthetase, which converts glutamate and ammonia to glutamine, has a high affinity but low capacity for ammonia (Häussinger et al. 1992), and when it reaches its capacity for glutamine synthesis, ammonia levels can fluctuate wildly, due to the diminished effect of the glutamate/glutamine buffering system. Our results are in agreement with those of Wilson et al. (2001), but we found that the correlation between ammonia and glutamine is age dependent and appears to be limited to the <6-year-old age group (Table 1; Fig. 2). It should be noted that the number of samples from ASS-deficient patients available to us was too small to enable a comparison of the correlation between ammonia and glutamine in these samples and those from OTC-deficient patients (Wilson et al. 2001). Plasma concentrations of glutamine and glutamate do not necessarily reflect their concentrations in other compartments (such as muscle, hepatic periportal and perivenous zones, intestine and kidney), and therefore interpretation of these findings is limited. Nevertheless, these results suggest that pathophysiological mechanisms could be somewhat different in the two age groups, and therapeutic considerations may need to be age related.
We conclude that the majority of UCD patients are protein deficient at admission with hyperammonaemia, as shown by the low plasma levels of most amino acids, the disproportionately low valine concentration and the negative correlation between ammonia and Phe:Tyr ratio (de Betue et al. 2011). Current recommendations for the management of patients with a UCD who present with hyperammonaemia include cessation of protein intake for up to 24 h (Leonard 2000) while providing sufficient calories to prevent catabolism. The findings in this study challenge the notion of stopping all protein intake. Providing enteral BCAA, in particular leucine, has been shown to increase protein synthesis in the liver (de Betue et al. 2011) (reviewed in Bachmann (2008)). Thus, in order to enhance anabolism, supplementation of essential amino acids enriched with BCAA along with sufficient calories to patients with a UCD during acute decompensation and hyperammonaemia would seem prudent. Moreover, in view of the contribution of the splanchnic system to protein retention and metabolism (Newsholme et al. 2003), it would be advantageous to treat patients who present with metabolic decompensation through enteral supplementation, as previously suggested (Leonard 2001; Summar 2001), rather than intravenously.
Acknowledgements
We are grateful to Mr. Ivan Francis and Dr. James Pitt, and to the Metabolic Laboratory staff, past and present, for their ongoing high-quality delivery of validated plasma amino acid profiles. This work was supported by the Victorian Government’s Operational Infrastructure Support Program. An earlier version of this work was presented at the SSIEM Annual Symposium, Geneva, 2011 (J. Inherit. Metab. Dis., 34 (supp 3):S90, Abstract P-043, 2011).
Footnotes
Competing interests: None declared
References
- Adibi SA. Metabolism of branched-chain amino acids in altered nutrition. Metabolism. 1976;25:1287–1302. doi: 10.1016/S0026-0495(76)80012-1. [DOI] [PubMed] [Google Scholar]
- Applegarth DA, Edelstein AD, Wong LT, Morrison BJ. Observed range of assay values for plasma and cerebrospinal fluid amino acid levels in infants and children aged 3 months to 10 years. Clin Biochem. 1979;12:173–178. doi: 10.1016/S0009-9120(79)80084-3. [DOI] [PubMed] [Google Scholar]
- Armstrong MD, Stave U. A study of plasma free amino acid levels II. Normal values for children and adults. Metabolism. 1973;22:561–569. doi: 10.1016/0026-0495(73)90069-3. [DOI] [PubMed] [Google Scholar]
- Bachmann C. Long-term outcome of urea cycle disorders. Acta Gastroenterol Belg. 2005;68:466–468. [PubMed] [Google Scholar]
- Bachmann C. Interpretation of plasma amino acids in the follow-up of patients: the impact of compartmentation. J Inherit Metab Dis. 2008;31:7–20. doi: 10.1007/s10545-007-0772-y. [DOI] [PubMed] [Google Scholar]
- de Betue CT, van Waardenburg DA, Deutz NE, van Eijk HM, van Goudoever JB, Luiking YC, Zimmermann LJ, Joosten KF. Increased protein-energy intake promotes anabolism in critically ill infants with viral bronchiolitis: a double-blind randomised controlled trial. Arch. 2011;96:817–822. doi: 10.1136/adc.2010.185637. [DOI] [PMC free article] [PubMed] [Google Scholar]
- Gardeitchik T, Humphrey M, Nation J, Boneh A (2012) Early Clinical Manifestations and Eating Patterns in Patients with Urea Cycle Disorders. J Pediatr 161:328–332, Epub Mar 2012 [DOI] [PubMed]
- Häussinger D, Lamers WH, Moorman AF. Hepatocyte heterogeneity in the metabolism of mino acids and ammonia. Enzyme. 1992;46:72–93. doi: 10.1159/000468779. [DOI] [PubMed] [Google Scholar]
- Holecek M, Kandar R, Sispera L, Kovarik M. Acute hyperammonemia activates branched-chain amino acid catabolism and decreases their extracellular concentrations: different sensitivity of red and white muscle. Amino Acids. 2011;40:575–584. doi: 10.1007/s00726-010-0679-z. [DOI] [PubMed] [Google Scholar]
- Leonard JV. Disorders of the urea cycle. In: Fernandes JS, Saudubray J-M, van den Berghe G, editors. Inborn metabolic diseases. Berlin/Heidelberg/New York: Springer; 2000. pp. 215–222. [Google Scholar]
- Leonard JV. The nutritional management of urea cycle disorders. J Pediatr. 2001;138:S40–44. doi: 10.1067/mpd.2001.111835. [DOI] [PubMed] [Google Scholar]
- Leonard JV, Morris AA. Urea cycle disorders. Semin Neonatol. 2002;7:27–35. doi: 10.1053/siny.2001.0085. [DOI] [PubMed] [Google Scholar]
- Newsholme P, Procopio J, Lima MM, Pithon-Curi TC, Curi R. Glutamine and glutamate–their central role in cell metabolism and function. Cell Biochem Funct. 2003;21:1–9. doi: 10.1002/cbf.1003. [DOI] [PubMed] [Google Scholar]
- Scaglia F. New insights in nutritional management and amino acid supplementation in urea cycle disorders. Mol Genet Metab. 2010;100:S72–S76. doi: 10.1016/j.ymgme.2010.02.019. [DOI] [PMC free article] [PubMed] [Google Scholar]
- Scaglia F, Carter S, O'Brien WE, Lee B. Effect of alternative pathway therapy on branched chain amino acid metabolism in urea cycle disorder patients. Mol Genet Metab. 2004;81:S79–85. doi: 10.1016/j.ymgme.2003.11.017. [DOI] [PubMed] [Google Scholar]
- Summar M. Current strategies for the management of neonatal urea cycle disorders. J Pediatr. 2001;138:S30–S39. doi: 10.1067/mpd.2001.111834. [DOI] [PubMed] [Google Scholar]
- Summar M, Tuchman M. Proceedings of a consensus conference for the management of patients with urea cycle disorders. J Pediatr. 2001;138:S6–S10. doi: 10.1067/mpd.2001.111831. [DOI] [PubMed] [Google Scholar]
- Wilson CJ, Lee PJ, Leonard JV. Plasma glutamine and ammonia concentrations in ornithine carbamoyltransferase deficiency and citrullinaemia. J Inherit Metab Dis. 2001;24:691–695. doi: 10.1023/A:1012995701589. [DOI] [PubMed] [Google Scholar]