Abstract
Non-collagenous proteins (NCPs) inhibit hydroxyapatite (HA; Ca5(PO4)3OH) formation in living organisms by binding to nascent nuclei of HA and preventing their further growth. Polar and charged amino acids (AAs) are highly expressed in NCPs, and the negatively charged ones, such as glutamic acid (Glu) and phosphoserine (P-Ser) seem to be mainly responsible for the inhibitory effect of NCPs. Despite the recognized importance of these AAs on the behaviour of NCPs, their specific effect on HA crystallization is still unclear, and controversial results have been reported concerning the efficacy of HA inhibition of positively versus negatively charged AAs. We focused on a positively charged (arginine, Arg) and a negatively charged (Glu) AA, and their combination in the same solution. We studied their inhibitory effect on HA nucleation and growth at physiological temperature and pH and we determined the mechanism by which they can affect HA crystallization. Our results showed a strong inhibitory effect of Arg on HA nucleation; however, Glu was more effective in inhibiting HA crystal growth during the growth stage. The combination of Glu and Arg was less effective in controlling HA nucleation, but it inhibited HA crystal growth. We attributed these differences to the stability of complexes formed between AAs and calcium and phosphate ions at the nucleation stage, and in bonding strength of AAs to HA crystal faces during the growth stage. The AAs also influenced the morphology of synthesized HA. Presence of either Arg or Glu resulted in the formation of spherulites consisting of preferentially oriented nanoplatelets orientation. This was attributed to kinetic factors favoring growth front nucleation (GFN) mechanism.
Keywords: hydroxyapatite, arginine, glutamic acid, inhibitory effect, precipitation, mechanism
1. Introduction
Living organisms synthesize a variety of inorganic minerals, ranging from apatite in bones, calcium carbonate in seashells, to iron oxide in magnetotactic bacteria. These minerals form during a highly regulated process called biomineralization, and often have exceptional mechanical properties, complex shapes and intricate hierarchical structures, which distinguish them from their artificially synthesized counterparts [1–3]. The unique characteristics of these minerals are obtained under the direct influence of biomolecules, usually proteins and peptides, which remarkably control and regulate their nucleation and growth under conditions that are much milder than those used in conventional processing techniques [1,2,4,5].
The most well-known, and maybe most complex, example of biomineralization is the formation of bone, an organic–inorganic hybrid material made of collagen, non-collagenous proteins (NCPs) and carbonated hydroxyapatite (HA) crystals. Collagen fibres provide a framework known as the extracellular matrix (ECM), where HA nucleates and grows. The ECM determines the ultimate structure and orientation of HA (Ca5(PO4)3OH) crystals [6]; however, HA nucleation is mainly initiated by a set of negatively charged phosphorylated NCPs associated with the ECM. These proteins attract calcium and phosphate ions and increase the local supersaturation to a level sufficient to form nuclei of a critical size, which can develop into HA crystals [7,8]. Another set of NCPs has the ability to inhibit an undesirable formation of HA in tissues such as cartilage, blood vessels and valves, which are continuously exposed to body fluids. These inhibitory proteins are dissolved in the plasma and limit the formation of HA by binding to the surface of nascent nuclei of minerals, thus restricting their further growth [9,10].
While striving to understand the process of biomineralization, researchers have focused on the effect of smaller biomolecules such as amino acids (AAs) and peptides on HA mineralization. Despite their minimal concentration as free biomolecules in human plasma [11], AAs are the building blocks of proteins, and negatively charged AAs such as Glu and P-Ser are highly expressed in the acidic domains of NCPs involved in HA mineralization in bone and dentine. Similar to proteins, charged AAs can either inhibit or induce HA mineralization depending on whether they are dissolved in a solution or bound to a surface. AAs are also effective in modifying the morphology and crystalline structure of HA owing to the electrostatic and stereochemical effects of their charged residues [10,12–15]. In comparison with proteins or peptides, AAs are much less expensive and more stable, which makes them attractive candidates for clinical applications. In vitro studies show that promoting AAs are useful for improving bone regeneration in damaged tissues [14], whereas inhibitory AAs are potential candidates for treating pathological diseases caused by an excessive mineralization of HA in tissues such as cartilages [16,17], blood vessels and cardiac valves [17–19].
Despite the well-documented importance of these AAs in controlling HA mineralization, the mechanism by which they interact with HA crystals to induce or inhibit mineralization is still strongly debated. In general, it is believed that negatively charged AAs, containing carboxylate and phosphorylated residues, play a key role in controlling HA mineralization in bone [7,20–23]. However, contradictory results reported by different authors make it difficult to draw a comprehensive conclusion about the effect of AAs on HA crystallization. For example, Jack et al. [24] reported a significant inhibitory effect of alanine (Ala) and aspartic acid (Asp) on the growth of HA particles. By contrast, Palazzo et al. [10] showed that Asp promoted HA particle growth, whereas Ala had no effect on HA particle sizes. According to Jack et al. [24], a positively charged AA, lysine, had the strongest affinity to HA surfaces; however, Koutsopoulos and Dalas showed that the negatively charged Asp had the largest affinity to HA among the AAs that they investigated [25–29]. In addition to these contradictory results, the studies on the effect of AAs are often focused on HA crystal growth rather than investigating HA formation at its very early stages (i.e. HA nucleation) [25–29] and are mostly conducted under experimental conditions different from the physiological ones (i.e. high supersaturation, high temperature or high pH) [15,24,30,31]. These factors have made it difficult to have a real insight into the effect of AAs on biomineralization in living organisms.
In this study, we investigate the inhibitory effect of a positively charged (Arg) and a negatively charged (Glu) AA dissolved in solution on the morphology and crystallization (nucleation and growth) of HA synthesized at physiological temperature and pH. Negatively charged AAs, such as Asp and Glu are highly expressed in the family of proteins called SIBLINGs (small-integrin-binding ligand, N-linked glycoproteins), known to play a key role in HA mineralization in the body [7]. SIBLINGs also contain positively charged AAs, such as Arg and Lys. Here, we focus on Glu and Arg to understand the relative importance of negative and positive charges in HA mineralization, and we specifically select Glu and Arg because they have been less investigated than their counterparts Asp and Lys [10,23–29]. We also study the effect of combination of Glu and Arg, with the goal of clarifying whether different inhibiting or promoting mechanisms related to the two AAs could enhance or dampen each other. Our results show a key role of the positively charged AA on HA crystallization and shed some light on the mechanism under which these AAs influence HA nucleation and growth.
2. Material and methods
2.1. Synthesis of hydroxyapatite in the presence of amino acids
2.1.1. Materials
Calcium (Ca) and phosphate (P) ion precursors were calcium chloride dehydrated (CaCl2, Sigma Aldrich, purity >97%) and sodium phosphate monobasic anhydrous (NaH2PO4, purity >99%, Fisher Scientific). The AAs used in the study (l-arginine, purity ≥ 99.5%, and l-glutamic acid, purity ≥99.5%) were purchased from Sigma Aldrich, as well as the buffer agent tris(hydroxymethyl)aminomethane (tris, purity ≥ 99.5%). Hydrochloric acid used to adjust pH was purchased from Fisher. The ninhydrin reagent from Sigma (N 7285) was used to measure the concentration of AAs in the supernatant solution.
2.1.2. Hydroxyapatite synthesis
Ca and P precursor solutions (130 ml) were prepared by mixing CaCl2 (6.22 mM), tris (100 mM) and AAs (Arg and/or Glu, 10 mM), and NaH2PO4 (3.74 mM), tris (100 mM) and AAs (Arg and/or Glu, 10 mM), respectively. Control solutions were prepared with identical CaCl2, NaH2PO4 and tris concentration, in the absence of any AA. The pH of both Ca and P precursor solutions was adjusted at 7.4 using adequate amounts of concentrated HCl, and the temperature was adjusted to 37°C by placing the reaction vessels in water bath equipped with temperature controller (ColeParmer PolyStat Immersion Circulator). The same volume of Ca and P precursor solutions was added to the reaction vessel simultaneously, thus reaching final Ca and P concentrations of 3.11 and 1.87 mM, respectively. The ratio between these concentrations matches the physiological Ca-to-P ratio, but the absolute values are approximately 1.5 times higher than those found in human blood plasma, and they were chosen in order to decrease the required incubation time prior to precipitation. The supersaturation value for HA at these Ca and P concentrations is 122.96, calculated according to equation (2.1),
| 2.1 |
where IP is the ionic activity product and KS is the solubility constant equal to 2.35 × 10−59 for HA at 37°C [32]. The pH of the reaction solution was monitored, and remained constant at 7.4 ± 0.05. The reaction solution was stirred at 5 rpm, and the temperature was kept constant at 37°C. The samples were taken out at the precipitation time and after 2 days of reaction, and the precipitates were filtered using 200 nm filters, and subsequently washed three times with deionized water. The precipitates were finally dried using a VirTis freeze drier. The summary of the AAs present in different samples and their concentration is reported in table 1.
Table 1.
Summary of AA concentrations in different samples.
| sample | Glu conc. (mM) | Arg conc. (mM) |
|---|---|---|
| HA-Cont | 0 | 0 |
| HA-Glu | 10 | 0 |
| HA-Arg | 0 | 10 |
| HA-Combo | 5 | 5 |
2.2. Characterization techniques
2.2.1. Bulk characterizations of dried precipitates
Fourier transform infrared (FT-IR) spectroscopy. IR spectra were recorded on a Bruker Tensor 27 FT-IR spectrometer using diffuse reflectance (DRIFT) mode. The reflected signals are converted and reported as absorbance in the figures shown in this study. The powders were diluted with KBr to approximately 10% w/w ratio. Pure KBr powder was used to collect background spectra. The FT-IR spectra were recorded from 600 to 4000 cm−1 using a mercury–cadmium–telluride detector. The spectra were collected by averaging 256 scans at 4 cm−1 resolution.
X-ray diffraction (XRD). XRD spectra were collected using a Bruker AXS XRD instrument with Cu Kα radiation generated at 40 kV and 40 mA. A quartz sample holder was used for these experiments. The range of diffraction angles collected (2θ) ranged from 5° to 100°, with step size of 0.05°. The crystallite sizes were measured using Debye–Scherrer equation [33],
| 2.2 |
where k is shape factor (k = 0.9), λ is the wavelength of the X-rays (λ = 0.154 056 nm for Cu Kα radiation), θ is the diffraction angle and FWHM is the full width half maximum of (001) and (310) peaks at 2θ values of 25.88 and 39.82, respectively, referring to synthetic HA with hexagonal (P63/m) crystalline structure.
Inductively coupled plasma atomic emission spectroscopy (ICP-AES). ICP-AES was performed on the precipitates to measure the bulk Ca and P values in these samples. One milligram of samples was dissolved in 10 ml of 4 per cent nitric acid, and the resulting Ca and P concentrations were measured using the same procedure described in §2.2.3.
2.2.2. Surface characterization of dried precipitates
X-ray photoelectron spectroscopy (XPS). XPS measurements were performed, using a monochromatic X-ray photoelectron spectrometer K Alpha (Thermo Scientific). The set-up was equipped with an Al Kα X-ray source (1486.6 eV, 0.834 nm), a micro-focused monochromator and an ultrahigh vacuum chamber (10−9 Torr). Survey scans were collected with energy steps of 1 eV and spot size of 50 µm. Scans were taken on at least three points on each sample, and the quantitative results were averaged. A flood gun was used to neutralize electrical built-up charge generated on the non-conductive samples. The survey scans were analysed, using the software Thermo Avantage (v. 4.60).
Surface area and porosity determination. The specific surface area (SSA), and porosity of the samples was determined at 77 K by the adsorption of N2 using an automatic gas-volumetric apparatus (TriStar, Micromeritics). The Brunauer–Emmett–Teller (BET) model was adopted for SSA determination [34,35], whereas the Barret–Joyer–Halenda (BJH) model was used to analyse mesoporosity [34,36].
Morphology. Particle morphology was analysed with a scanning electron microscope (SEM) from Hitachi (S-4700 FE-SEM), using an acceleration voltage of 5 kV. The specimens were mounted on double-sided conductive carbon tape and were coated with a thin layer of Au to increase their conductivity. The coating was done with a HUMMER VI sputtering system under vacuum of 70 mTorr and at the voltage of 10 V for 1 min.
2.2.3. Characterization of supernatant solution
ICP-AES. Ca and P concentrations in solution were measured using an ICP-AES instrument (ICAP 6500 Duo). For this purpose, aliquots were taken from the supernatant solution at the desired reaction times, filtered with a syringe filter with a pore size of 100 nm to remove any trace of HA precipitates, and then immediately diluted with 4 per cent nitric acid. Although prenucleation clusters smaller than 100 nm were lost during this procedure, the dilution with 4 per cent nitric acid ensured that no more calcium phosphate aggregates formed in the supernatant solution after filtration. The Ca and P concentrations were measured at wavelengths of 3179 and 1782 nm, respectively.
Amino acid concentration determination. The concentration of AAs in the supernatant solution was measured by a colorimetric technique based on the use of ninhydrin to transform free amino groups in a coloured product [37]. For this purpose, aliquots were taken at desired times, and then diluted with 10 per cent glacial acetic acid to stop the reaction. An adequate amount of ninhydrin reagent was added to the samples, and the absorption of the solutions was measured at 570 nm using a UV–vis spectrometer (Perkin Elmer, Lambda 20). According to Duggan et al. [38], the free NH2 groups from tris do not interfere with the colour generated at 570 nm by the interactions between the NH2 group of AAs and ninhydrin. Despite this, in our experiments, we found a minor interference owing to tris, and therefore we removed the tris contribution by comparing the results of the solutions containing both tris and AAs to those containing tris only. Calibration curves were constructed using 3.125, 6.25, 18.75 and 25 µM AAs solutions made by dissolving adequate amounts of AAs in 10 per cent glacial acetic acid.
3. Results
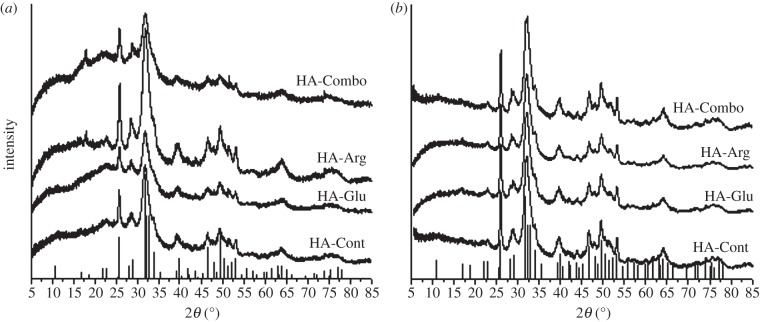
In order to understand the effect of Arg, Glu and their combination on HA precipitation, we compared HA precipitation in the presence of these AAs with control samples that had no AAs. We characterized the synthesized powder with a range of different techniques, including FT-IR, XPS, XRD, SEM, ICP-AES and UV–vis spectroscopy. The XRD results shown in figures 6 and 7 confirmed that all the precipitates were mainly composed of HA, as will be discussed in §3.4. From now on, we will refer to the samples prepared in the presence of the AAs and the control samples as HA-Glu, HA-Arg, HA-Combo and HA-Cont (see table 1 for details of their AA content).
Figure 6.
(a) XRD patterns of HA-Cont, HA-Glu, HA-Arg and HA-Combo collected at the precipitation time, and (b) after 2 days. The vertical lines are the reference pattern for HA (PDF no. 00-009-0432).
Figure 7.
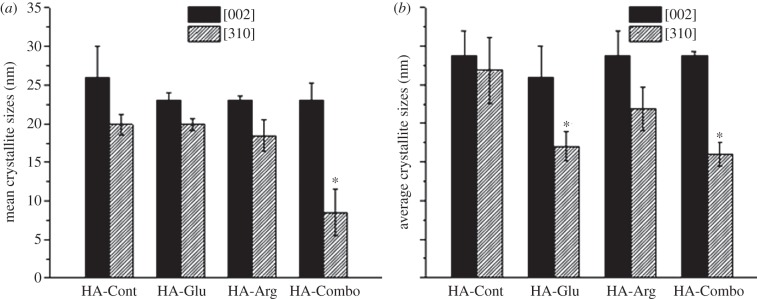
(a) Average crystallite sizes along [002] and [310] measured by XRD for HA-Cont, HA-Arg, HA-Glu and HA-Combo at the precipitation time and (b) after 2 days. Asterisks indicate samples that were significantly different from HA-Cont (p < 0.05 in (a) and p < 0.08 in (b)).
3.1. Precipitation times and precipitate weights
Figure 1 shows the effect of different AAs on the precipitation time of HA. Although both Glu and Arg inhibited the formation of HA precipitates, the effect of Arg was significantly stronger. In the presence of Arg, the precipitates took approximately eight times longer to form compared with HA-Cont sample prepared in the presence of tris alone, whereas in the presence of Glu, the precipitation time was increased by only approximately fivefold. The combination of Arg and Glu had some inhibitory effects on the formation of HA particles, however to a lower extent than either of the AAs alone.
Figure 1.
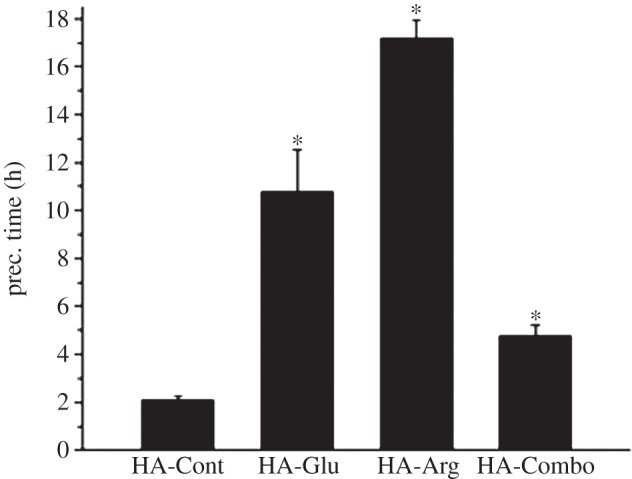
Effect of AAs on the precipitation time (prec. time) of HA. The precipitation time was considered to be the time at which the solution became visibly cloudy. Each data point is the average of at least three samples. Asterisks indicate the samples that were statically significantly different (p < 0.003) from the control sample.
It is worth noting here that we specifically tested the inhibitory effect of tris alone as well. In fact, tris is known to have an inhibitory effect on calcium phosphate formation [39]. Samples prepared in the absence of both tris and AAs precipitated immediately after mixing (results not shown), whereas HA-Cont samples prepared in the presence of tris precipitated after approximately 2 h (figure 1). This confirmed the inhibitory effect of tris reported by Kokubo et al. [39]. However, the much longer delay in HA precipitation observed for the AA-containing samples despite the small concentration of the AAs (10 mM) relative to tris (100 mM) indicates a stronger inhibitory effect for the AAs compared with tris. This can be explained considering the electrical charges of these molecules. The pKa of tris at 25°C is 8 [40], whereas the pKa of the side chains of Arg and Glu are 12.5 and 4.25, respectively [41]. The larger electrical charges present on the AAs at pH 7.4 may contribute to making them more effective than tris in inhibiting HA formation.
Figure 2 shows the effect of the investigated AAs on the precipitate weights after 2 days of reaction. If we consider the initial moles of Ca and P present in solution, then we should expect a theoretical precipitate weight of 0.081 g if all of the Ca and P combined to form HA. This weight is higher than the weights observed for all precipitates, even after the reactions reached their stable state (figure 11). This confirms the inhibitory effect of organic molecules dissolved in the reaction solution. In line with the precipitation time results, both Glu and Arg strongly inhibited HA formation, resulting in smaller amounts of precipitate after 2 days in comparison with the control samples. The combination of Glu and Arg also inhibited the precipitation of HA, but not as strongly as the individual effect of Glu and Arg. This result was also consistent with the precipitation time result obtained for the HA-Combo samples.
Figure 2.
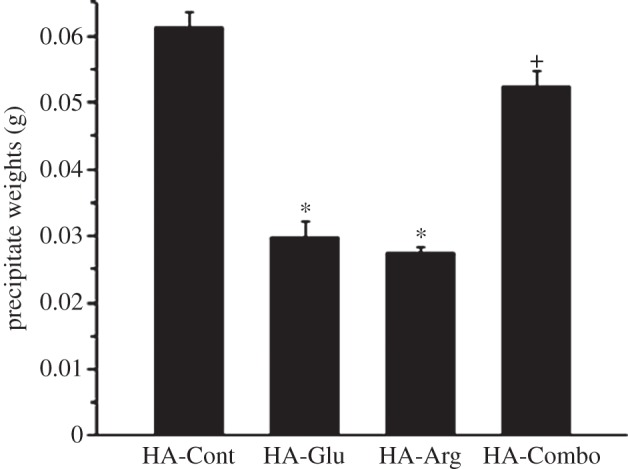
Effect of Glu, Arg and combination of Glu and Arg on the weight of precipitates after 2 days of reaction. Each data point is the average of at least three samples. Asterisks and plus signs indicate the samples that were statically significantly different from the control sample with p < 0.0005 and 0.02, respectively.
Figure 11.
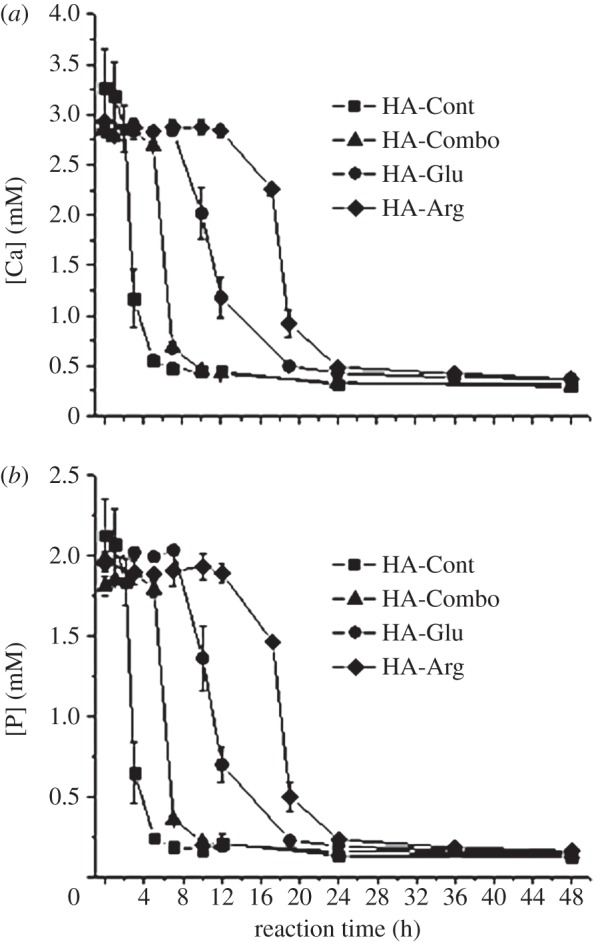
(a) [Ca] and (b) [P] in the supernatant solution for HA-Cont, HA-Combo, HA-Glu and HA-Arg samples.
3.2. Morphology
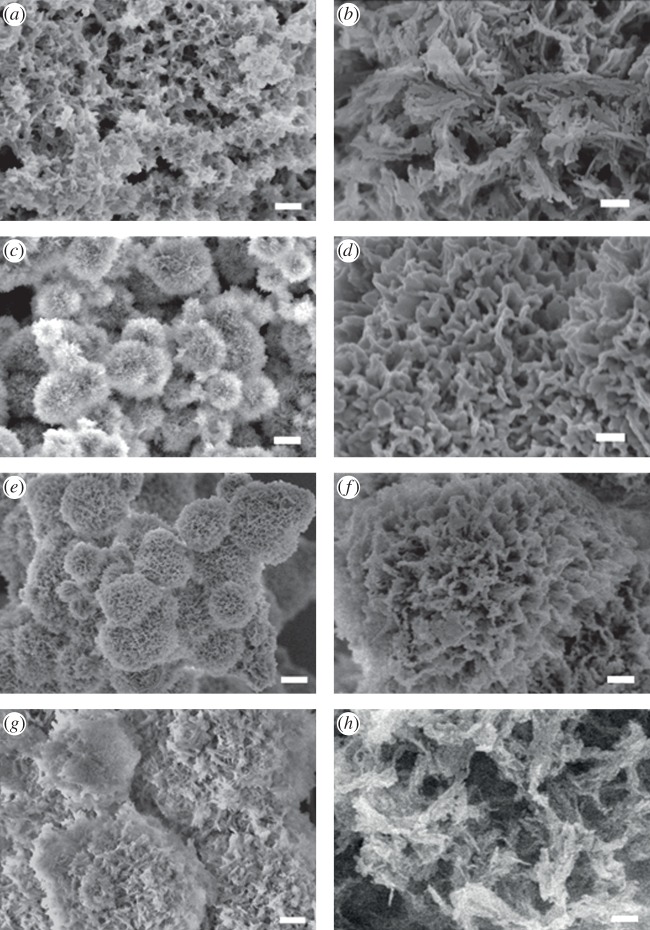
Figure 3 shows the morphology of the HA samples obtained at precipitation time. Individual microspherulitic aggregates of 2–4 µm were found in both HA-Glu and HA-Arg samples (figure 3c,e), and were less evident for HA-Combo (figure 3g), whereas HA-Cont only showed aggregated particles without individual microspheres (figure 3a). The microspheres observed for HA-Glu and HA-Arg were composed of plate-like particles (figure 3d,f), more densely packed on HA-Glu. High-magnification SEM images for HA-Cont and HA-Combo (figure 3b,h) showed longer, curved strands that were not observed on HA-Glu and HA-Arg.
Figure 3.
SEM images of samples (a,b) HA-Cont, (c,d) HA-Glu, (e,f) HA-Arg and (g,h) HA-Combo at precipitation time. Scale bars: 1 µm (a,c,e,g) and 200 nm (b,d,f,h).
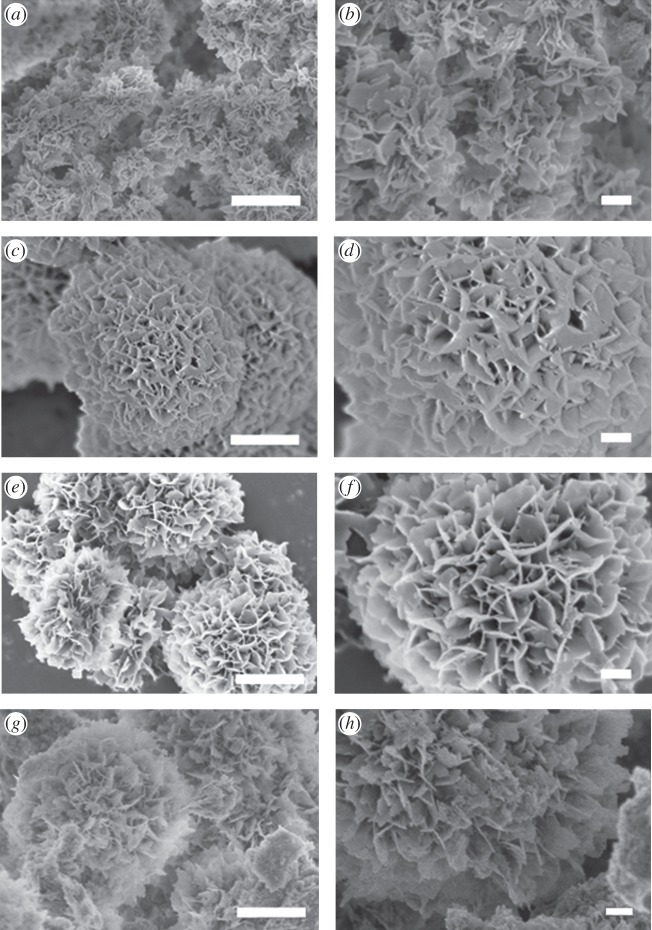
The spherulitic morphology observed for HA-Arg and HA-Glu became more evident after 2 days of reaction, whereas the size of the microspheres decreased (figure 4c,e), reaching approximately 2 µm for HA-Arg and 3 µm for HA-Glu. The microspheres at this point consisted of nanoplatelets preferentially oriented with their long axis pointing towards the centre of the microsphere. The platelets were still curved, but they were less jagged at the borders in comparison with those seen at precipitation time. Similar nanoplatelets were observed in HA-Cont (figure 4b), however they lacked the orientation observed on HA-Arg and HA-Glu, and were agglomerated in random structures rather than organized in spherulitic particles. The morphology of Combo-HA after 2 days (figure 4g,h) was more similar to the samples synthesized in the presence of AAs than to the control sample. The microspheres in HA-Combo became more evident after 2 days. They were made of nanoplatelets similar to those observed on HA-Glu and HA-Arg.
Figure 4.
SEM images of samples (a,b) HA-Cont, (c,d) HA-Glu, (e,f) HA-Arg and (g,h) HA-Combo after 2 days of reaction. Scale bars: 1 µm (a,c,e,g) and 200 nm (b,d,f,h).
3.3. BET-specific surface area of synthesized particles
Figure 5 shows the BET SSA results for HA particles synthesized in the presence of different AAs after 2 days of reaction. These results inversely correlated with the precipitation times reported in figure 1: the largest SSA (97 ± 6 m2 g−1) was observed for HA-Cont, which precipitated first; values of 84 ± 5 and 77 ± 1 m2 g−1 were measured on HA-Combo and HA-Glu; and the lowest value of 60 ± 1 m2 g−1 was observed for HA-Arg, which showed the most delayed precipitation time. The overall high SSA values obtained were related to the presence of mesopores—in fact, a similar trend was observed for mesopore volumes, and it was directly related to the pore size (table 2).
Figure 5.
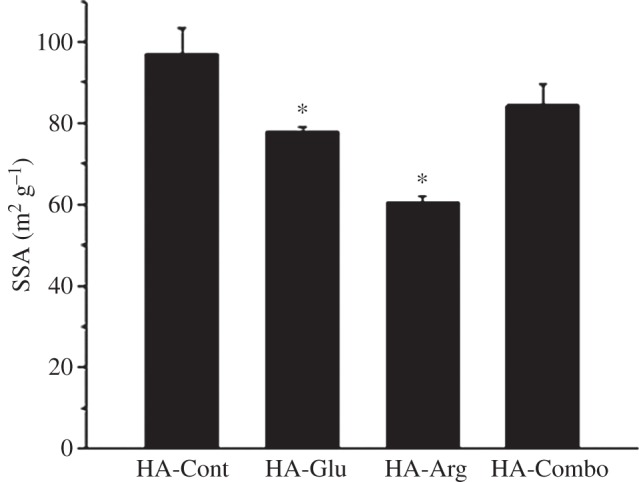
Effect of Glu, Arg and combination of Glu and Arg on the BET SSA of synthesized HA powders after 2 days of reaction. Asterisks indicate the samples that were statically significantly different from the control sample with p < 0.05.
Table 2.
Pore volume and pore size for HA samples synthesized in the presence of Glu, Arg and their combination after 2 days.
| sample | mesopore volume (cm3 g−1) | pore size (nm) |
|---|---|---|
| HA-Cont | 0.45 ± 0.01 | 12.92 ± 0.33 |
| HA-Glu | 0.22 ± 0.06 | 6.77 ± 0.68 |
| HA-Arg | 0.17 ± 0.03 | 7.99 ± 0.65 |
| HA-Combo | 0.34 ± 0.05 | 10.38 ± 0.23 |
3.4. Crystal structure and crystallite sizes measured by X-ray diffraction
Figure 6a,b shows the XRD patterns for samples measured at the precipitation time and after 2 days of reaction, respectively. All precipitates were HA, as confirmed by comparison with the standard HA pattern. The spectra collected on our samples were also compared with the reference pattern for octacalcium phosphate (OCP), which has a structure similar to HA. Neither the most intense peak of OCP at 2θ = 4.7° nor the second most intense peaks at 2θ = 9.308 and 9.703° matched the peaks observed in the spectra of our samples (see electronic supplementary material, S1). The large backgrounds observed for all the powders at the precipitation time (figure 6a) indicated the presence of an amorphous calcium phosphate (ACP) component in these samples, which was partially retained even after 2 days of reaction in the presence of Glu and Arg (figure 6b). This result showed the ability of the AAs to stabilize ACP, possibly because they were trapped in the HA crystalline lattice, thus causing greater atomic disorder. This was consistent with the results obtained by Palazzo et al. [10], who showed the formation of less crystalline HA in the presence of Arg, Asp and Ala. This lower degree of crystallinity makes HA synthesized in the presence of AAs resemble natural bone more closely than pure HA, because bone minerals are composed of poorly crystalline HA [42].
The crystallite size along the [002] and [310] directions was estimated using the Debye–Scherrer equation and the FWHM of the corresponding peaks at 2θ = 25.88 and 39.82°, respectively (equation (2.1); figure 7). No statistically significant differences with HA-Cont were observed for AA-containing samples at precipitation time, except for HA-Combo along the [310] direction. After 2 days of reaction, statistically significant differences were observed for both HA-Glu and HA-Combo along [310]—in particular, a crystallite size along [310] of 26 ± 4 nm was measured for HA-Cont, whereas values of 17 ± 2 nm and 16 ± 2 nm were obtained for HA-Glu and HA-Combo, respectively.
3.5. FT-IR analysis
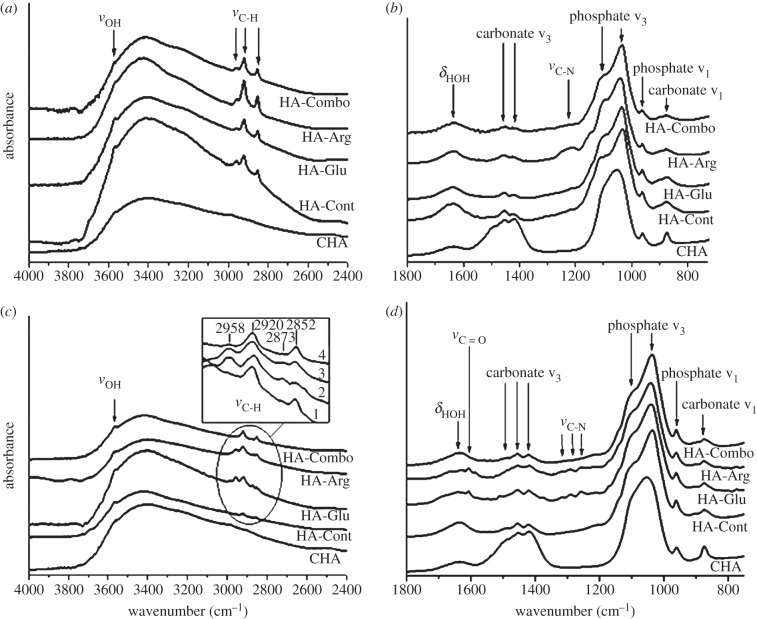
In line with the XRD results, the FT-IR spectra for all samples recorded at the precipitation time and after 2 days of reaction matched the spectra recorded on carbonated HA (CHA) [43,44] (figure 8), and were very different from those obtained for other crystalline phases of calcium phosphates such as OCP [45]. However, the phosphate ν3 peaks on HA-Cont and AA-containing HA samples were sharper than in CHA, most likely indicating that the HA samples were more crystalline than the reference CHA [46], which is very defective owing to the incorporation of carbonate ions in its crystal lattice. Also, the HA samples did not show strong carbonate ν3 peaks because the carbonates were not present in the bulk, but rather at the surface most likely due to reaction with atmospheric CO2 dissolved in the reaction solution—indeed, more carbonates were observed on the HA samples after 2 days of reaction. More water was adsorbed on the HA samples than on CHA, as shown by the stronger δHOH peak at 1660 cm−1 and more pronounced νOH band in the 2600–3700 cm−1 region. The peak at 3650 cm−1 present on all samples is attributed to νOH from structural OH groups in HA.
Figure 8.
IR spectra of control and AAs samples at precipitation time (a,b) and after 2 days (c,d). All spectra are normalized with respect to the main phosphate peak of CHA at 1055 cm−1. Spectra are then translated along the y-axis for clarity. Sections (a,c): 4000–2400 cm−1 region; (b,d): 750–2000 cm−1 region. Inset in section c: zoom-in of 3000–2800 cm−1 region for spectra HA-Cont (1), HA-Glu (2), HA-Arg (3) and HA-Combo (4).
FT-IR spectroscopy can also provide information relative to the presence of organic components in the samples. Peaks at 1200–1300 cm−1 were attributed to νC−N; these peaks were observed on HA-Arg more strongly at precipitation time, and were present after 2 days on both HA-Arg and HA-Glu, thus indicating the presence of AAs on these samples [10]. Confirming this, a small νC=O peak, originating from the carboxylate groups in AAs, was observed for HA-Arg and HA-Glu samples after 2 days of reaction [10]. The νC−H peaks observed in the 2800–3000 cm−1 region showed that organic material, either tris or AAs, was present in all of the precipitates. The peaks at 2958 and 2873 cm−1 correspond to νCH3 asym and νCH3 sym, respectively, and those at 2920 and 2852 cm−1 to νCH2 asym and νCH2 sym (figure 8, inset) [47]. While tris has only CH2 groups, AAs contain both CH2 and CH3 groups; therefore, the CH3 to CH2 ratio can be considered as an indication of the presence of AAs in the samples. As shown in figure 8 (inset), the samples with higher CH3 to CH2 ratio were HA-Arg and HA-Glu, followed by HA-Combo and finally HA-Cont. This further confirmed the presence of AAs in HA-Arg and HA-Glu, and to a lower extent in HA-Combo.
3.6. Surface composition determined by X-ray photoelectron spectroscopy
XPS allows identifying the elemental composition, and chemical species present on the outmost few nanometres of the sample surface. Figure 9 shows the C/Ca and N/Ca ratio for the control, and AAs samples collected at different reaction times, calculated based on the areas of the C 1s, N 1s and Ca 2p peaks recorded in XPS survey spectra. The C measured on all the samples can originate from three sources: contamination, always present in some amount on any sample; carbonate ions; and organic material, including both tris and AAs. N too can originate from organic components, including both tris and AAs. Therefore, it is possible to estimate the amounts of Arg and Glu in the AAs samples if the C/Ca and N/Ca ratios for the AAs samples are compared with those for the control samples at the same reaction times. While the C/Ca ratios measured on HA-Arg were approximately six and eight times higher than those measured on HA-Cont at precipitation time and after 2 days, respectively, the same C/Ca ratios on HA-Glu were only approximately two and 1.6 times higher than those measured on HA-Cont. No significant differences between HA-Combo and HA-Cont were observed after 2 days of reaction and only minor differences were observed at precipitation time. These results thus indicate that HA-Arg samples synthesized both at the precipitation time and after 2 days of reaction contained significantly larger amounts of AAs in comparison with the HA-Glu and HA-Combo samples. Small amounts of N detected in HA-Arg samples at the precipitation time and after 2 days of reaction further confirmed the presence of Arg in these samples (figure 9). The fact that no N is detected on HA-Glu, whereas IR clearly shows the presence of AAs on this sample may be related to the fact that less N is present in the Glu structure than in Arg, and thus the small amount of N present on the HA-Glu sample is not detectable by XPS. Indeed, XPS is a more surface-sensitive technique than IR, and if small amounts of AAs are present all throughout the sample and are not concentrated on the surface, then it might be harder to detect them using XPS rather than using a bulk technique such as IR.
Figure 9.
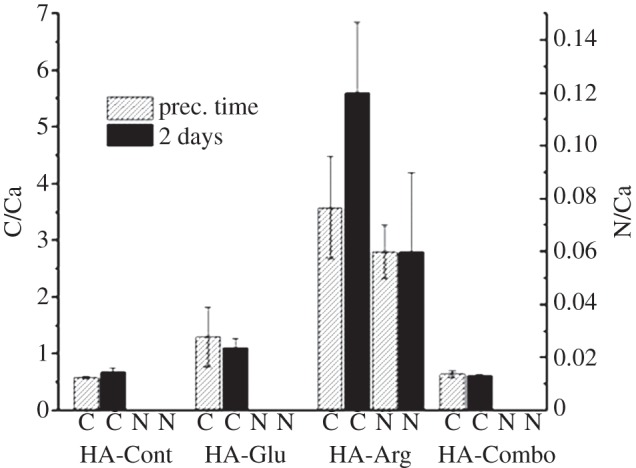
C and N atomic % relative to Ca atomic % for HA-Cont, HA-Glu, HA-Arg and HA-Combo at precipitation time and after 2 days of reaction, measured from XPS survey spectra. Asterisks indicate the samples that were statically significantly different from the control sample with p < 0.02.
Figure 10 shows the surface Ca/P ratios measured from XPS survey spectra. All samples showed Ca/P ratios lower than the stoichiometric value for HA (1.67). This may be attributed to the presence of Ca vacancies and less crystallinity at the surface of HA particles [48]. No significant difference was observed in the Ca/P ratios for the HA samples collected at the precipitation time, and all of them showed lower ratios than the corresponding samples after 2 days of reaction, indicating more highly defective surfaces at the early stage of precipitation. After 2 days of reaction, HA-Glu and HA-Arg showed a lower Ca/P ratio in comparison with the control samples. These results were consistent with the XRD results (figure 6b) showing ACP was still present in the HA-Glu and HA-Arg samples after 2 days of reaction.
Figure 10.
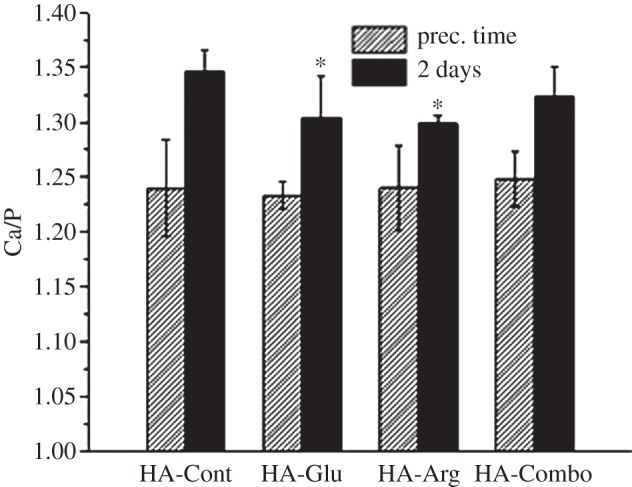
Ca atomic % relative to P atomic % for HA-Cont, HA-Glu, HA-Arg and HA-Combo at precipitation time and after 2 days of reaction, measured from XPS survey spectra. Asterisks indicate samples that were significantly different from HA-Cont (p < 0.03).
3.7. Colorimetric technique to measure the adsorption of amino acids to hydroxyapatite surfaces
The amount of adsorbed AAs on HA surfaces was further evaluated by measuring the amount of AAs remaining in solution after 2 days of reaction. The AAs remaining in solution were converted to a coloured derivative using ninhydrin, and the absorption of these compounds was evaluated with a UV–vis spectrometer according to a procedure widely reported in the literature [24]. By knowing the initial concentration of AAs in solution, it was then possible to estimate the amount of AAs adsorbed on HA particle surfaces. The amounts of adsorbed AAs were normalized with respect to the SSA of the particles reported in figure 5, and the final results are shown in table 3. In accordance with XPS results (figure 9), the AA that adsorbed in larger amount on HA after 2 days was Arg, and lower amounts were observed when Glu or both Glu and Arg were present during HA synthesis.
Table 3.
AAs adsorbed to HA particle surfaces after 2 days of reaction.
| sample | HA-Glu | HA-Arg | HA-Combo |
|---|---|---|---|
| adsorption of AAs to particles (mmol m−2) | 0.12 ± 0.03 | 0.39 ± 0.07 | 0.19 ± 0.02 |
3.8. ICP analysis on [Ca] and [P] in solution and on hydroxyapatite precipitates
[Ca] and [P] in the supernatant solution were measured by ICP shown in figure 11. A sharp decrease in both [Ca] and [P] was observed after 1 and 5 h on HA-Cont and HA-Combo, respectively. This time corresponded very well to the time at which visible precipitation occurred on these samples. However, for HA-Glu and HA-Arg, the curves relative to [Ca] and [P] showed a much less sharp decrease at 8 and 12 h, respectively. This time was earlier than the time at which visible precipitation was observed for HA-Glu (11 h) and HA-Arg (17 h). This most likely indicated the formation of smaller nuclei even before visible precipitation occurred for these samples. The longer delay observed before [Ca] and [P] decreased in HA-Arg and HA-Glu samples in comparison with HA-Cont and HA-Combo can be related to the inhibitory effect of Arg and Glu when they are present separately in the crystallization solution. This is consistent with the results obtained for precipitation times and precipitate weights shown in figures 1 and 2, respectively. Steady values of 0.4 mM for [Ca] and 0.2 mM for [P] were observed after 10 h for HA-Cont and HA-Combo, and after 24 h for HA-Glu and HA-Arg.
ICP-AES was also used to measure the amounts of Ca and P present in the precipitates. The resulting Ca/P atomic ratios are reported in figure 12. Values of approximately 1.55 were obtained for all samples except for HA-Cont after 2 days, which showed a significantly higher Ca/P ratio (1.76). Because the stoichiometric Ca/P value for HA is 1.67, these results confirm that the samples prepared in the presence of AAs never become fully crystalline HA, and are Ca-defective not only at their surface, where much lower Ca/P ratios were measured by XPS (figure 10), but also in the bulk. The achievement of a higher Ca/P value after 2 days of reaction for HA-Cont may indicate that this sample was more crystalline than the others, as previously observed in the XRD spectra (figure 6), which showed a smaller background for HA-Cont synthesized after 2 days than for the AA-containing samples.
Figure 12.
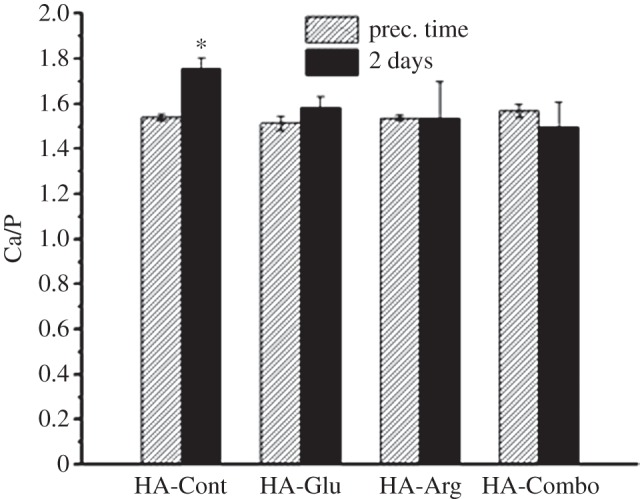
Bulk Ca/P atomic ratios as measured by ICP-AES on HA-Cont, HA-Glu, HA-Arg and HA-Combo at precipitation time and after 2 days of reaction. Asterisk indicates the sample that was significantly different from HA-Glu, HA-Arg and HA-Combo samples synthesized after 2 days (p < 0.05).
4. Discussion
We investigated the effect of Arg, Glu and their combination on HA crystallization with a number of techniques. From all the results obtained, we can outline three main discussion items.
(1) The positively charged AA (Arg) showed the strongest inhibitory effect on HA precipitation and the largest adsorption on HA, whereas the negatively charged AA (Glu) had the strongest effect on HA crystallization. Specifically, all of our results pointed out that Arg had the largest ability to inhibit HA nucleation (figure 1), it was adsorbed in more massive amounts to HA while it nucleated, and it remained adsorbed on the HA particles during the growth stage (indeed, as evidenced by IR (figure 8), XPS (figure 9) and colorimetric techniques (table 3), Arg was more abundant both at precipitation time and after 2 days of reaction). Despite this, the presence of Glu (alone or in combination with Arg) was more effective at inhibiting HA crystal growth (figure 7).
We can explain the stronger inhibitory effect of Arg on HA nucleation by considering what happens during crystal formation. At nucleation, the AAs present in solution can inhibit crystal formation by chelating the ions that form the crystals. We briefly review here what has been reported on complex formation between Arg and Glu and Ca2+ and PO43.
Interactions with Ca2+. Clarke & Martell [49] have investigated the formation of Arg/Ca2+ complexes at different pH, and they observed that at pH 7.4 complexes of the form HArgCa2+ are formed, whose stability constant (log K) is 2.21. To form such complexes, Arg (normally in the form H2Arg+ at pH 7.4) loses the proton in the α-amino position. Complexes between Glu and Ca2+ are more heavily investigated [50]. Lumb & Martell [51] estimated a value for log K of 1.43 for the formation of such complexes and, more recently, De Stefano et al. [52] estimated a value of 1.7. Both works hypothesize the formation of complexes of the type (CaHGlu+), where Glu is in the form HGlu−. This is the chemical species we expect for Glu at pH 7.4, in which the alpha-amino is neutral, and one of the carboxylate groups is deprotonated. Lumb & Martell [51], who analysed this complex in detail, concluded that the carboxylate group involved is the α, and not the γ-carboxylate. In fact, Ca2+ would be interacting with both the α-carboxy and the α-amino group. This hypothesis is in agreement with findings from older studies [53] focusing on interactions between Ca2+ and compounds containing both amino and carboxylate groups. By comparing the log K values reported for Arg/Ca and Glu/Ca complexes, we can conclude that Arg can interact more strongly with Ca than Glu. This is confirmed by a recent mass spectroscopy study by Ho et al. [54], who showed that among the 20 AAs, Arg is the one creating more stable homodymer complexes with Ca ions (Ca2+(Arg)(Arg)).
Interactions with PO43−. Arg is well known for its ability to interact with phosphate groups, and in fact this interaction is crucial in the stabilization of protein/nucleic acid complexes [55]. In these complexes, Arg is positively charged (H2Arg+), and phosphate groups interact with the guanidyl side chain of Arg [56]. A stability constant of 1.9 is reported by Lancelot et al. [56] for this complex. Glu/phosphate interactions, on the other hand, are not heavily investigated, most likely because they are not very strong. In fact, we could not find reported stability constants for complexes involving Glu and phosphate or phosphonate groups. To estimate the value of this constant, we can consider a study by Luscombe et al. [57]. In this work, the authors analysed the interactions between the 20 AAs and the bases and backbone groups of DNA by modelling 129 protein-DNA structures. With respect to interactions with phosphate groups in all the structures analysed, Arg was the AA that formed the largest number of hydrogen bonds and water-mediated bonds, and was second only to Lys in the number of van der Waals bonds formed. Glu instead was among the AAs forming the least number of bonds with phosphate groups. If we just consider the difference in number of hydrogen bonds observed in these 129 structures for Arg/phosphates and Glu/phosphates, we can roughly estimate the stability constant of Glu/PO43− to be to be 0.34 (see electronic supplementary material, S2 for more detail). These values clearly show that Arg has a much stronger tendency than Glu to interact with both Ca2+ and PO43−, thus indicating that these ions are less free to form calcium phosphate nuclei in the presence of Arg than of Glu. We hypothesize that this can explain why we observed a longer delay in HA precipitation in the presence of Arg than Glu (figure 1), and we found less precipitate after 2 days in the presence of Arg (figure 2). Also, the stronger tendency of Arg to interact with the ions in solution can explain why larger amounts of Arg than Glu were present in the HA-Arg sample at precipitation time (figure 9).
The effect of AAs on crystal growth is more complex than on nucleation, because during crystal growth AAs can both chelate the remaining ions and interact with the growing HA nuclei. HA particles at pH 7.4 are negatively charged, owing to the presence of Ca vacancies and to the acidic pKa of HA surfaces [10,24,58,59]. Therefore, a stronger electrostatic interaction should occur between HA growing nuclei and the positively charged AA, Arg. Indeed, our XPS (figure 9) and colorimetric results (table 3) showed the highest adsorption of Arg on HA after 2 days of reaction. These results seem to confirm Jack et al.'s results, who measured greater affinity constants of positively charged AAs towards HA surfaces [24], while disputing Koutsopoulos and Dalas’ results, who instead showed higher affinity of negatively charged AAs for HA surfaces [25]. However, more specific interactions need to be considered to explain the effect on crystal growth inhibition in specific directions. Several studies show that the chemical interactions between the zwitterionic alpha-amino and carboxylate groups and Ca and O atoms at HA surfaces are more crucial in determining the interactions between HA and AAs than the electrostatic interactions of AA side residues [24,60,61]. Jack et al. [24] showed that the main interaction between AAs and HA surfaces is through the covalent bonding between −COO− and calcium ions. Therefore, the stronger chemical bonding between Glu and HA surfaces might have been responsible for the stronger inhibitory effect of Glu on HA crystal growth despite of its lower adsorption to HA surfaces.
Also, here we found that both Arg and Glu were more effective in inhibiting crystallite growth along the [310] than the [002] direction (figure 7). This can be explained by considering the higher surface free energy of the (100) plane (almost perpendicular to [310]) than the (001) plane (perpendicular to [002]), and also the higher polarity of the (100) plane, which make it more favourable to interact with dipolar molecules such as AAs [62]. Also, there are six equivalent (100) surfaces in HA crystal while there are only two equivalent (001) surfaces. Therefore, the (100) surfaces are more prone to interact with the AAs, and the crystal growth is more influenced along their perpendicular [310] direction. Our results also showed that Glu was more effective than Arg in inhibiting crystallite growth along [310]. In line with the results reported in this paper, Palazzo et al. [10] showed that AAs had the ability to inhibit HA crystal growth. However, they reported the equal inhibitory effect for the negatively, positively and non- charged AAs while in this work we showed that the negatively charged AA, Glu, was more effective in reducing crystal growth along [310] axis. This discrepancy may be attributed to the different experimental conditions, such as lower pH and different precursors used in this experiment for HA precipitation.
The larger adsorption of Arg on HA compared with Glu might also be responsible for the lower SSA and porosity observed for HA-Arg particles (figure 5 and table 2). In fact, both Arg and Glu caused a decrease in SSA when present separately during the synthesis of HA; this has to be related to the formation of compact spherulitic particles, which have lower SSA compared with the loser aggregates formed in the absence of AAs. The larger decrease observed for HA-Arg can be attributed to the higher adsorption of this AA on HA. The presence of Arg could screen the negative charge on HA nanoparticles, thus decreasing their electrostatic repulsion and allowing them to get in more intimate contact and form microsphares with lower overall SSA.
(2) At precipitation time, both AAs induced the formation of spherulitic particles, while only random aggregates were found in the presence of tris alone (figures 3 and 4). The formation of HA spherulites under the influence of AAs and other organic additives is also reported by other authors [63,64], but the mechanism by which these small molecules induce such a micrometre-scale ordering is still unclear. Granasy et al. [65] showed that spherulitic particles form by growth front nucleation (GFN) in which new crystals nucleate at the surface with a different lattice orientation than the parent crystal. Thermodynamically, GFN is favoured at higher supersaturation, because the nucleation driving force is higher relative to the orientational mobility of crystals [63,64,66,67]. With increasing driving force, the branching frequency increases, and the particles assume an overall spherulitic morphology. However, GFN can also be favoured by kinetic factors, in systems where new crystals nucleate on random sites on the growing crystals surfaces, rather than in continuous layer-by-layer structures on the parent crystal, as would be predicted by the classical growth mechanism [66]. In fact, spherulite formation strongly depends on the surface structure of the growing seed crystals [68]. The formation of complexes between the AAs and Ca2+ and PO43− ions (see §4.1 and discussion relative to figure 11) indicates that the overall concentration of free Ca2+ and PO43− ions should be lower in the AA-containing samples compared with the control sample. Thus, the effective supersaturation at which precipitation occurs in the AA-containing samples should be lower than in the control sample. This implies that the observation of more spherulitic particles for HA-Glu and HA-Arg than HA-Cont and HA-Combo cannot be explained based on thermodynamics. Instead, the presence of AAs interacting with the growing crystalline surfaces (confirmed by both IR (figure 8) and XPS (figure 9) results) may provide differently charged sites for the random nucleation and growth of HA, thus kinetically favouring spherulite formation. The XRD results shown in figure 7 confirmed that the GFN mechanism was more favoured for the HA-Arg and HA-Glu than the HA-Cont and HA-Combo samples: the average crystallite size along [310] increased with time for HA-Cont and HA-Combo while the crystallite size along [310] decreased for H-Glu, and did not significantly change for the HA-Arg. This is consistent with the GFN mechanism for HA-Arg and HA-Glu: on these samples, new crystals grow with different orientations relative to the parent crystals, thus resulting in smaller average crystallite sizes and no significant overall crystal growth, differently from the classical model in which the parent crystal grows continuously [62].
(3) The combination of Arg and Glu in the same solution resulted in a much smaller effect on HA precipitation than when any of the AA was present alone. Specifically, we observed fewer AAs adsorbed on HA particles in HA-Combo than on HA-Arg or HA-Glu (figures 8 and 9), a more similar surface Ca/P ratio for this sample to HA-Cont (figure 10), weaker effect on precipitation time (figures 1 and 11) and precipitate weights (figure 2), and on the morphology of HA particles during the early stage of precipitation (figure 3g,h). These results can be explained by considering that when the two AAs are present in solution together, they have a higher tendency to interact with each other rather than with the ions in solution. Indeed, the interaction between Arg and carboxylate groups is known to be very strong, and crucial in the selective recognition of nucleic acid base sequences by proteins containing Arg in their structure [55]. This strong interaction is due to the formation of ion pairs between the positively charged guanidyl side groups of Arg and negatively charged γ-carboxylate groups of Glu [69]. The reported log K for this interaction is 2.3 [56], which is higher than any of those reported for Arg or Glu and Ca2+ or PO43− [49,51,56]. This high constant can also help explain why some of the HA-Combo results were more similar to HA-Glu than to HA-Arg (see the results relative to crystal size (figure 7), surface area (figure 5) and affinity to HA surfaces (table 3)). Indeed, Arg can interact with carboxylate groups from both Glu and from other Arg molecules. Hence, more Glu than Arg is free in solution to interact with growing HA nuclei.
These observations imply that if more than one type of AAs is present in solution, the effects of the single AAs do not simply add up. Rather, they can end up damping each other, because the AAs can form complexes among themselves rather than with the ions in solution. This behaviour would be observed to a much lower extent if the AAs were bound together along protein or peptide chains, because their ability to combine with each other would be severely limited. Still, the affinity constant between Arg and carboxylate groups is almost as high as that measured for poly(Glu) and HA (199.5 [56] versus 240 [70], respectively), which indicates that even in the presence of proteins or peptides, complexes formed between terminal AAs and side groups of AAs could be partially responsible for the overall effect observed on HA formation.
5. Conclusions
Polar and charged AAs are the main components of NCPs, and are involved in HA mineralization in bone. These AAs are able to inhibit HA mineralization by binding to the nuclei of HA and preventing their further growth. Here, we investigated the effect of a positively charged AA, Arg and a negatively charged one, Glu, as well as their combination, at physiological pH and temperature. Our results showed that the positively charged AA, Arg, had a stronger inhibitory effect on HA formation, and was adsorbed in larger amount on HA particles, whereas the negatively charged AA, Glu, was more effective in inhibiting HA crystal growth along specific crystallographic directions. These results were interpreted in terms of the differences in stability constants between AAs and the ions in solution. The formation of AA/ion complexes was also deemed responsible for the observed formation of spherulitic particles in the presence of either Arg or Glu. We also showed that the inhibitory effect of the single AAs on HA nucleation was dampened if the two AAs were present together in solution, which we interpreted to be a consequence of the preferential interaction of the AAs with each other rather than with ions or nuclei in solution.
Overall, this study gives a basis for the understanding of the effect of single AAs on HA mineralization in physiological conditions, and may provide a guideline to rationally designed oligopeptides with the purpose of inhibiting HA nucleation. These could be used for treating pathological diseases caused by an excessive mineralization of HA in tissues such as cartilage, blood vessels and cardiac valves.
Acknowledgements
This research project is supported by the McGill Engineering Doctoral Award, the Canada Research Chair foundation, and the Canada Foundation for Innovation.
References
- 1.De Yoreo JJ, Wierzbicki A, Dove PM. 2007. New insights into mechanisms of biomolecular control on growth of inorganic crystals. Cryst. Eng. Comm. 9, 1144–1152 10.1039/B713006F (doi:10.1039/B713006F) [DOI] [Google Scholar]
- 2.Dickerson MB, Sandhage KH, Naik RR. 2008. Protein- and peptide-directed syntheses of inorganic materials. Chem. Rev. 108, 4935–4978 10.1021/cr8002328 (doi:10.1021/cr8002328) [DOI] [PubMed] [Google Scholar]
- 3.Weiner S, Dove PM. 2003. An overview of biomineralization processes and the problem of the vital effect. Biomineralization 54, 1–29 [Google Scholar]
- 4.Dujardin E, Mann S. 2002. Bio-inspired materials chemistry. Adv. Mater. 14, 775–788 (doi:10.1002/1521-4095(20020605)14:11<775::AID-ADMA775>3.0.CO;2-0) [DOI] [Google Scholar]
- 5.Patwardhan SV, Patwardhan G, Perry CC. 2007. Interactions of biomolecules with inorganic materials: principles, applications and future prospects. J. Mater. Chem. 17, 2875–2884 10.1039/b704075j (doi:10.1039/b704075j) [DOI] [Google Scholar]
- 6.Silver FH, Landis WJ. 2011. Deposition of apatite in mineralizing vertebrate extracellular matrices: a model of possible nucleation sites on type I collagen. Connect. Tissue Res. 52, 242–254 10.3109/03008207.2010.551567 (doi:10.3109/03008207.2010.551567) [DOI] [PubMed] [Google Scholar]
- 7.George A, Veis A. 2008. Phosphorylated proteins and control over apatite nucleation, crystal growth, and inhibition. Chem. Rev. 108, 4670–4693 10.1021/cr0782729 (doi:10.1021/cr0782729) [DOI] [PMC free article] [PubMed] [Google Scholar]
- 8.Song J, Viengkham M, Bertozzi CR. 2005. Mineralization of synthetic polymer scaffolds: a bottom-up approach for the development of artificial bone. J. Am. Chem. Soc. 127 3366–3372 10.1021/ja043776z (doi:10.1021/ja043776z) [DOI] [PubMed] [Google Scholar]
-
9.Almora-Barrios N, Austen KF, de Leeuw NH.
2009.
Density functional theory study of the binding of glycine, proline, and hydroxyproline to the hydroxyapatite (0001) and
 surfaces.
Langmuir
25, 5018–5025 10.1021/la803842g (doi:10.1021/la803842g) [DOI] [PubMed] [Google Scholar]
 - 10.Palazzo B, Walsh D, Iafisco M, Foresti E, Bertinetti L, Martra G, Bianchi CL, Cappelletti G, Roveri N. 2009. Amino acid synergetic effect on structure, morphology and surface properties of biomimetic apatite nanocrystals. Acta Biomater. 5, 1241–1252 10.1016/j.actbio.2008.10.024 (doi:10.1016/j.actbio.2008.10.024) [DOI] [PubMed] [Google Scholar]
- 11.Stegink LD, Filer LJ, Brummel MC, Baker GL, Krause WL, Bell EF, Ziegler EE. 1991. Plasma amino acid concentrations and amino acid ratios in normal adults and adults heterozygous for phenylketonuria ingesting a hamburger and milk shake meal. Am. J. Clin. Nutr. 53, 670–675 [DOI] [PubMed] [Google Scholar]
- 12.Almora-Barrios N, de Leeuw NH. 2010. A density functional theory study of the interaction of collagen peptides with hydroxyapatite surfaces. Langmuir 26, 14 535–14 542 10.1021/la101151e (doi:10.1021/la101151e) [DOI] [PubMed] [Google Scholar]
- 13.Pan H, Tao J, Xu X, Tang R. 2007. Adsorption processes of Gly and Glu amino acids on hydroxyapatite surfaces at the atomic level. Langmuir 23, 8972–8981 10.1021/la700567r (doi:10.1021/la700567r) [DOI] [PubMed] [Google Scholar]
- 14.Sugino A, Miyazaki T, Ohtsuki C. 2008. Apatite-forming ability of polyglutamic acid hydrogels in a body-simulating environment. J. Mater. Sci. 19, 2269–2274 10.1007/s10856-007-3327-8 (doi:10.1007/s10856-007-3327-8) [DOI] [PubMed] [Google Scholar]
- 15.Chu X, Jiang W, Zhang Z, Yan Y, Pan H, Xu X, Tang R. 2010. Unique roles of acidic amino acids in phase transformation of calcium phosphates. J. Phys. Chem. B 115, 1151–1157 10.1021/jp106863q (doi:10.1021/jp106863q) [DOI] [PubMed] [Google Scholar]
- 16.Boskey AL. 2002. Pathogenesis of cartilage calcification: mechanisms of crystal deposition in cartilage. Curr. Rheumatol. Rep. 4, 245–251 10.1007/s11926-002-0072-3 (doi:10.1007/s11926-002-0072-3) [DOI] [PubMed] [Google Scholar]
- 17.Gordon GV, Villanueva T, Schumacher HR, Gohel V. 1984. Autopsy study correlating degree of osteoarthritis, synovitis and evidence of articular calcification. J. Rheumatol. 11, 681–686 [PubMed] [Google Scholar]
- 18.Koutsopoulos S, Kontogeorgou A, Dalas E, Petroheilos J. 1998. Calcification of porcine and human cardiac valves: testing of various inhibitors for antimineralization. J. Mater. Sci. 9, 421–424 10.1023/A:1013291715326 (doi:10.1023/A:1013291715326) [DOI] [PubMed] [Google Scholar]
- 19.Tsao JW, Schoen FJ, Shankar R, Sallis JD, Levy RJ. 1988. Retardation of calcification of bovine pericardium used in bioprosthetic heart valves by phosphocitrate and a synthetic analogue. Biomaterials 9, 393–397 10.1016/0142-9612(88)90002-6 (doi:10.1016/0142-9612(88)90002-6) [DOI] [PubMed] [Google Scholar]
- 20.Hartgerink JD, Beniash E, Stupp SI. 2001. Self-assembly and mineralization of peptide–amphiphile nanofibers. Science 294, 1684–1688 10.1126/science.1063187 (doi:10.1126/science.1063187) [DOI] [PubMed] [Google Scholar]
- 21.He G, Dahl T, Veis A, George A. 2003. Nucleation of apatite crystals in vitro by self-assembled dentin matrix protein 1. Nat. Mater. 2, 552–558 10.1038/nmat945 (doi:10.1038/nmat945) [DOI] [PubMed] [Google Scholar]
- 22.Ito S, Saito T, Amano K. 2004. In vitro apatite induction by osteopontin: interfacial energy for hydroxyapatite nucleation on osteopontin. J. Biomed. Mater. Res. A 69, 11–16 10.1002/jbm.a.20066 (doi:10.1002/jbm.a.20066) [DOI] [PubMed] [Google Scholar]
- 23.Saito T, Yamauchi M, Abiko Y, Matsuda K, Crenshaw MA. 2000. In vitro apatite induction by phosphophoryn immobilized on modified collagen fibrils. J. Bone Mineral Res. 15, 1615–1619 10.1359/jbmr.2000.15.8.1615 (doi:10.1359/jbmr.2000.15.8.1615) [DOI] [PubMed] [Google Scholar]
- 24.Jack KS, Vizcarra TG, Trau M. 2007. Characterization and surface properties of amino-acid-modified carbonate-containing hydroxyapatite particles. Langmuir 23, 12 233–12 242 10.1021/la701848c (doi:10.1021/la701848c) [DOI] [PubMed] [Google Scholar]
- 25.Dalas E, Malkaj P, Vasileiou Z, Kanellopoulou D. 2008. The effect of leucine on the crystal growth of calcium phosphate. J. Mater. Sci. 19, 277–282 10.1007/s10856-006-0050-9 (doi:10.1007/s10856-006-0050-9) [DOI] [PubMed] [Google Scholar]
- 26.Koutsopoulos S, Dalas E. 2000. Inhibition of hydroxyapatite formation in aqueous solutions by amino acids with hydrophobic side groups. Langmuir 16, 6739–6744 10.1021/la000057z (doi:10.1021/la000057z) [DOI] [Google Scholar]
- 27.Koutsopoulos S, Dalas E. 2000. Hydroxyapatite crystallization in the presence of serine, tyrosine and hydroxyproline amino acids with polar side groups. J. Cryst. Growth 216, 443–449 10.1016/S0022-0248(00)00415-2 (doi:10.1016/S0022-0248(00)00415-2) [DOI] [Google Scholar]
- 28.Koutsopoulos S, Dalas E. 2000. The effect of acidic amino acids on hydroxyapatite crystallization. J. Cryst. Growth 217, 410–415 10.1016/S0022-0248(00)00502-9 (doi:10.1016/S0022-0248(00)00502-9) [DOI] [Google Scholar]
- 29.Koutsopoulos S, Dalas E. 2001. Hydroxyapatite crystallization in the presence of amino acids with uncharged polar side groups: glycine, cysteine, cystine, and glutamine. Langmuir 17, 1074–1079 10.1021/la000820p (doi:10.1021/la000820p) [DOI] [Google Scholar]
- 30.Gonzalez-McQuire R, Chane-Ching J-Y, Vignaud E, Lebugle A, Mann S. 2004. Synthesis and characterization of amino acid-functionalized hydroxyapatite nanorods. J. Mater. Chem. 14, 2277–2281 10.1039/b400317a (doi:10.1039/b400317a) [DOI] [Google Scholar]
- 31.Matsumoto T, Okazaki M, Inoue M, Hamada Y, Taira M, Takahashi J. 2002. Crystallinity and solubility characteristics of hydroxyapatite adsorbed amino acid. Biomaterials 23, 2241–2247 10.1016/S0142-9612(01)00358-1 (doi:10.1016/S0142-9612(01)00358-1) [DOI] [PubMed] [Google Scholar]
- 32.McDowell H, Gregory TM, Brown WE. 1977. Solubility of Ca5(PO4)3OH in the system Ca(OH)2-H3PO4-H2O at 5°C, 15°C, 25°C and 37°C. J. Res. Natl Bureau Stand. A Phys. Chem. 81, 670–675 [Google Scholar]
- 33.Venkateswarlu K, Chandra Bose A, Rameshbabu N. 2010. X-ray peak broadening studies of nanocrystalline hydroxyapatite by Williamson–Hall analysis. Physica B 405, 4256–4261 10.1016/j.physb.2010.07.020 (doi:10.1016/j.physb.2010.07.020) [DOI] [Google Scholar]
- 34.Gregg SJ, Sing KSW. 1982. Adsorption, surface area and porosity, 2nd edn London, UK: Academic Press [Google Scholar]
- 35.Brunauer S, Emmett PH, Teller E. 1938. Adsorption of gases in multimolecular layers. J. Am. Chem. Soc. 60, 309–319 10.1021/ja01269a023 (doi:10.1021/ja01269a023) [DOI] [Google Scholar]
- 36.Lippens BC, de Boer JH. 1965. Studies on pore systems in catalysts: V. The t method. J. Catal. 4, 319–323 10.1016/0021-9517(65)90307-6 (doi:10.1016/0021-9517(65)90307-6) [DOI] [Google Scholar]
- 37.Lee YP, Takahashi T. 1966. An improved colorimetric determination of amino acids with the use of ninhydrin. Anal. Biochem. 14, 71–77 10.1016/0003-2697(66)90057-1 (doi:10.1016/0003-2697(66)90057-1) [DOI] [Google Scholar]
- 38.Duggan P, Donnelly D, Melody D. 1964. The reaction of glyoxylate with tris buffer under physiological conditions. Irish J. Med. Sci. 39, 163–168 10.1007/BF02969129 (doi:10.1007/BF02969129) [DOI] [PubMed] [Google Scholar]
- 39.Kokubo T, Takadama H. 2006. How useful is SBF in predicting in vivo bone bioactivity? Biomaterials 27, 2907–2915 10.1016/j.biomaterials.2006.01.017 (doi:10.1016/j.biomaterials.2006.01.017) [DOI] [PubMed] [Google Scholar]
- 40.El-Harakany AA, Abdel Halim FM, Barakat AO. 1984. Dissociation constants and related thermodynamic quantities of the protonated acid form of tris-(hydroxymethyl)-aminomethane in mixtures of 2-methoxyethanol and water at different temperatures. J. Electroanal. Chem. Interfacial Electrochem. 162, 285–305 10.1016/S0022-0728(84)80171-0 (doi:10.1016/S0022-0728(84)80171-0) [DOI] [Google Scholar]
- 41.Silberberg MS. 2009. Chemistry, 5th edn London, UK: McGraw-Hill [Google Scholar]
- 42.Cai Y, Tang R. 2008. Calcium phosphate nanoparticles in biomineralization and biomaterials. J. Mater. Chem. 18, 3775–3787 10.1039/b805407j (doi:10.1039/b805407j) [DOI] [Google Scholar]
- 43.Cheng ZH, Yasukawa A, Kandori K, Ishikawa T. 1998. FTIR study of adsorption of CO2 on nonstoichiometric calcium hydroxyapatite. Langmuir 14, 6681–6686 10.1021/la980339n (doi:10.1021/la980339n) [DOI] [Google Scholar]
- 44.Hutchens SA, Benson RS, Evans BR, O'Neill HM, Rawn CJ. 2006. Biomimetic synthesis of calcium-deficient hydroxyapatite in a natural hydrogel. Biomaterials 27, 4661–4670 10.1016/j.biomaterials.2006.04.032 (doi:10.1016/j.biomaterials.2006.04.032) [DOI] [PubMed] [Google Scholar]
- 45.Fowler BO, Markovic M, Brown WE. 1993. Octacalcium phosphate. 3. Infrared and Raman vibrational spectra. Chem. Mater. 5, 1417–1423 10.1021/cm00034a009 (doi:10.1021/cm00034a009) [DOI] [Google Scholar]
- 46.Pleshko N, Boskey A, Mendelsohn R. 1991. Novel infrared spectroscopic method for the determination of crystallinity of hydroxyapatite minerals. Biophys. J. 60, 786–793 10.1016/S0006-3495(91)82113-0 (doi:10.1016/S0006-3495(91)82113-0) [DOI] [PMC free article] [PubMed] [Google Scholar]
- 47.Webb LJ, Rivillon S, Michalak DJ, Chabal YJ, Lewis NS. 2006. Transmission infrared spectroscopy of methyl- and ethyl-terminated silicon(111) surfaces. J. Phys. Chem. B 110, 7349–7356 10.1021/jp054618c (doi:10.1021/jp054618c) [DOI] [PubMed] [Google Scholar]
- 48.Bertinetti L, Tampieri A, Landi E, Ducati C, Midgley PA, Coluccia S, Martra G. 2007. Surface structure, hydration, and cationic sites of nanohydroxyapatite: UHR-TEM, IR, and microgravimetric studies. J. Phys. Chem. C 111, 4027–4035 10.1021/jp066040s (doi:10.1021/jp066040s) [DOI] [Google Scholar]
- 49.Clarke ER, Martell AE. 1970. Metal chelates of arginine and related ligands. J. Inorg. Nucl. Chem. 32, 911–926 10.1016/0022-1902(70)80070-7 (doi:10.1016/0022-1902(70)80070-7) [DOI] [Google Scholar]
- 50.Daniele PG, Foti C, Gianguzza A, Prenesti E, Sammartano S. 2008. Weak alkali and alkaline earth metal complexes of low molecular weight ligands in aqueous solution. Coord. Chem. Rev. 252, 1093–1107 10.1016/j.ccr.2007.08.005 (doi:10.1016/j.ccr.2007.08.005) [DOI] [Google Scholar]
- 51.Lumb RF, Martell AE. 1953. Metal chelating tendencies of glutamic and aspartic acids. J. Phys. Chem. 57, 690–693 10.1021/j150508a021 (doi:10.1021/j150508a021) [DOI] [Google Scholar]
- 52.De Stefano C, Foti C, Gianguzza A. 1995. Ligand–ligand complexes of ethylenediaminetetracetic acid and histidine or ethylenediamine. Ann. Chim. 85, 69–75 [Google Scholar]
- 53.Davies CW. 1938. The extent of dissociation of salts in water. VI. Some calcium salts of organic acids. J. Chem. Soc. 56, 277–281 10.1039/jr9380000277 (doi:10.1039/jr9380000277) [DOI] [Google Scholar]
- 54.Ho Y-P, Yang M-W, Chen L-T, Yang Y-C. 2007. Relative calcium-binding strengths of amino acids determined using the kinetic method. Rapid Commun. Mass Spectrom. 21, 1083–1089 10.1002/rcm.2927 (doi:10.1002/rcm.2927) [DOI] [PubMed] [Google Scholar]
- 55.Lancelot G, Hélène C. 1977. Selective recognition of nucleic acids by proteins: the specificity of guanine interaction with carboxylate ions. Proc. Natl Acad. Sci. USA 74, 4872–4875 10.1073/pnas.74.11.4872 (doi:10.1073/pnas.74.11.4872) [DOI] [PMC free article] [PubMed] [Google Scholar]
- 56.Lancelot G, Mayer R, Hélène C. 1979. Models of interaction between nucleic acids and proteins. Hydrogen bonding of arginine with nucleic acid bases, phosphate groups and carboxylic acids. Biochim. Biophys. Acta 564, 181–190 10.1016/0005-2787(79)90217-X (doi:10.1016/0005-2787(79)90217-X) [DOI] [PubMed] [Google Scholar]
- 57.Luscombe NM, Laskowski RA, Thornton JM. 2001. Amino acid–base interactions: a three-dimensional analysis of protein–DNA interactions at an atomic level. Nucleic Acids Res. 29, 2860–2874 10.1093/nar/29.13.2860 (doi:10.1093/nar/29.13.2860) [DOI] [PMC free article] [PubMed] [Google Scholar]
- 58.Skartsila K, Spanos N. 2007. Surface characterization of hydroxyapatite: potentiometric titrations coupled with solubility measurements. J. Colloid Interface Sci. 308, 405–412 10.1016/j.jcis.2006.12.049 (doi:10.1016/j.jcis.2006.12.049) [DOI] [PubMed] [Google Scholar]
- 59.Brown PW, Martin RI. 1999. An analysis of hydroxyapatite surface layer formation. J. Phys. Chem. B 103, 1671–1675 10.1021/jp982554i (doi:10.1021/jp982554i) [DOI] [Google Scholar]
- 60.Misra DN. 1999. Interaction of citric or hydrochloric acid with calcium fluorapatite: precipitation of calcium fluoride. J. Colloid Interface Sci. 220, 387–391 10.1006/jcis.1999.6537 (doi:10.1006/jcis.1999.6537) [DOI] [PubMed] [Google Scholar]
- 61.Rimola A, Corno M, Zicovich-Wilson CM, Ugliengo P. 2008. Ab initio modeling of protein/biomaterial interactions: glycine adsorption at hydroxyapatite surfaces. J. Am. Chem. Soc. 130, 16 181–16 183 10.1021/ja806520d (doi:10.1021/ja806520d) [DOI] [PubMed] [Google Scholar]
- 62.Corno M, Rimola A, Bolis V, Ugliengo P. 2010. Hydroxyapatite as a key biomaterial: quantum-mechanical simulation of its surfaces in interaction with biomolecules. Phys. Chem. Chem. Phys. 12, 6309–6329 10.1039/c002146f (doi:10.1039/c002146f) [DOI] [PubMed] [Google Scholar]
- 63.He QJ, Huang ZL. 2007. Controlled growth and kinetics of porous hydroxyapatite spheres by a template-directed method. J. Cryst. Growth 300, 460–466 10.1016/j.jcrysgro.2006.11.226 (doi:10.1016/j.jcrysgro.2006.11.226) [DOI] [Google Scholar]
- 64.Teshima K, Sakurai M, Lee S, Yubuta K, Ito S, Suzuki T, Shishido T, Endo M, Oishi S. 2008. Morphologically controlled fibrous spherulites of an apatite precursor biocrystal. Cryst. Growth Design 9, 650–652 10.1021/cg800791s (doi:10.1021/cg800791s) [DOI] [Google Scholar]
- 65.Granasy L, Pusztai T, Tegze G, Warren JA, Douglas JF. 2005. Growth and form of spherulites. Phys. Rev. E Stat. Nonlinear Soft Matter Phys. 72, 19. [DOI] [PubMed] [Google Scholar]
- 66.Beck R, Andreassen J-P. 2010. Spherulitic growth of calcium carbonate. Crystal Growth Design 10, 2934–2947 10.1021/cg901460g (doi:10.1021/cg901460g) [DOI] [Google Scholar]
- 67.Keith HD, Padden FJ. 1963. A phenomenological theory of spherulitic crystallization. J. Appl. Phys. 34, 2409–2421 10.1063/1.1702757 (doi:10.1063/1.1702757) [DOI] [Google Scholar]
- 68.Andreassen J-P, Hounslow MJ. 2004. Growth and aggregation of vaterite in seeded-batch experiments. AIChE J. 50, 2772–2782 10.1002/aic.10205 (doi:10.1002/aic.10205) [DOI] [Google Scholar]
- 69.Bhat TN, Vijayan M. 1977. X-ray studies of crystalline complexes involving amino acids. II. The crystal structure of l-arginine l-glutamate. Acta Crystallogr. B 33, 1754–1759 10.1107/S0567740877007018 (doi:10.1107/S0567740877007018) [DOI] [Google Scholar]
- 70.Tsortos A, Nancollas GH. 2002. The role of polycarboxylic acids in calcium phosphate mineralization. J. Colloid Interface Sci. 250, 159–167 10.1006/jcis.2002.8323 (doi:10.1006/jcis.2002.8323) [DOI] [PubMed] [Google Scholar]


