Abstract
The field of biomaterials research is witnessing a steady rise in high-throughput screening approaches, comprising arrays of materials of different physico-chemical composition in a chip format. Even though the cell arrays provide many benefits in terms of throughput, they also bring new challenges. One of them is the establishment of robust homogeneous cell seeding techniques and strong control over cell culture, especially for long time periods. To meet these demands, seeding cells with low variation per tester area is required, in addition to robust cell culture parameters. In this study, we describe the development of a modular chip carrier which represents an important step in standardizing cell seeding and cell culture conditions in array formats. Our carrier allows flexible and controlled cell seeding and subsequent cell culture using dynamic perfusion. To demonstrate the application of our device, we successfully cultured and evaluated C2C12 premyoblast cell viability under dynamic conditions for a period of 5 days using an automated pipeline for image acquisition and analysis. In addition, using computational fluid dynamics, lactate and BMP-2 as model molecules, we estimated that there is good exchange of nutrients and metabolites with the flowing medium, whereas no cross-talk between adjacent TestUnits should be expected. Moreover, the shear stresses to the cells can be tailored uniformly over the entire chip area. Based on these findings, we believe our chip carrier may be a versatile tool for high-throughput cell experiments in biomaterials sciences.
Keywords: high throughput, computational fluid dynamics modelling, cell–biomaterial interactions
1. Introduction
Biomaterials are being used for a wide range of clinical applications, ranging from sutures, stents and orthopaedic implants to contact lenses. In many cases, the interaction of the material surface with that of recipient's cells determines whether the material is accepted or rejected by the body. In addition, the field of biomaterials is changing from the use of bioinert materials to that of more bioactive materials. To realize the emergence of bioactive materials, different functionalization techniques such as topographic patterning, peptide patterning, plasma etching and combinatorial chemistry are being developed [1,2]. Each of these emerging techniques generates enormous possibilities in terms of physico-chemical variations. For instance, if we consider surface topographies alone, the geometrical possibilities in terms of shapes and sizes of surface features are virtually unlimited. Micro- and nanotechnologies and robotics have been pivotal in enabling scaling down the assays and testing a multitude of materials and their properties [1,3–5]. Often, this is approached by fabricating arrays of a variety of material properties, typically using a microscopic slide format in terms of dimensions [3,6]. For example, Anderson and co-workers [7] have investigated the effect of embryonic stem cell behaviour on polymer libraries. We recently developed a high-throughput platform for systematically studying the effect of thousands of surface topographies on cell behaviour [2]. For studying a multitude of biomaterial properties, biological assays need to be miniaturized to accommodate a higher number of materials, which is similar to the drug discovery approaches used in the pharmaceutical industry [8]. By growing cells on arrays of biomaterials, extensive control over the spatio-temporal features of the cellular microenvironment, requirement of low sample volumes, high-throughput and shorter evaluation periods can be achieved. One of the challenges for high-content imaging on arrays of biomaterials is to determine the critical number of cells to acquire statistically significant data, which is hampered by the heterogeneity of the initial seeding density of cells. In contrast to screening using well plates where cells are dispensed per well, cell seeding on arrays is a stochastic phenomenon, similar to DNA microarrays. In the latter case, the cell lysate has to be distributed uniformly on the arrays to avoid inconsistent data. Recently, we developed a chip for high-throughput screening of surface topographies [2], i.e. TopoChip, with 4356 areas each with a given surface structure referred to as TopoUnits across a grid of 66 rows and 66 columns. Each TopoUnit is a 290 × 290 µm area separated by 10 µm thick and 50 µm high walls.
Here, we describe fabrication of a generic microfluidic chip carrier for gravity-driven cell seeding, which can also be used as a perfusion chip bioreactor for long-term culturing. The cell seeding homogeneity and cell viability is studied while possible chemical communication between tester areas and the shear stress to the cells is estimated using computer fluid dynamics modelling.
The developed device may be suitable for a variety of biomaterials arrays including (but not limited to) combinatorial polymer libraries, surface topographic arrays, microcontact printed protein/peptide arrays and is amenable to high-content imaging.
2. Material and methods
2.1. Design and fabrication of the chip carrier
A computer-aided design (CAD) was generated using SolidWorks 3D CAD/CAM software. The drawing of the assembly consisted of two units, being the chip carrier and the closing lid (figure 1a,b). The length and width of the slide part was designed similar to that of a conventional microscopic slide, i.e. 76 × 26 mm. The maximum height was 6 mm. One large chamber in the centre of 21 × 21 mm and a depth of 0.5 mm was designed to secure the chip in position. All these dimensions can be suitably tuned according to the dimensions of the chip and the sizes of the features or testing areas on the chip. In the chamber, the chip can be slid into slots and kept in place.
Figure 1.
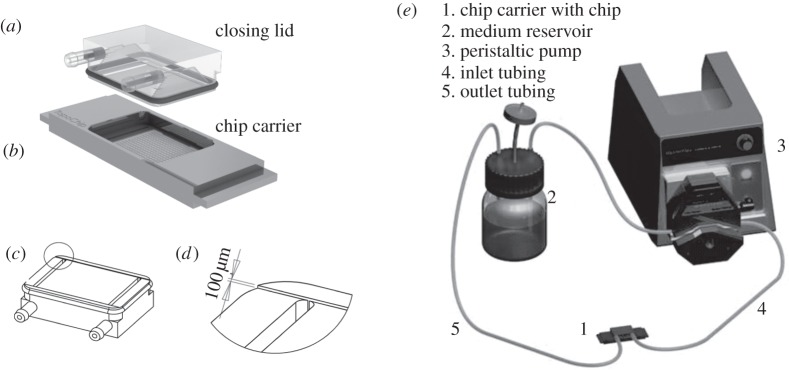
Chip carrier components. (a) The closing lid with inlet and outlet ports for perfusion. The closing lid fits tightly on the chip carrier with an O-ring, fitted in a channel groove. (b) The chip carrier with dimensions of a conventional microscope slide of 76 × 21 mm, containing a chip, which is held in place by slots. (c) Schematic of an inverted closing lid displaying inlet and outlet ports and the perfusion flow channel with a 0.1 mm depth, 23 mm width and 33 mm length, which determines medium volume on the chip. (d) Inset of the closing lid, showing perfusion flow channel in more detail. (e) Schematic of a closed chip carrier connected to a medium reservoir and a peristaltic pump to function as a flow microbioreactor.
The closing lid fits in the chip carrier and is designed to accommodate an O-ring around the border using a channel groove throughout the height. An O-ring is used as a packing to secure the closing lid in the right orientation and to prevent leakage during subsequent culture. Additionally, the closing lid was fabricated to accommodate two fluidic channels from the sides. One of the fluidic channels can act as inlet and the other as outlet for perfusion of cell culture medium. A channel of 0.1 mm depth, 23 mm width and 33 mm length was fabricated on the surface of the closing lid facing the chip to facilitate the flow of the medium (figure 1c,d). The depth of this channel can be tailored to control the cell seeding density.
The device components were fabricated by conventional computer numerical control (CNC) machining. The slide part was fabricated from anodized aluminium with a glass bottom for the chip chamber. The closing lid as well as the medium reservoir for static culture was fabricated from poly(methyl-methacrylate) blocks.
2.2. Chip design and fabrication
Briefly, the chips used in the present study were designed using Clewin v. 4.0 software. The 2 × 2 cm chip incorporates a grid of small units (TestUnits). The lateral dimensions of the TestUnits are 290 × 290 µm and with a 10 µm wide and 50 µm high ridge separating adjacent units, leading to a total number of 4356 spread across a grid of 66 rows and 66 columns TestUnits per chip. The bottom of the TestUnits is uniform and unpatterned, in contrast to the previously reported TopoChip [2].
Chips were fabricated using a silicon mould processed by photolithography and etching. This mould was subsequently used to imprint the patterns onto sheets from poly(dl-lactic acid) (PDLLA, 250 µm thickness, Folienwerk Wolfen GmbH, Germany), by hot-embossing. For imprinting, a PDLLA sheet was loaded into a machine for hot-embossing nanoimprint lithography (NIL 6″, Obducat AB, Sweden) together with the mould. First, the sheet was heated up to 80°C, then 3 MPa pressure was applied for 10 min, later the temperature was reduced to 38°C with subsequent release of the pressure. The sheet and the mould were allowed to cool down to room temperature prior to releasing the film from the mould.
2.3. Cell culture and imaging
A pre-myoblast cell line C2C12 (ATCC CRL 1772) was used for cell culture studies. The cells were cultured in medium containing Dulbecco's modified Eagle's medium (DMEM, Gibco), supplemented with 10 per cent foetal bovine serum (FBS, Lonza) and 1 per cent penicillin and streptomycin (Gibco) and grown at 37°C in a 5 per cent carbon dioxide humidified environment. Prior to seeding the cells were labelled with CM-DiI (Invitrogen D282) according to manufacturer's protocol.
A peristaltic pump with a closed loop and medium reservoir as illustrated in figure 1e was used for continuous perfusion of the setup. The cells were cultured for 5 days with a flow rate of 100 µl min−1. A live/dead assay (molecular probes) was used to access cell viability according to the manufacturer's protocol.
The chips were imaged with a BD Pathway 435 bioimager by designing a macro to autofocus on the fluorescent channel. Grey-scale images were independently acquired by using the montage function. Individual montages were stitched together to obtain a composite image of the whole chip for each individual channel. The image was then subjected to background and alignment correction using a customized Matlab script. Out of focus TestUnits on the images were detected using Laplace filter and excluded from subsequent analysis. Images of individual TestUnits were then cropped from the composite image and subjected to analysis using CellProfiler over a computer cluster.
2.4. Computational fluid dynamics modelling
Computational fluid dynamics (CFD) modelling was performed to evaluate the transport of secreted proteins and metabolites as well as the shear stresses generated by the flow within the chip. The study was carried out using commercial CFD software COMSOL Multiphysics v. 3.5a, using bone morphogenic protein 2 (BMP-2) and lactate model components. BMP-2 is a molecule representative of secreted proteins and if carried over to adjacent TestUnits in critical concentration may affect cell behaviour [9]. BMP-2 also plays a vital role in differentiation of a variety of cell types, including C2C12 and mesenchymal stem cells [10]. Lactate is a metabolite produced by all mammalian cell types and cell proliferation can be co-related to production of lactate. Taking into account the complex geometry of the chip and to reduce the load of computation, a two-dimensional model (Cartesian coordinate system) was used to describe the chip geometry. Similarly, the problem was restricted to a series of 33 compartments instead of 66. Because the chip operation is continuous, a steady state was considered instead of time lapse, and because the cell culture medium is liquid, the flow is assumed to be incompressible.
The momentum and mass transport phenomena occurring inside the chip were described by Navier–Stokes and mass balance equations respectively [11]. In our case, the value of the source term for lactate was calculated to be 6.61 × 10⁻⁸ mol m−2 s, which represents the number of moles of lactate generated by 50 cells per unit time per cross-sectional area at the bottom of the compartment [11]. The source term for BMP-2 was presumed to be 1.66 × 10⁻¹⁶ mol m−2 s and the diffusion coefficient was considered to be 7.2× 10⁻¹¹ mol m−2 s. These coefficients are based on the values that have previously been determined for Decapentaplegic (Dpp), the Drosophila homologue of BMP2 [12]. In order to completely describe this transport phenomenon, conservation of momentum and mass was incorporated using the continuity equation.
The chip geometry was divided into 470 016 two-dimensional nodal points by using a triangular mesh in the computational domain. The transport equations were solved over each nodal point using a finite element method. Incompressible Navier–Stokes and convection diffusion modules available in COMSOL Multiphysics v. 3.5a were used in this study. To satisfy the degrees of freedom of the set of equations, boundary conditions were specified for the inlet, outlet and the walls of the geometry. The value of the horizontal x-directional velocity of the cell culture medium in m/s at the inlet was calculated from the time averaged velocity value corresponding to the given value of the flow rate in m3 s–1.
3. Results and discussion
3.1. Uniform cell seeding
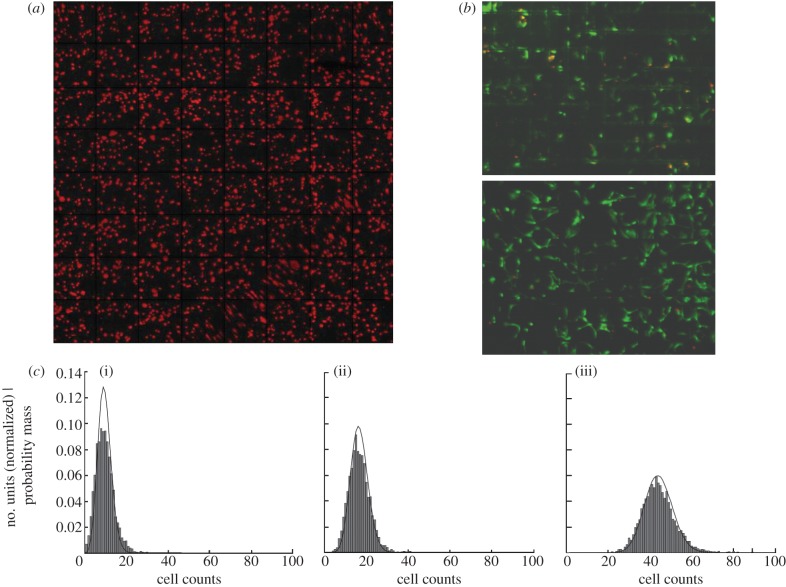
To assess the uniformity of seeding on our chip, three homogeneous cell suspensions of different densities (125 000, 250 000 and 750 000 cells ml-1) were seeded onto chips placed in chip carriers and the lid was closed. The chips incorporate a grid of small units (described in §2), referred to as ‘TestUnits’. Images were acquired 15 min after cell seeding and cells were counted automatically in each of the TestUnits, using CellProfiler software. The uniformity of seeding was calculated using the following equation
| 3.1 |
where U is per cent uniformity, S is standard deviation and M is the mean cell number per TestUnit. Figure 2a presents the results of cell seeding. We observed approximately 84 per cent uniformity in cell distribution across the chip. We did not observe any site-specific effects such as higher density of cells at the periphery of the chip, which is often the case in the seeding of well plates. Similar results have been obtained when the chip carrier was used to culture human mesenchymal stem cells for high-throughput screening of surface topographies [2].
Figure 2.
Cell seeding and perfusion culture. (a) Typical fluorescent image of C2C12 cells 15 min after seeding onto the chip. (b) Live and dead staining of C2C12 cells following perfusion culture for 5 days. (c) Cell distributions on the chip using varying cell densities: (i) 125 000, (ii) 250 000 and (iii) 750 000 cells ml−1. Cell counts represent the number of cells measured with the cell profiler, within a TestUnit. In addition to the experimental data, the lines represent the estimated theoretical optimal distribution, based on the assumption that optimal cell seeding follows the binomial distribution.
Figure 2c presents the distributions of cells per TestUnit, seeded at different densities. Using the 125 000 cells ml–1 suspension more than 80 per cent of the TestUnits were seeded with 8–12 cells per TestUnit. With higher cell counts of 250 000 and 750 000 ml–1, the majority of TestUnits were seeded with 16–24, and 36–52 cells, respectively. These results show that the chip carrier allows homogeneous cell seeding, owing to precise micromachining of the closing lid with a uniform channel depth. Any clumps of cells in the cell suspension should be avoided using a cell strainer.
To further understand the seeding process in our device, we also modelled the expected cell distribution for the three different cell densities used in the experiment. For this, we assumed that in an optimal case, each cell will be independently deposited in one of the TestUnits, i.e. without any bias for certain well or interference from other cells. The chance that a cell docks in a given TestUnit is represented by the equation
| 3.2 |
where P is the chance, and n the number of units, i.e. a Bernoulli variable. The number of cells in a TestUnit can then be modelled as the sum of n Bernoulli variables (one for each of the seeded cells on the chip), where each of the Bernoulli variables has the same chance of success (P). This is also known as a binomial distribution [13], with parameter n and P. As P is fixed (the number of units remains the same), we fitted the binomial distribution by simply setting n equal to the total number of counted cells on a chip. Figure 2 shows that our estimations are in excellent agreement with the experimental results, indicating that indeed well biases and/or cell interactions do not play an interfering role during seeding.
3.2. Cell culture
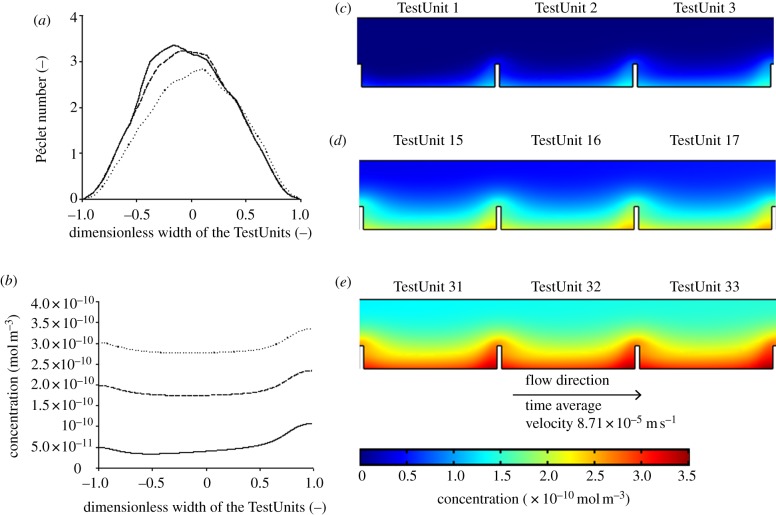
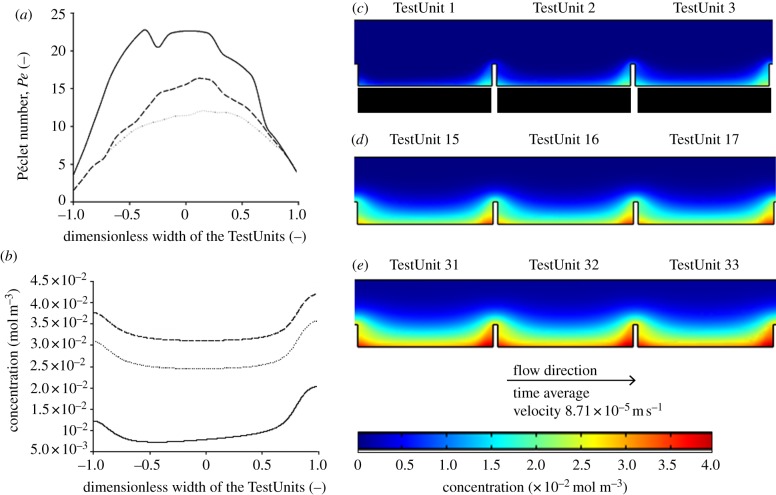
To assess cell viability in our seeding device under dynamic conditions, C2C12 cells were cultured for 5 days and analysed with a live/dead assay. The cells were allowed to attach for 6 h, prior to connecting the device to a peristaltic pump as illustrated in figure 1e. Figure 2b presents our results, showing that more than 95 per cent of the cells are viable. In a successful flow perfusion cell culture system, the exchange of soluble factors and metabolites between the laminar flow and the cells should be adequate. The exchange is sufficient if the rate of convection of soluble proteins and metabolites is equal to or greater than the uptake and metabolism. The Péclet (Pe) number is in fact a measure of the relative contribution of convection with respect to diffusion in the system. When Pe > 1, the exchange of soluble molecules is dominated by convection and efficient exchange of nutrients and metabolites between the culture media and the cells is expected. In cases where Pe < 1, diffusion is dominant and a high probability of accumulation of metabolites and hypoxia may be expected [14]. Figures 3a and 4a show the Péclet number profile developed for BMP-2 and lactate, respectively, in the individual compartments of the chip. For all cases, Pe > 1, suggesting that convection is dominant and that a good exchange of soluble molecules near the chip surface is expected.
Figure 3.
Péclet number profile and concentration profile of BMP-2. The concentration (in mol m−3) profile of BMP2 on the chip was modelled by CFD. (a) Péclet number (Pe) profile across the width of TestUnit 1 (solid line), 16 (dashed line) and 33 (dotted line), at a distance of 10 µm above the bottom of the TestUnits. (b) Concentration profile in mol m−3 across the width of TestUnits 1 (solid line), 16 (dashed line) and 33 (dotted line), at a distance of 10 µm above the bottom of the TestUnits. (c–e) Concentration profiles of representative sections of the chip. (c) TestUnit 1–3, representing initial part of the chip. (d) TestUnit 15–17, representing the middle part of the chip. (e) TestUnits 31–33, representing the last part of the chip.
Figure 4.
Péclet number profile and concentration profile of lactate. The concentration (in mol m−3) profile of lactate on the chip was modelled by CFD. (a) Péclet number (Pe) across the width of the TestUnit 1 (solid line), 16 (dashed line) and 33 (dotted line), at a distance of 10 µm above the bottom of the TestUnits. (b) Concentration profile in mol m–3 across the width of the TestUnit 1 (solid line), 16 (dashed line) and 33 (dotted line), at a distance of 10 µm above the bottom of the TestUnits. (c–e) Concentration profiles of representative sections of the chip. (c) TestUnits 1–3 representing initial part of the chip. (d) TestUnit. 15–17 representing the middle part of the chip. (e) TestUnits 31–33 representing the last part of the chip.
Under the specific flow conditions (100 µl min−1, the same flow rate which was also used in the cell culture experiments), a concentration gradient develops across TestUnits in the direction of the flow, with the bottom section of TestUnit 33 having higher concentrations compared with that of TestUnit 1 for both BMP2 and lactate (figures 3b–e and 4b–e). Nonetheless, the maximum concentration of BMP2 near the walls of TestUnit 33 is expected to be very low and in the order of 10−24 ng ml−1. Having in mind that for most mammalian cell types BMP-2 is known to be active in the concentration range of 20–30 ng ml−1, the accumulation of BMP2 there should not have any biological effect. Similar conclusions can be made about lactate. Its concentration at TestUnit 33 is expected to be 0.04 mol m−3, which is more than three orders of magnitude lower than the minimum concentration reported affect cell proliferation (35 mol m−3) [15]. This indicates that the lactate gradient in the device would also not affect the proliferation activity of cells. All in all these previous estimations suggest that under the tested flow conditions chemical communication between the adjacent TestUnits is unlikely to happen.
Besides the concentrations of BMP2 and lactate, we also estimated the shear stresses on the cells caused by the medium flow. It is known from the literature that shear stresses can influence gene expression profiles of cells [16] and the organization of tissue. Figure 5a presents the velocity profile within our chip. The contour plot of this profile shows that turbulence and recirculation are not present over the major part of the bottom surface of the TestUnits and only mild formation of eddies is expected at the bottom corners. The values of shear stress vary, increasing with flow rate, showing that the shear stress can be very well modulated by changing the flow rate and geometry of TestUnits depending upon the assay requirements. The maximum value of the shear stress developed for a flow rate of 100 µl min−1 is 0.028 Pa and the shear stresses developed for flow rates of 50 and 10 µl min−1 are 0.012 and 0.0001 Pa, respectively. Thus by simply regulating the flow rate, the height of the TestUnits and the height of the closing lid, multiple combinations of mass transport, different shear stress and cell distribution regimes are achievable. This makes our chip carrier attractive for detailed cell studies varying these parameters.
Figure 5.
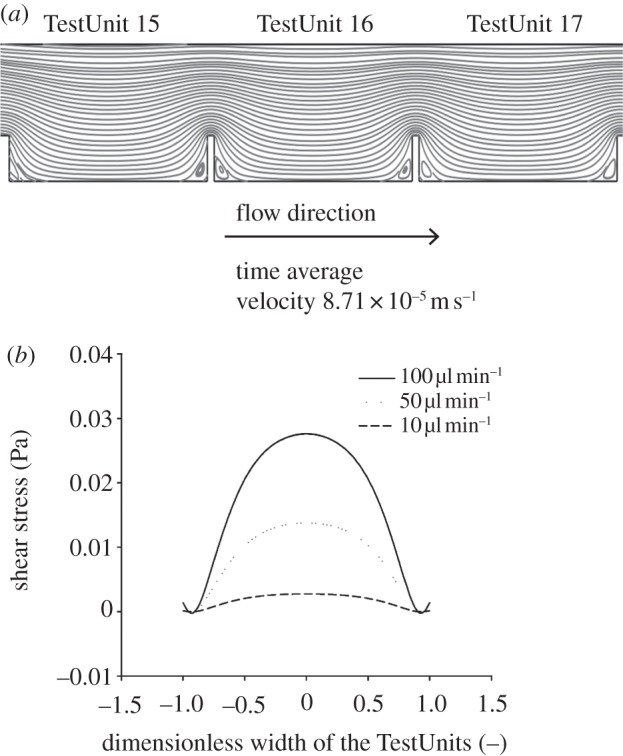
Velocity and shear stress profiles of the chip. (a) Contour plot of the velocity profile developed in the chip for TestUnits 15–17 showing no turbulence, recirculation and eddies formation over the major part of the bottom of the compartments where cells are seeded. (b) Generic shear stress profile developed across the width of the compartments 10 µm above the bottom of the TestUnits for different fluid flow rates.
4. Conclusion
To address the challenges of standardizing high-throughput cell-based chip assays, we have developed a novel chip carrying device. The device provides robust cell culture conditions, uniform cell seeding and cell viability. In addition, CFD simulations suggest that there is good exchange of nutrients and metabolites with the flowing medium (Pe > 1), whereas no cross-talk between adjacent TestUnits is expected. In fact, some local metabolite accumulation at the end of the chip is not expected to have a biological effect and the shear stress to cell can be tailored well via the flow conditions.
The developed Chip carrier is a relatively simple device and can be used for a multitude of applications in biomaterials screening and may be a great help in standardizing cell-based high-throughput experiments in biomaterials science.
In the future, we will perform further experiments concerning the fluid dynamics and transport of molecules in order to evaluate the accuracy of the modelling data ensuring a lack of effect from molecular gradients throughout the chip.
Acknowledgements
We thank Dr Gustavo Higuera Sierra for helpful discussion, Mr Bjorn Harink for assistance with figures, Mr Sip Jan Boorsma and Mr Dominic Post for technical help with the fabrication. H.V.U. received financial support from Marie Curie JOIN(ed)T early stage research fellowship.
References
- 1.Amis EJ. 2004. Combinatorial materials science: reaching beyond discovery. Nat. Mater. 3, 83–85 10.1038/nmat1064 (doi:10.1038/nmat1064) [DOI] [PubMed] [Google Scholar]
- 2.Unadkat HV, et al. 2011. An algorithm-based topographical biomaterials library to instruct cell fate. Proc. Natl Acad. Sci. USA 108, 16 565–16 570 10.1073/pnas.1109861108 (doi:10.1073/pnas.1109861108) [DOI] [PMC free article] [PubMed] [Google Scholar]
- 3.Anderson DG, Levenberg S, Langer R. 2004. Nanoliter-scale synthesis of arrayed biomaterials and application to human embryonic stem cells. Nat. Biotech. 22, 863–866 10.1038/nbt981 (doi:10.1038/nbt981) [DOI] [PubMed] [Google Scholar]
- 4.Reynolds CH. 1999. Designing diverse and focused combinatorial libraries of synthetic polymers. J. Comb. Chem. 1, 297–306 10.1021/cc9900044 (doi:10.1021/cc9900044) [DOI] [Google Scholar]
- 5.Smith JR, Kholodovych V, Knight D, Kohn J, Welsh WJ. 2005. Predicting fibrinogen adsorption to polymeric surfaces in silico: a combined method approach. Polymer 46, 4296–4306 10.1016/j.polymer.2005.03.012 (doi:10.1016/j.polymer.2005.03.012) [DOI] [Google Scholar]
- 6.Flaim CJ, Teng D, Chien S, Bhatia SN. 2008. Combinatorial signaling microenvironments for studying stem cell fate. Stem Cells Dev. 17, 29–40 10.1089/scd.2007.0085 (doi:10.1089/scd.2007.0085) [DOI] [PubMed] [Google Scholar]
- 7.Mei Y, et al. 2010. Combinatorial development of biomaterials for clonal growth of human pluripotent stem cells. Nat. Mater. 9, 768–778 10.1038/nmat2812 (doi:10.1038/nmat2812) [DOI] [PMC free article] [PubMed] [Google Scholar]
- 8.Meredith JC. 2009. Advances in combinatorial and high-throughput screening of biofunctional polymers for gene delivery, tissue engineering and anti-fouling coatings. J. Mater. Chem. 19, 34–45 10.1039/b808649d (doi:10.1039/b808649d) [DOI] [Google Scholar]
- 9.Zilberberg L, ten Dijke P, Sakai L, Rifkin D. 2007. A rapid and sensitive bioassay to measure bone morphogenetic protein activity. BMC Cell Biol. 8, 41. 10.1186/1471-2121-8-41 (doi:10.1186/1471-2121-8-41) [DOI] [PMC free article] [PubMed] [Google Scholar]
- 10.Roelen BAJ, Dijke P. 2003. Controlling mesenchymal stem cell differentiation by TGF? Family members. J. Orthop. Sci. 8, 740–748 10.1007/s00776-003-0702-2 (doi:10.1007/s00776-003-0702-2) [DOI] [PubMed] [Google Scholar]
- 11.Higuera G, Schop D, Janssen F, van Dijkhuizen-Radersma R, van Boxtel T, van Blitterswijk CA. 2009. Quantifying in vitro growth and metabolism kinetics of human mesenchymal stem cells using a mathematical model. Tissue Eng. Part A 15, 2653–2663 10.1089/ten.tea.2008.0328 (doi:10.1089/ten.tea.2008.0328) [DOI] [PubMed] [Google Scholar]
- 12.Umulis DM, Serpe M, O'Connor MB, Othmer HG. 2006. Robust, bistable patterning of the dorsal surface of the Drosophila embryo. Proc. Natl Acad. Sci. USA 103, 11 613–11 618 10.1073/pnas.0510398103 (doi:10.1073/pnas.0510398103) [DOI] [PMC free article] [PubMed] [Google Scholar]
- 13.Box GEP, Hunter WG, Hunter JS. 1978. Statistics for experimenters: an introduction to design, data analysis, and model building. New York, NY: John Wiley & Sons [Google Scholar]
- 14.Figallo E, Cannizzaro C, Gerecht S, Burdick JA, Langer R, Elvassore N, Vunjak-Novakovic G. 2007. Micro-bioreactor array for controlling cellular microenvironments. Lab Chip 7, 710–719 10.1039/b700063d (doi:10.1039/b700063d) [DOI] [PubMed] [Google Scholar]
- 15.Schop D, Janssen FW, van Rijn LDS, Fernandes H, Bloem RM, de Bruijn JD, van Dijkhuizen-Radersma R. 2009. Growth, metabolism, and growth inhibitors of mesenchymal stem cells. Tissue Eng. A 15, 1877–1886 10.1089/ten.tea.2008.0345 (doi:10.1089/ten.tea.2008.0345) [DOI] [PubMed] [Google Scholar]
- 16.Glossop JR, Cartmell SH. 2009. Effect of fluid flow-induced shear stress on human mesenchymal stem cells: differential gene expression of IL1B and MAP3K8 in MAPK signaling. Gene Expr. Patterns 9, 381–388 10.1016/j.gep.2009.01.001 (doi:10.1016/j.gep.2009.01.001) [DOI] [PubMed] [Google Scholar]


