Abstract
Objective
The present studies aimed at elucidating the role of prostaglandin E2 (PGE2) receptor subtype 3 (EP3) in regulating blood pressure.
Methods and Results
Mice bearing a genetic disruption of the EP3 gene (EP3−/−) exhibited reduced baseline mean arterial pressure monitored by both tail-cuff and carotid arterial catheterization. The pressor responses induced by EP3 agonists M&B28767 and sulprostone were markedly attenuated in EP3−/− mice, while the reduction of BP induced by PGE2 was comparable in both genotypes. Vasopressor effect of acute or chronic infusion of angiotensin II (AngII) was attenuated in EP3−/− mice. AngII–induced vasoconstriction in mesenteric arteries decreased in EP3−/− group. In mesenteric arteries from wild type mice, AngII–induced vasoconstriction was inhibited by EP3 selective antagonist DG-041 or L798106. The expression of Arhgef-1 is attenuated in EP3 deficient mesenteric arteries. EP3 antagonist DG-041 diminished AngII-induced phosphorylation of MLC20 and MYPT1 in isolated mesenteric arteries. Furthermore, in vascular smooth muscle cells (VSMCs), AngII induced intracellular Ca2+ increase was potentiated by EP3 agonist sulprostone, while inhibited by DG-041.
Conclusions
Activation of the EP3 receptor raises baseline blood pressure and contributes to AngII-dependent hypertension at least partially via enhancing Ca2+ sensitivity and intracellular calcium concentration in VSMCs. Selective targeting of the EP3 receptor may represent a potential therapeutic target for the treatment of hypertension.
Keywords: EP3, angiotensin II, hypertension, vasoconstriction, calcium
Hypertension is a major cardiovascular risk factor and a prominent worldwide health challenge. Prostaglandins are endogenous oxygenated fatty acid metabolites and play important roles in modulating arterial blood pressure and renal salt excretion1-3. Prostaglandin E2 (PGE2) is a major prostanoid synthesized in mouse kidney and vasculature4 and is unique among the prostanoids in that it can activate four distinct G protein–coupled membrane receptors—designated E-prostanoid receptor 1 (EP1), EP2, EP3, and EP4. EP receptors exhibit characteristic tissue distribution1 , 5 and evoke receptor-specific signaling pathways6. The EP1 and EP3 receptors were initially defined involved in vasoconstriction, while the EP2 and EP4 receptors participate in the relaxation of vascular smooth muscle7-9.
At the cellular level, EP1 receptor activation leads to increased intracellular Ca2+10, 11, while EP3 receptor signals through a number of pathways including activation of the inhibitory G protein (Gi), leading to a decrease in intracellular cAMP concentration, as well as an increase in intracellular calcium12-16. Moreover, EP3 receptor could activate G13 protein leading to the activation of the small GTPase Rho17. The EP2 and EP4 receptors couple to the stimulatory G protein (Gs) leading to receptor-evoked increase of intracellular cAMP concentration7-9. The multiple functionally antagonistic signaling pathways evoked by PGE2 suggest that the four EP receptors may act in concert to maintain blood pressure homeostasis.
An important role for EP1 receptors in modulating angiotensin II (AngII) effects on systemic blood pressure was revealed in our previous study which showed that EP1 null mice exhibited reduced blood pressure and a blunted vasopressor response to acute and chronic infusion of AngII18. Disruption of the EP2 receptor unmasked the pressor response to PGE219 and was susceptible to salt-sensitive hypertension19. In addition, our previous study demonstrated EP2 receptor played an important role in neointimal hyperplasia after arterial injury20. PGE2 may also induce vascular relaxation by EP4 receptor-mediated activation of endothelial nitric oxide synthase (eNOS)21, consistent with the observed vasodepressor effect of the EP4 agonist PGE1-OH in wild type mice22. However, the role of EP3 receptor in regulating vascular tone and blood pressure is only partially characterized. In the present studies, we utilized a mouse with targeted disruption of the EP3 gene to determine the role of the EP3 receptor in systemic hemodynamics and to examine the response to AngII-induced hypertension. We found that EP3 gene disruption resulted in reduced basal blood pressure and attenuated AngII-evoked hypertension.
Methods
Experimental Animals and Reagents
EP3+/+ and EP3−/− mice were kindly gifted by Dr. Richard M. Breyer. Male EP3−/− mice and sex- and age-matched EP3+/+ littermates (12-16 weeks) on a pure C57BL/6 background were used in all studies. The detailed methods for genotyping those mice were shown in supplemental data (Fig. S1). The study protocols and the use of the animals were reviewed and approved by the Animal Care and Use Review Committee of Peking University Health Science Center. The study conformed to the Guide for the Care and Use of Laboratory Animals published by the US National Institutes of Health (NIH publication no. 85-23, revised 1996). All chemicals and regents used were listed in the Supplemental data.
Blood pressure Measurement
Male congenic C57BL/6 mice aged 12-16 weeks and with 20-25g body weight were used. Following a 2-week training period, basal blood pressure was measured in conscious EP3+/+ and EP3−/− mice using the tail-cuff method as previously reported22. These mice were then used in chronic AngII-infusion experiments. For acute infusion studies, mice were anesthetized with 80mg/kg ketamine and 8mg/kg inactin i.p. and placed on a temperature-controlled pad. After tracheostomy, PE-10 tubing was inserted into the right carotid artery, and blood pressure was measured with a Cobe CDX II transducer connected to a blood pressure analyzer (BPA 400; Micromed, Louisville, KY) as previously reported22. A jugular vein catheter was placed for infusion of test agents. Blood pressure was recorded for 30 to 60 minutes until stable values were obtained, and then 100μl of test agents (sulprostone, M&B28767, PGE2, phenylephrine or sodium nitroprusside) dissolved in saline were injected as a bolus via the jugular vein. For AngII studies, AngII dissolved in normal saline was continuously infused via the jugular vein at a rate of 75pmol/kg/min for 30 minutes. Blood pressure and heart rates were recorded continuously on a thermal printer or as a computerized data record.
AngII–dependent Chronic Hypertension
Chronic AngII–dependent hypertension was induced in EP3+/+ and EP3−/− mice as previously described23. Briefly, AngII (1,000ng/kg/min) dissolved in sterile saline was infused using an osmotic minipump (Alzet model 2004; Alza Corp.) inserted subcutaneously during chloral hydrate anesthesia (10%). After 3 days of full recovery from the surgery, systolic blood pressure and heart rates were recorded every other day for 28 days via computerized tail-cuff method as previously reported22. Mice were placed in individual mouse metabolic cages (Tecniplast, Buguggiate, Italy) with free access to water and food, at Day 0, 14, 28, urine output and drinking volume was collected and calculated.
Mesenteric Arterial Vascular Tension
Mesenteric arteries were dissected from male EP3+/+ and EP3−/− mice after anesthetized with chloral hydrate (10%) i.p. and cut into rings of 1.0-1.3 mm long in ice-cold modified Krebs-Ringer bicarbonate buffer. Each segment was suspended between two tungsten wires in chambers of a Multi Myograph System (610M, Danish Myo Technology A/S, Aarhus N, Denmark) for the measurement of isometric force. Each organ chamber was filled with 5ml of the modified Krebs-Ringer bicarbonate solution maintained at 37±0.5°C and aerated with 95% O2-5% CO2 (pH = 7.4). At the beginning of the experiment, each vessel ring was stretched to its optimal resting tension of 1mN for 30 minutes by step-wise stretching and contracted with 60mM KCl to test its contractility. Vessels were brought to their optimal resting tension, equilibrated for 30 minutes and a dose-response to AngII in vessels was determined. To eliminate the possible involvement of endothelium-derived NO, nitro-L-arginine (100μmol/L) was included in the medium and present throughout the experiments.
Ca2+ Imaging in Cultured Vascular Smooth Muscle Cells (VSMCs)
Vascular smooth muscle cells were loaded with the Ca2+ indicator fluo-4 acetoxymethyl ester (2.5μmol/L, Molecular Probes) in Tyrode’s solution for 5 minutes in the dark at 37°C. After washed to remove excess indicator, cells were imaged in Tyrode’s solution at 23°C using a Zeiss LSM5 Live inverted confocal microscope (Carl Zeiss, Germany) equipped with a 40x oil immersion objective, at 90 frames/min, with the excitation laser at 488 nm and >505 nm emission.
Myosin Light Chain 20 (MLC20) and Myosin Phosphatase Target Subunit 1 (MYPT1) Phosphorylation
Mesenteric arteries were dissected from male mice and rats after anesthetized with chloral hydrate (10%) i.p. and cut into rings in ice-cold modified Krebs-Ringer bicarbonate buffer. Vessel rings were incubated for 30 minutes in the presence of solvent or DG041 (1μmol/L) after equilibrated in serum-free Dulbecco’s modified Eagle’s medium for 30 minutes at 37°C. Nitro-L-arginine (100μmol/L) was included in the medium. Then vessel rings were rapidly taken out and snappy frozen with liquid nitrogen immediately after stimulated by AngII (1μmol/L) for 5 minutes. Tissue lysates prepared from the frozen vessels, each containing 20μg of protein, were subjected to SDS–PAGE and then transferred to PVDF. Non-specific binding of antibody was blocked by washing with TBS buffer containing 10% milk for 1h. The blot was then incubated with the first antibody of phospho-MLC20 (1:1000 dilution), MLC20 (1:1000 dilution), MYPT1 (1:1000 dilution), phospho-MYPT1 (Thr696) (1:500 dilution), RhoGEF p115/Lsc (also known as Arhgef-1) (1:500 dilution) respectively over night and the secondary antibody for 1 h. It was developed using the chemiluminescent detection method (Pierce). The protein present on blots was quantified by densitometry using Image J (NIH) and normalized to β-actin (1:4000).
Statistical Analysis
Prism (GraphPad, Software Inc. La Jolla, CA) was used for statistical analysis except in the case of chronic AngII infusion (see below). The results were expressed as means ± SE. Data were evaluated by 2-sided Student’s t test. A P < 0.05 was required to reject the null hypothesis. The effect of chronic AngII treatment on EP3+/+ and EP3−/− animals was assessed by comparing the change in systolic blood pressure (SBP) from baseline out to 28 days using General Linear Models (GLM) with bootstrap covariance accounting for correlation among repeated measures within each mouse, in which the baseline SBP was adjusted as a covariate. Residuals were assessed graphically for normality. These analyses were performed with R-software version 2.9.1 (www.r-project.org) and a two sided P < 0.05 was required to reject the null hypothesis.
Results
Disruption of the EP3 receptor gene decreases basal blood pressure
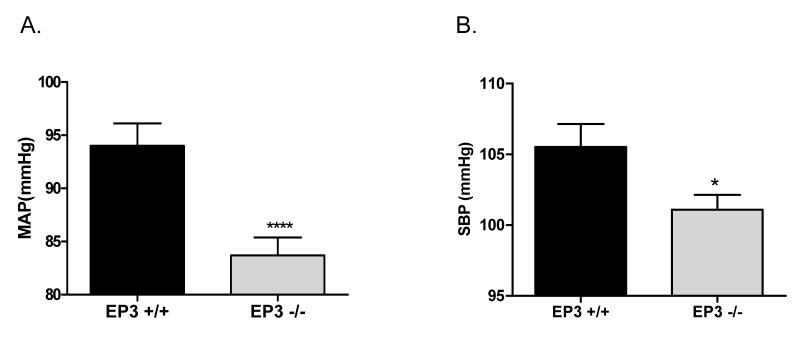
Mean arterial pressure (MAP) was measured in anesthetized EP3+/+ and EP3−/− mice. As shown in Fig. 1A, baseline MAP was significantly decreased in EP3−/− mice (EP3−/− 83.7±1.7 mmHg versus EP3+/+ mice 94.0±2.1 mmHg). Consistent result was observed in conscious state that EP3−/− mice showed reduced systolic blood pressure (SBP) (101.1±1.1 mmHg) than EP3+/+ mice (105.5±1.6 mmHg) (Fig. 1B).
Figure 1. Baseline blood pressure levels in EP3+/+ and EP3−/− mice.
A) Mean arterial blood pressure (MAP) levels in anesthetized EP3+/+ (n=25) and EP3−/− mice (n=28). MAP was measured using the carotid arterial catheterization method. ****P<0.0005 vs. EP3+/+. B) Systolic blood pressure monitored by tail cuff in EP3+/+ (n=24) and EP3−/− mice (n=23). * P< 0.05 vs. EP3 +/+.
Deletion of the EP3 receptor blunts the pressor response to AngII
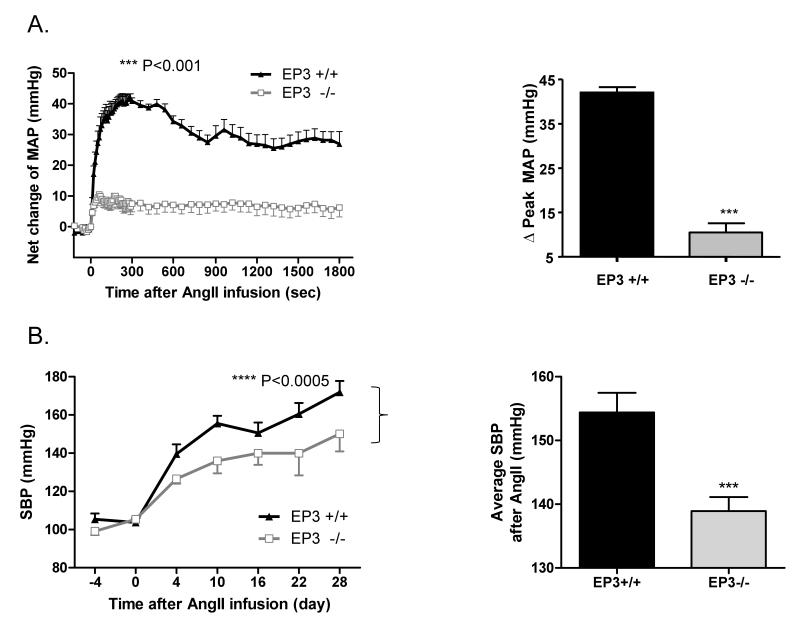
Acute infusion of the pressor AngII increased MAP in EP3+/+ mice which was attenuated in EP3−/− mice. Peak increase in MAP was 90.4±3.0 mmHg in EP3−/− mice versus 131.3±3.9 mmHg in EP3+/+ mice (data not shown). The net change of MAP in EP3−/− mice upon AngII infusion was also markedly reduced in EP3−/− mice (10.5±2.0 mmHg) versus EP3+/+ mice (42.1±1.2 mmHg) (Fig. 2A).
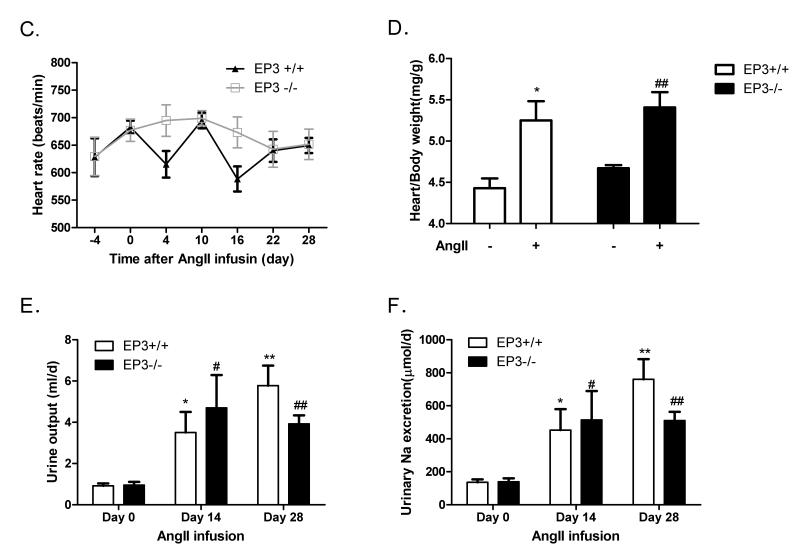
Figure 2. Effect of EP3 gene disruption on pressor response to AngII.
A) Reduced pressor effects of AngII in EP3−/− mice (n=10) vs. EP3+/+ mice (n=6). Mean arterial pressure (MAP) was monitored by intracarotid catheterization before and during i.v. infusion of AngII (75pmol/kg/min). The right panels are the summaries of increase in Δpeak MAP (180~280s) during drug infusion. ***P<0.001 vs. EP3+/+. B) Effect of chronic infusion of AngII (1,000ng/kg/min via osmotic pumps) on systolic blood pressure recorded by tail cuff (n=6 per group). AngII infusion resulted in significant increase in blood pressure in both EP3+/+ and EP3−/− mice, with more profound increase in EP3+/+ mice than in EP3−/− mice, ****P < 0.0005 vs. EP3+/+. The right panels are the average changes in systolic blood pressure during AngII chronic infusion in EP3+/+ and EP3−/− mice. ***P < 0.001 vs. EP3+/+. C) Effect of chronic infusion of AngII on heart rate. There was no difference between EP3+/+ and EP3−/− mice in heart rate before or after AngII infusion. D) Effect of chronic infusion of AngII on heart weight. Cardiac hypertrophy, assessed by heart weight/body weight, between EP3+/+ and EP3−/− was similar after chronic AngII infusion. *P<0.05, EP3+/+ Control vs. EP3+/+ AngII group; ##P<0.01, EP3−/− Control vs. EP3−/− AngII group, n=5. E) Average changes in 24h urine output in EP3+/+ and EP3−/− mice at the day 0, day 14 and day 28 during chronic AngII infusion. AngII infusion caused similar diuretic effect in both genotypes. Urine output was slightly lower in EP3−/− mice than in EP3+/+ mice, but the difference was not significant. *P < 0.05, **P < 0.01 vs. the baseline levels (day 0) in EP3+/+ group, n=6; #P < 0.05, ##P < 0.01 vs. the baseline levels (day 0) in EP3−/− group, n=6. F) 24h urinary sodium excretion in EP3+/+ and EP3−/− mice during chronic AngII infusion. Similar natriuretic effect was observed in both EP3+/+ and EP3−/− mice after AngII infusion. Urinary sodium excretion was slightly lower in EP3−/− mice than in EP3+/+ mice, but the difference was not significant. *P < 0.05, **P < 0.01 vs. the baseline levels (day 0) in EP3+/+ group, n=6; #P < 0.05, ##P < 0.01 vs. the baseline levels (day 0) in EP3−/− group, n=6.
A similar effect was observed upon chronic AngII infusion in EP3−/− mice. As shown in Fig. 2B, chronic AngII infusion increased systolic blood pressure in both genotypes. While compared to EP3+/+ mice, the EP3−/− mice had lower SBP without change in heart rate (Fig. 2C) over time after treatment. Cardiac hypertrophy, as assessed by the heart to body weight ratio, was similar between EP3+/+ and EP3−/− mice (Fig. 2D). Over the 28-day AngII infusion, average systolic blood pressure increased to 154.4±3.1 mmHg in the EP3+/+ group, but only to 138.9±2.2 mmHg in the EP3−/− group (Fig. 2B). The net increase was approximately 14 mmHg lower in EP3−/− mice (38.6±2.2 mmHg) compared with EP3+/+ (52.3±3.1 mmHg) mice (data not shown). During the infusion of AngII, the increase in SBP was associated with increased urine output and urinary Na+ excretion, but no difference was observed between the EP3+/+ and EP3−/− groups (Fig. 2E& 2F).
EP3−/− mice display a loss of vascular reactivity to EP3 agonists
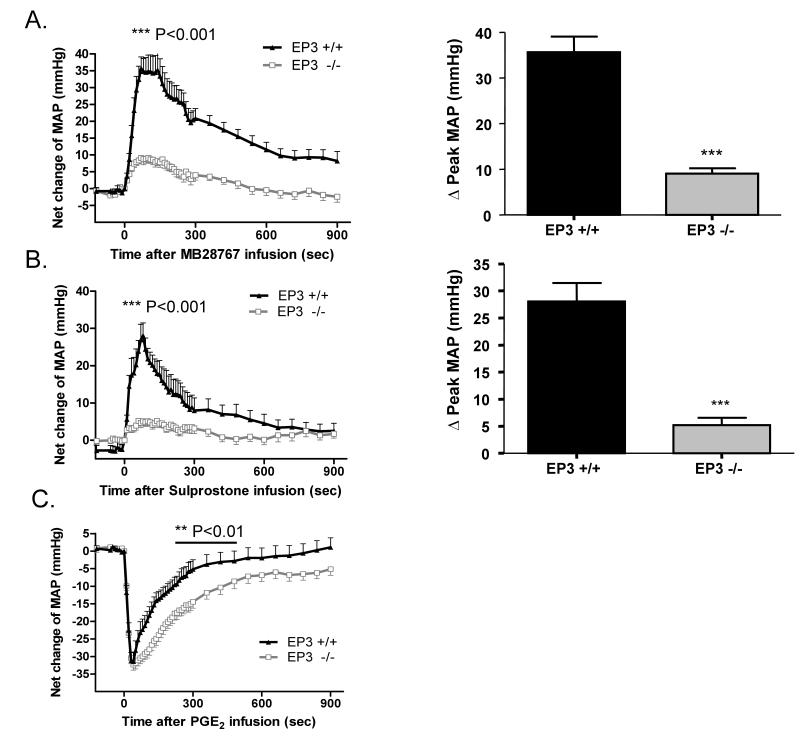
The effect of the EP3 gene disruption on vascular reactivity was assessed by infusion of the EP3 receptor–selective agonist M&B28767. The pressor response to M&B28767 was markedly reduced in EP3−/− mice, increasing MAP by 9.1±1.2 mmHg versus 35.7±3.4 mmHg in EP3+/+ littermates (Fig. 3A). Similarly, infusion of the dual EP1/3 agonist sulprostone exhibited clear pressor activity in EP3+/+ mice (28.1±3.4 mmHg), which was significantly diminished in EP3−/− mice (5.2±1.4 mmHg) (Fig 3B). Infusion of the endogenous ligand, PGE2, resulted in an expected depressor effect, which was not different in magnitude between the EP3−/− and EP3+/+ groups; however, the EP3−/− mice appeared to have a more prolonged reduction in MAP as compared to EP3+/+ mice (Fig. 3C).
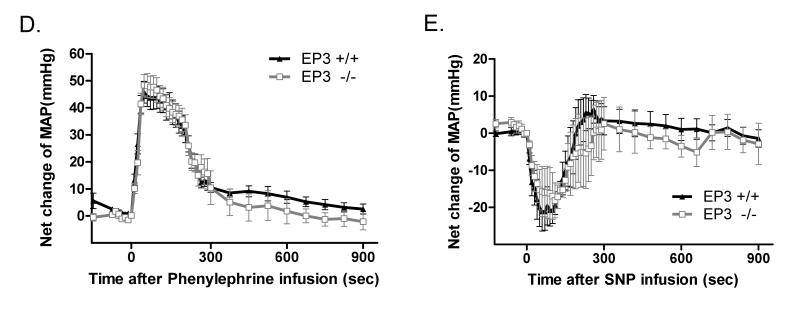
Figure 3. Effect of intravenous infusion of EP receptor agonists and other vasoactive agents on mean arterial pressure (MAP) in EP3+/+ and EP3−/− mice.
A) The net increase of MAP upon M&B28767 infusion was significantly reduced in EP3−/− mice. The right panels are the summaries of increase in ΔPeak MAP (70s) during drug infusion. n=9 per group ***P<0.001. B) The net increase of MAP following sulprostone infusion was markedly reduced in EP3−/− mice. The right panels are the summaries of increase in ΔPeak MAP (60~80s) during drug infusion. n=6 for EP3+/+ group, n= 10 for EP3−/− group, ***P < 0.001. C) Similar vasodepressor response to PGE2 (100 mg/kg) in EP3−/− mice (n=15) versus EP3+/+ mice (n=15). Net changes of blood pressure were similar in EP3+/+ and EP3−/− mice. PGE2 administration resulted in indistinguishable fall in MAP in EP3+/+ and EP3−/− mice, however, EP3−/− mice appeared to exhibit prolonged depression of MAP compared to EP3+/+ mice. D) Time course showing pressor effect of phenylephrine in EP3+/+ and EP3−/− mice. Phenylephrine administration resulted in a marked increase in blood pressure in both genotypes, with an indistinguishable peak pressor response in EP3−/− (n=9) and EP3+/+ mice (n=10). E) Time course of the effect of SNP on MAP in EP3+/+ and EP3−/− mice. No difference was observed in net peak reduction of MAP between EP3+/+ (n=4) and EP3−/− (n=3) mice.
EP3−/− mice exhibit intact hemodynamic responsiveness to other vasoactive agonists
The specificity of the alterations in vascular reactivity was assessed by administration of the α-adrenergic receptor agonist phenylephrine (PhE). The peak pressor response to PhE was not significantly different in the EP3−/− as compared to the EP3+/+ mice (Fig. 3D). Similarly, the vasodilator sodium nitroprusside (SNP) exhibited clear depressor activity in both EP3+/+ and EP3−/− mice with no significant difference between the two genotypes (Fig. 3E).
EP3−/− mice mesenteric arteries exhibit reduced AngII responsiveness
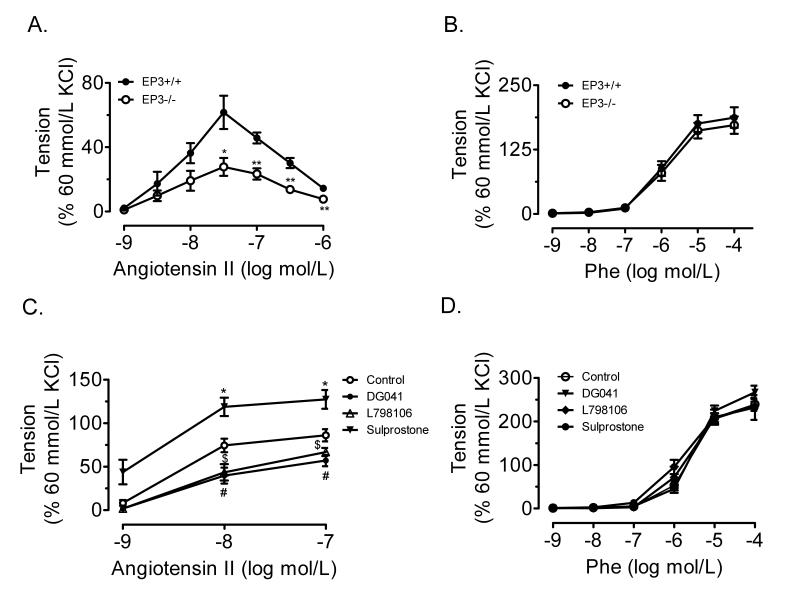
RT-PCR analysis revealed that each of the three splice variants of mouse EP3 were constitutively expressed in mesenteric arteries and kidney of EP3+/+ mice (Fig. S1B), while none of the splice variants was detected in the EP3−/− kidney (Fig. S1C) and mesenteric arteries (data not shown). AngII-induced contraction was reduced in the mesenteric arteries from EP3−/− mice than that from EP3+/+ mice (Fig. 4A). However, no difference in phenylephrine-evoked vasoconstriction was observed between EP3+/+ and EP3−/− mice (Fig. 4B). In addition, the EP3 selective antagonist DG-041 (1μmol/L) and L798106 (1μmol/L) attenuated, while its agonist sulprostone (1μmol/L) enhanced the AngII-induced contraction in mesenteric arteries from wild type mice (Fig. 4C). Neither the EP3 agonist nor antagonist had effect on phenylephrine-evoked vasoconstriction (Fig. 4D).
Figure 4. Effect of EP3 disruption on AngII evoked vasoconstriction in mouse mesenteric arteries.
A) AngII-evoked vasoconstriction in EP3−/− mesenteric arterial rings ex vivo (n=7) was attenuated as compared to EP3+/+ (n=4). *P<0.05, **P<0.01 vs. EP3+/+ group. B) No difference in phenylephrine-evoked vasoconstriction between EP3+/+ and EP3−/− mesenteric arterial rings (n=11). C) EP3 antagonist DG041 and L798106 dose-dependently inhibited, while EP3 agonist sulprostone facilitated, AngII-evoked vasoconstriction in EP3+/+ mesenteric arterial rings ex vivo.*P<0.05, sulprostone vs. Control group; #P<0.05, DG041 vs. Control group; $P<0.05, L798106 vs. Control group, n=5. D) EP3 agonist or antagonist failed to affect phenylephrine-evoked vasoconstriction in EP3+/+ mesenteric arterial rings ex vivo (n=8).
Role of EP3 in AngII-elicited phosphorylation of MLC20 in resistant vessels
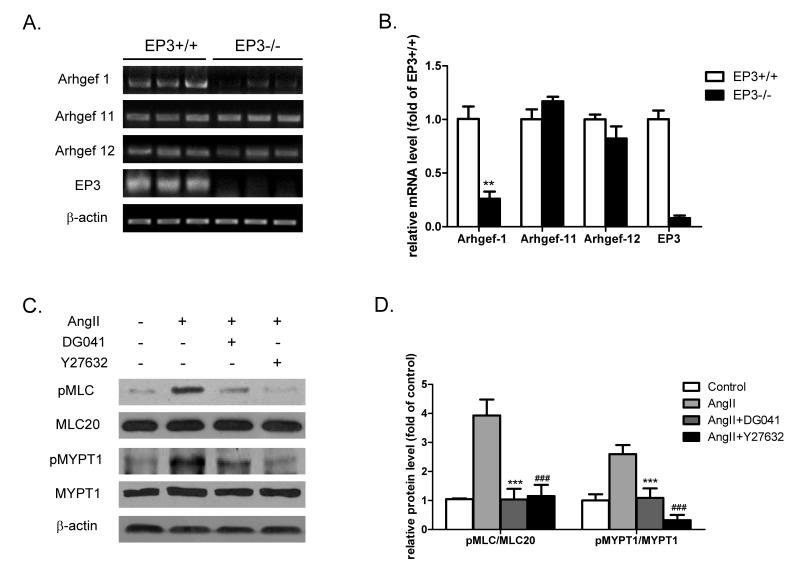
In addition to the Ca2+-dependent activation of myosin light chain kinase (MLCK), AngII-induced contractility of VSMCs is attenuated by MLC phosphatase (MLCP)24. After binding to its G12/13-coupled receptor (AT1R), AngII activates RhoA/RhoA kinase signaling pathway via guanine nucleotide exchange factors (RhoGEFs) and causes an inhibitory phosphorylation of MYPT1, the regulatory subunit of MLCP heterotrimer, leading to vascular contraction. To determine the role of EP3 in AngII-elicited vasoconstriction, we tested the effect of EP3 inactivation or blockage on the expression of RhoGEFs and the level of phosphorylated MYPT1. Among three VSMC-specific RhoGEFs, Arhgef-1 mRNA, but not Arhgef-11 and Arhgef-12, was significantly reduced in the mesenteric arteries from EP3−/− mice (Fig. 5A&B). In line with the decreased mRNA level, Arhgef-1 protein expression was also reduced in EP3 deficient mesenteric arteries (Fig. S2A). The specificity of the Arhgef-1 antibody was validated in siRNA-transfected VSMCs (Fig. S3). We noticed that AngII stimulation significantly increased the phosphorylation of both MLC20 and MYPT1 in EP3+/+ arteries, while little change was observed in EP3−/− arteries (Fig. S2B). The AngII-evoked phosphorylation of MLC20 and MYPT1 was similarly markedly inhibited by EP3 antagonist DG041 in rat mesenteric arteries (Fig. 5C&D). In addition, similar results were obtained using porcine coronary arteries, another type of resistant vessel rings (Fig. S4).
Figure 5. Role of the EP3 receptor in the expression of Rho-GEFs and AngII-induced phosphorylation of MLC20 and MYPT1.
A) RT-PCR analysis of the expression of Arhgef-1, Arhgef-11, and Arhgef-12 in mesenteric arteries of EP3+/+ and EP3−/− mice (n=3 in each group). B) Quantitative RT-PCR analysis of gene expression of Rho-GEFs in mesenteric arteries of EP3+/+ and EP3−/− mice. The levels of Arhgef-1, but not Arhgef-11 and Arhgef-12, were significantly reduced in EP3−/− mice. **P<0.01, EP3−/− vs. EP3+/+ group, n=3. C) Inhibitory effect of the EP3 antagonist DG041 on AngII-induced phosphorylation of MLC20 and MYPT1 in EP3+/+ mesenteric arteries. The rings of mesenteric arteries were stimulated by AngII (1μmol/L) for 5 minutes after preincubated with the EP3 antagonist DG041 (10μmol/L) or a ROCK inhibitor Y27632 (20μmol/L) for 30 minutes. Both DG041 and Y27632 attenuated AngII-induced phosphorylation of MYPT1 and MLC20. D) Quantitative analysis of the levels of phospho-MLC20 and phospho-MYPT1. *P<0.05, ***P<0.001, AngII+DG041 vs. AngII alone; ###P<0.001, AngII+Y27632 vs. AngII alone. n=3 in each group.
Role of the EP3 in AngII-elicited increase in intracellular Ca2+ levels in VSMCs
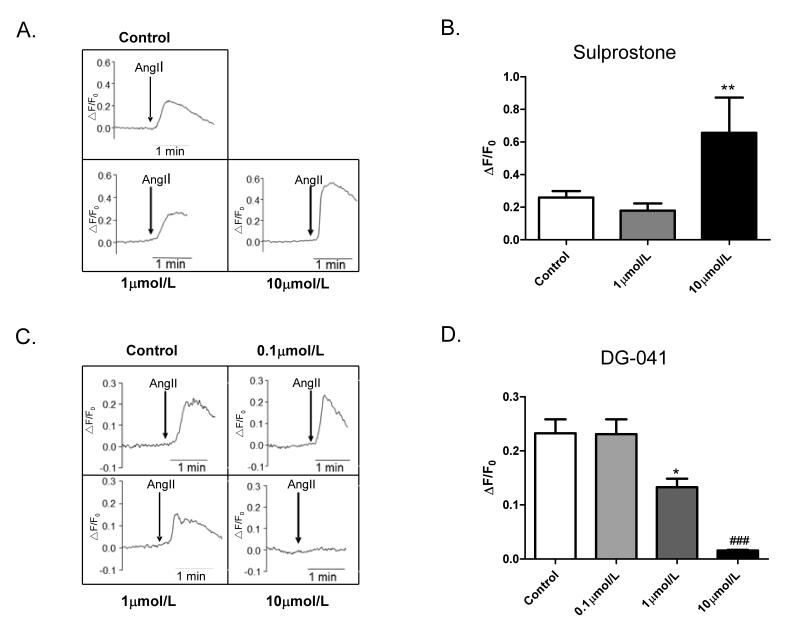
Upon the binding to its Gq-coupled receptor (AT1), AngII stimulates phospholipase C (PLC) activity and increases intracellular Ca2+ levels via IP3 and protein kinase C (PKC)-dependent mechanisms24. Ca2+ binds to calmodulin and the Ca2+/calmodulin complex then activates MLCK to phosphorylate the MLC. To determine the effect of EP3 on AngII-induced increase in intracellular Ca2+ levels, we examined the effect of sulprostone or DG-041 on AngII-induced Ca2+ increase. Incubation of VSMCs with sulprostone (10μmol/L) for 30 minutes potentiated the AngII-induced increase in intracellular Ca2+ levels (Fig. 6A&B). Compared to AngII, sulprostone at high dose (10μmol/L) alone only slightly increased Ca2+ levels (Fig. S5A). In contrast, the EP3 antagonist DG041 pretreatment for 30 minutes concentration-dependently inhibited AngII-evoked Ca2+ signal (Fig. 6C&D), with little effect on calcium levels in phenylephrine-treated cells (Fig. S5B).
Figure 6. Effect of EP3 agonist or antagonist on AngII-elicited increase in intracellular Ca2+ in VSMCs.
A) Potentiation of AngII-induced intracellular Ca2+ increase in VSMCs by sulprostone. VSMCs were pre-incubated with the EP3 agonist sulprostone for 30 minutes, at the doses of 1μmol/L and 10μmol/L, respectively. B) Ratio of peak-to-basal change (ΔF/F0) in Fluo-4AM fluorescence intensity in VSMCs treated with sulprostone and AngII (1 μmol/L), **P<0.01 vs. Control group, n=7 in each group. C) Dose-dependent inhibitory effect of DG-041 on intracellular Ca2+ flux induced by AngII. VSMCs were pretreated with the EP3 antagonist DG-041 for 30 minutes at the doses of 0μmol/L, 0.1μmol/L, 1μmol/L and 10μmol/L, respectively. D) Ratio of peak-to-basal change (ΔF/F0) in Fluo-4AM fluorescence intensity in VSMCs treated with DG-041 and AngII (1μmol/L), *P <0.05; ###P <0.001 vs. Control group, n=7 per group.
Discussion
PGE2 has been demonstrated to act as either a pressor or depressor depending upon the EP receptor activated19, 25-32. The balance of pressor and depressor receptors activated by PGE2 plays an important role in the overall regulation of blood pressure and a functional imbalance of EP receptors may be an important mechanism in the development of essential hypertension. The current study demonstrated that targeted gene disruption of the EP3 receptor resulted in lower blood pressure at baseline, in agreement with our earlier findings that EP3 was an important contributor to the pressor response to PGE222. Our studies also found that the EP3 receptor sensitized the resistant vessels/VSMCs to the actions of AngII, suggesting that the EP3 receptor may contribute to increased blood pressure in AngII-dependent hypertension.
The fall in baseline blood pressure in the EP3−/− mice suggested that EP3 receptor activation played a tonic role in blood pressure homeostasis. This was further supported by the findings that acute infusion of the EP3 agonists resulted in a less increase in blood pressure in EP3−/− mice. However, upon infusion of PGE2, an endogenous ligand for all four EP receptors, no difference in the magnitude of the depressor response was observed in EP3−/− mice, suggesting that the vasodepressor response to PGE2, which is predominantly mediated by the activation of the Gs-coupled EP2 and EP4, is intact.
In EP3−/− mice, there was also a striking loss of the acute pressor response specific to AngII. Consistent with the blunted pressor effects of acute infusion of AngII, chronic administration of AngII also resulted in less increase of SBP in EP3−/− mice. Furthermore, the changes in renal function did not appear to contribute to the difference in blood pressure between EP3+/+ and EP3−/− mice, since no significant alteration was observed in urine volume and sodium excretion between two genotypes. Together, these results suggest that the synergistic effect of EP3 on the AngII pressor response is a direct effect in the vasculature.
Three additional independent lines of study support the hypothesis that the effect of EP3 on AngII signaling is at the level of resistant vessels and is mediated at least in part by direct action on the contractility of vascular smooth muscle. Firstly, the contraction of the mesenteric artery induced by AngII was reduced in EP3−/− mice. In addition, the EP3 agonist potentiated, while its antagonist attenuated, AngII-evoked mesenteric arterial contractility. Secondly, AngII-induced phosphorylation of MLC20 and MYPT1 were inhibited by DG-041 and Rho guanine nucleotide exchange factor (GEF) 1 (Arhgef-1), an important GDP-GTP exchange factor specifically responsible for AngII-induced RhoA activation, was significantly suppressed in EP3−/− mouse mesenteric arteries. Finally, the increase of AngII-evoked intracellular calcium levels in VSMCs was attenuated by the EP3 antagonist DG-041 but enhanced by the EP3 agonist sulprostone.
It is well known that the contractility of vascular smooth muscle is potentiated by phosphorylation of MLC20 via Ca2+/calmodulin-activated myosin light chain kinase (MLCK) and reduced by dephosphorylation of MLC20 via myosin phosphatase (MLCP). AngII-induced activation of its Gq-coupled receptor causes a rise of Ca2+ levels to initiate Ca2+/calmodulin/MLCK pathway, while activation of its G12/13-coupled receptor potentiates Ca2+ sensitivity by increasing activity of Rho-GEF, activating Rho/Rho-kinase signaling and then inhibiting phosphorylation of MYPT1, the regulatory subunit of MLCP heterotrimer33, 34. Previous studies have demonstrated that in addition to Gi signaling causing a decrease in cAMP levels, the EP3 receptor may also mobilize intracellular calcium17,35, 36. It is also found that the EP3 agonist sulprostone-induced contraction of guinea-pig thoracic aorta may involve Ca2+ influx via L-type Ca2+ channels37. We showed that the EP3 receptor agonist sulprostone potentiated AngII-evoked Ca2+ mobilization and the EP3 antagonist DG-041 attenuated AngII-stimulated phosphorylation of MLC20 and MYPT1, which suggested that the EP3 receptor may synergize AngII-induced vasoconstriction. Among three RGS-containing RhoGEFs (Arhgef-1, -11 and -12), important GDP-GTP exchange factors specifically responsible for AngII-induced RhoA activation in VSMCs38-40, only Arhgef-1 expression was significantly reduced in EP3−/− mesenteric arteries. The reason why the EP3 receptor selectively affects Arhgef-1 expression is currently unknown. However, given the critical role of RGS-containing RhoGEFs in linking AT1 to RhoA activation, it is expected that reduction of Arhgef-1 expression would result in diminished phosphorylation of MLC20 and MYTP1 in EP3−/− arteries exposed to chronic AngII treatment.
PGE2 is a major cyclooxygenase product of vascular smooth muscle where AngII stimulates its synthesis41-43. Recent studies implicate COX1 activity is critical for the pressor response to AngII in both acute and chronic AngII–dependent models44, 45 and AngII–stimulated synthesis of COX1-derived PGE2 activates the EP1 receptor to promote AngII–dependent hypertension18. The present study further provides evidence that the EP3 receptor may also represent as a tonic vasoconstriction mediator, which acts synergistically with AngII to increase blood pressure. Since intrarenal and extrarenal AT1 receptors play non-redundant pressor roles in AngII-induced hypertension46, the present findings also support the possibility that the combination of AngII receptor blockers and the EP3 antagonists may represent a novel therapeutic strategy for the treatment of hypertension (Fig. S6). Moreover, since both the EP1 and EP3 receptors are vasoconstrictive, it would be interesting to determine whether blockade of both receptors is additive in reducing blood pressure at baseline or in AngII-dependent hypertension. This important issue could be addressed in a mouse line deficient for both EP1 and EP3 genes and it warrants further investigation.
One unexpected finding from our study is that although EP3−/− mice showed significantly attenuated AngII-induced hypertension, no alleviated cardiac hypertrophy was observed. One possible explanation for this discrepancy is that in addition to a direct growth promoting effect on cardiac myocytes and fibroblasts, AngII may synergize with the sympathetic nervous system, aldosterone, inflammation, and oxidative stress systemically or locally to drive cardiac hypertrophy and fibrosis in the face of high blood pressure and increased heart afterload47, 48. Since PGE2 has been found to be involved in the regulation of inflammation, aldosterone release, sympathetic activation and oxidative stress49, 50, EP3 gene deficiency may alter these biological processes and affect AngII-elicited cardiac hypertrophy. However, given that multiple splicing variants of the EP3 receptor exist51, it is hard to predict the exact cardiac phenotypes in mice with all EP3 receptor isoform deleted. Therefore, the effect of the EP3 receptor on AngII-dependent cardiac remodeling appears to be very complicated, and the exact mechanism by which AngII induces similar extent of cardiac hypertrophy phenotype in wild type and EP3−/− mice requires further investigation.
In summary, the EP3 receptor is a vasoconstriction mediator and its inactivation attenuates AngII-induced hypertension. It contributes to AngII-dependent hypertension at least partially via enhancing intracellular calcium concentration and Ca2+ sensitivity. Selective targeting of the EP3 receptor may represent a potential therapeutic target for the treatment of hypertension.
Supplementary Material
Supplemental Figure I. Genotyping and validation of EP3−/− mice. PCR genotyping of EP3+/+ and EP3−/− mice. Two pairs of primers were used for genotyping wild-type (152bp) and EP3−/− (721bp) alleles, respectively. B) RT-PCR analysis of mouse EP3α, EP3β, and EP3γ mRNA expression. Total RNA from kidneys and mesenteric arteries of wild type mice were used to detect EP3α, EP3β, and EP3γ variants and β-actin served as the loading control. C) RT-PCR analysis of EP3 mRNA and its subtype levels from kidneys of EP3+/+ and EP3−/− mice. D) Absence of the EP3 protein in the kidneys of EP3−/− mice, β-actin was used as the loading control.
Supplemental Figure II. Arhgef-1 protein expression and MLC20 and MYPT1 phosphorylation in EP3+/+ and EP3−/− mesenteric arteries. Western blot analysis of Arhgef-1 protein expression in EP3+/+ and EP3−/− mesenteric arteries pooled from 3 animals in each group. EP3−/− mesenteric arteries showed markedly reduced Arhgef-1 protein expression. B) Western blot analysis of MLC and MYPT1 phosphorylation in EP3+/+ and EP3−/− mesenteric arteries pooled from 3 animals in each group with or without 5-min pretreatment of AngII (1μmol/L). AngII enhanced the phosphorylation of both MLC and MYPT1 in EP3+/+ mice, while a lack of EP3 diminished the effect. β-actin was used as the loading control.
Supplemental Figure III. Validation of Arhgef-1 antibody. Rat VSMCs were transfected with three sets of Arhgef-1 siRNA (No. 2723, No. 1619 and No. 704) with the scramble siRNA as a control. Western blot (A) or Real-time PCR (B) was used to determine the protein and mRNA expression levels of Arhgef-1. A) Suppression of Arhgef-1 protein expression by three sets of Arhgef-1 siRNA. β-actin was used as the loading control. B) Arhgef-1 siRNAs reduced Arhgef-1 mRNA levels by 50%, with little effect on Arhgef-11 and Arhgef-12 expression. **P<0.01, siRNA vs. scramble. n=4 in each group.
Supplemental Figure IV. Effect of the EP3 receptor antagonist on AngII-induced MLC20 and MYPT1 phosphorylation in porcine coronary arteries. The rings of porcine coronary arteries were stimulated by AngII (1μmol/L) for 5minutes after preincubated in DG041 (10μmol/L) for 30minutes. DG041 markedly inhibited AngII-induced phosphorylation of MLC20 and MYPT1. *P<0.05, **P<0.01, Control group vs. AngII alone; #P<0.05, ###P<0.001, AngII+DG041 vs. AngII alone. n=3 in each group.
Supplemental Figure V. Effect of sulprostone and DG041treatment on intracellular Ca2+ levels in VSMCs. A) Compared with AngII (1 mol/L), sulprostone alone only slightly increased intracellular Ca2+ levels. ***P<0.001, 10μmol/L sulprostone vs. 1μmol/L sulprostone n=10 in each group. B) Pretreatment of VSMCs with DG041 (10μmol/L) had little effect on phenylephrine (1 mol/L)-induced calcium signal. n=15 in each group.
Supplemental Figure VI. The role of the EP3 receptor in AngII-induced vasoconstriction. AngII evokes vasopressor response through both Gq/Ca2+/calmodulin-dependent activation of MLCK and G12/13/Arhger-1/RhoA/Rho Kinase-mediated phosphorylation of MYPT1. By modulating the levels of Ca2+, Arhgef-1 and phosphorylation of MYPT1/MLC, the EP3 receptor synergistically acts with AngII to contract VSMCs via Ca2+ signaling and Ca2+ sensitivity pathways .
Supplemental Table I. Sequence of primers for genotyping and RT-PCR analysis
Acknowledgements
We thank Dr. Aihua Bian and Dr. Pingsheng Wu for statistical analysis of the Chronic AngII study. The expert technical assistance of Dr. Huamin Wang is gratefully acknowledged. The authors are grateful to M. Caton (Rhone-Poulenc Rorer, Dagenham, United Kingdom) for providing M&B28767, and thank the VICB Chemical synthesis core for DG-041.
Recourses of Funding
This work was supported by the Ministry of Science and Technology (2010CB517504 and 2010CB912503) (YG) and the Natural Science Foundation (30870905/81030003) (YG). Support was also provided by NIH grants DK46205 (RMB) and P50GM015431 (RMB).
Footnotes
Disclosures
None.
This is a PDF file of an unedited manuscript that has been accepted for publication. As a service to our customers we are providing this early version of the manuscript. The manuscript will undergo copyediting, typesetting, and review of the resulting proof before it is published in its final citable form. Please note that during the production process errors may be discovered which could affect the content, and all legal disclaimers that apply to the journal pertain.
References
- 1.Breyer MD, Breyer RM. G protein-coupled prostanoid receptors and the kidney. Annu Rev Physiol. 2001;63:579–605. doi: 10.1146/annurev.physiol.63.1.579. [DOI] [PubMed] [Google Scholar]
- 2.Cheng HF, Harris RC. Cyclooxygenases, the kidney, and hypertension. Hypertension. 2004;43:525–530. doi: 10.1161/01.HYP.0000116221.27079.ea. [DOI] [PubMed] [Google Scholar]
- 3.Hata AN, Breyer RM. Pharmacology and signaling of prostaglandin receptors: Multiple roles in inflammation and immune modulation. Pharmacol Ther. 2004;103:147–166. doi: 10.1016/j.pharmthera.2004.06.003. [DOI] [PubMed] [Google Scholar]
- 4.Qi Z, Cai H, Morrow JD, Breyer MD. Differentiation of cyclooxygenase 1- and 2-derived prostanoids in mouse kidney and aorta. Hypertension. 2006;48:323–328. doi: 10.1161/01.HYP.0000231934.67549.b7. [DOI] [PubMed] [Google Scholar]
- 5.Kobayashi T, Narumiya S. Function of prostanoid receptors: Studies on knockout mice. Prostaglandins Other Lipid Mediat. 2002;68:69–557. doi: 10.1016/s0090-6980(02)00055-2. [DOI] [PubMed] [Google Scholar]
- 6.Narumiya S, Sugimoto Y, Ushikubi F. Prostanoid receptors: Structures, properties, and functions. Physiol Rev. 1999;79:1193–1226. doi: 10.1152/physrev.1999.79.4.1193. [DOI] [PubMed] [Google Scholar]
- 7.Coleman RA, Grix SP, Head SA, Louttit JB, Mallett A, Sheldrick RL. A novel inhibitory prostanoid receptor in piglet saphenous vein. Prostaglandins. 1994;47:151–168. doi: 10.1016/0090-6980(94)90084-1. [DOI] [PubMed] [Google Scholar]
- 8.Kennedy I, Coleman RA, Humphrey PP, Levy GP, Lumley P. Studies on the characterisation of prostanoid receptors: A proposed classification. Prostaglandins. 1982;24:667–689. doi: 10.1016/0090-6980(82)90036-3. [DOI] [PubMed] [Google Scholar]
- 9.Lawrence RA, Jones RL. Investigation of the prostaglandin e (ep-) receptor subtype mediating relaxation of the rabbit jugular vein. Br J Pharmacol. 1992;105:817–824. doi: 10.1111/j.1476-5381.1992.tb09063.x. [DOI] [PMC free article] [PubMed] [Google Scholar]
- 10.Watabe A, Sugimoto Y, Honda A, Irie A, Namba T, Negishi M, Ito S, Narumiya S, Ichikawa A. Cloning and expression of cdna for a mouse ep1 subtype of prostaglandin e receptor. J Biol Chem. 1993;268:20175–20178. [PubMed] [Google Scholar]
- 11.Funk CD, Furci L, FitzGerald GA, Grygorczyk R, Rochette C, Bayne MA, Abramovitz M, Adam M, Metters KM. Cloning and expression of a cdna for the human prostaglandin e receptor ep1 subtype. J Biol Chem. 1993;268:26767–26772. [PubMed] [Google Scholar]
- 12.Irie A, Sugimoto Y, Namba T, Harazono A, Honda A, Watabe A, Negishi M, Narumiya S, Ichikawa A. Third isoform of the prostaglandin-e-receptor ep3 subtype with different c-terminal tail coupling to both stimulation and inhibition of adenylate cyclase. Eur J Biochem. 1993;217:313–318. doi: 10.1111/j.1432-1033.1993.tb18248.x. [DOI] [PubMed] [Google Scholar]
- 13.Namba T, Sugimoto Y, Negishi M, Irie A, Ushikubi F, Kakizuka A, Ito S, Ichikawa A, Narumiya S. Alternative splicing of c-terminal tail of prostaglandin e receptor subtype ep3 determines g-protein specificity. Nature. 1993;365:166–170. doi: 10.1038/365166a0. [DOI] [PubMed] [Google Scholar]
- 14.Negishi M, Namba T, Sugimoto Y, Irie A, Katada T, Narumiya S, Ichikawa A. Opposite coupling of prostaglandin e receptor ep3c with gs and g(o). Stimulation of gs and inhibition of g(o) J Biol Chem. 1993;268:26067–26070. [PubMed] [Google Scholar]
- 15.Sugimoto Y, Negishi M, Hayashi Y, Namba T, Honda A, Watabe A, Hirata M, Narumiya S, Ichikawa A. Two isoforms of the ep3 receptor with different carboxyl-terminal domains. Identical ligand binding properties and different coupling properties with gi proteins. J Biol Chem. 1993;268:2712–2718. [PubMed] [Google Scholar]
- 16.Yang J, Xia M, Goetzl EJ, An S. Cloning and expression of the ep3-subtype of human receptors for prostaglandin e2. Biochem Biophys Res Commun. 1994;198:999–1006. doi: 10.1006/bbrc.1994.1142. [DOI] [PubMed] [Google Scholar]
- 17.Hatae N, Sugimoto Y, Ichikawa A. Prostaglandin receptors: Advances in the study of ep3 receptor signaling. J Biochem. 2002;131:781–784. doi: 10.1093/oxfordjournals.jbchem.a003165. [DOI] [PubMed] [Google Scholar]
- 18.Guan Y, Zhang Y, Wu J, Qi Z, Yang G, Dou D, Gao Y, Chen L, Zhang X, Davis LS, Wei M, Fan X, Carmosino M, Hao C, Imig JD, Breyer RM, Breyer MD. Antihypertensive effects of selective prostaglandin e2 receptor subtype 1 targeting. J Clin Invest. 2007;117:2496–2505. doi: 10.1172/JCI29838. [DOI] [PMC free article] [PubMed] [Google Scholar]
- 19.Kennedy CR, Zhang Y, Brandon S, Guan Y, Coffee K, Funk CD, Magnuson MA, Oates JA, Breyer MD, Breyer RM. Salt-sensitive hypertension and reduced fertility in mice lacking the prostaglandin ep2 receptor. Nat Med. 1999;5:217–220. doi: 10.1038/5583. [DOI] [PubMed] [Google Scholar]
- 20.Zhu S, Xue R, Zhao P, Fan FL, Kong X, Zheng S, Han Q, Zhu Y, Wang N, Yang J, Guan Y. Targeted disruption of the prostaglandin e2 e-prostanoid 2 receptor exacerbates vascular neointimal formation in mice. Arterioscler Thromb Vasc Biol. 2011;31:1739–1747. doi: 10.1161/ATVBAHA.111.226142. [DOI] [PubMed] [Google Scholar]
- 21.Hristovska AM, Rasmussen LE, Hansen PB, Nielsen SS, Nusing RM, Narumiya S, Vanhoutte P, Skott O, Jensen BL. Prostaglandin e2 induces vascular relaxation by e-prostanoid 4 receptor-mediated activation of endothelial nitric oxide synthase. Hypertension. 2007;50:525–530. doi: 10.1161/HYPERTENSIONAHA.107.088948. [DOI] [PubMed] [Google Scholar]
- 22.Zhang Y, Guan Y, Schneider A, Brandon S, Breyer RM, Breyer MD. Characterization of murine vasopressor and vasodepressor prostaglandin e(2) receptors. Hypertension. 2000;35:1129–1134. doi: 10.1161/01.hyp.35.5.1129. [DOI] [PubMed] [Google Scholar]
- 23.Guan Y, Zhang Y, Wu J, Qi Z, Yang G, Dou D, Gao Y, Chen L, Zhang X, Davis LS, Wei M, Fan X, Carmosino M, Hao C, Imig JD, Breyer RM, Breyer MD. Antihypertensive effects of selective prostaglandin e(2) receptor subtype 1 targeting. J Clin Invest. 2007;117:2496–2505. doi: 10.1172/JCI29838. [DOI] [PMC free article] [PubMed] [Google Scholar]
- 24.Lee DL, Webb RC, Jin L. Hypertension and rhoa/rho-kinase signaling in the vasculature: Highlights from the recent literature. Hypertension. 2004;44:796–799. doi: 10.1161/01.HYP.0000148303.98066.ab. [DOI] [PubMed] [Google Scholar]
- 25.Tilley SL, Audoly LP, Hicks EH, Kim HS, Flannery PJ, Coffman TM, Koller BH. Reproductive failure and reduced blood pressure in mice lacking the ep2 prostaglandin e2 receptor. J Clin Invest. 1999;103:1539–1545. doi: 10.1172/JCI6579. [DOI] [PMC free article] [PubMed] [Google Scholar]
- 26.Hockel GM, Cowley AW., Jr. Prostaglandin e2-induced hypertension in conscious dogs. Am J Physiol. 1979;237:H449–454. doi: 10.1152/ajpheart.1979.237.4.H449. [DOI] [PubMed] [Google Scholar]
- 27.Stock JL, Shinjo K, Burkhardt J, Roach M, Taniguchi K, Ishikawa T, Kim HS, Flannery PJ, Coffman TM, McNeish JD, Audoly LP. The prostaglandin e2 ep1 receptor mediates pain perception and regulates blood pressure. J Clin Invest. 2001;107:325–331. doi: 10.1172/JCI6749. [DOI] [PMC free article] [PubMed] [Google Scholar]
- 28.Ariumi H, Takano Y, Masumi A, Takahashi S, Hirabara Y, Honda K, Saito R, Kamiya HO. Roles of the central prostaglandin ep3 receptors in cardiovascular regulation in rats. Neurosci Lett. 2002;324:61–64. doi: 10.1016/s0304-3940(02)00174-x. [DOI] [PubMed] [Google Scholar]
- 29.Hocherl K, Kammerl MC, Schumacher K, Endemann D, Grobecker HF, Kurtz A. Role of prostanoids in regulation of the renin-angiotensin-aldosterone system by salt intake. Am J Physiol Renal Physiol. 2002;283:F294–301. doi: 10.1152/ajprenal.00347.2001. [DOI] [PubMed] [Google Scholar]
- 30.Kawada N, Solis G, Ivey N, Connors S, Dennehy K, Modlinger P, Hamel R, Kawada JT, Imai E, Langenbach R, Welch WJ, Wilcox CS. Cyclooxygenase-1-deficient mice have high sleep-to-wake blood pressure ratios and renal vasoconstriction. Hypertension. 2005;45:1131–1138. doi: 10.1161/01.HYP.0000166141.69081.80. [DOI] [PubMed] [Google Scholar]
- 31.Ye W, Zhang H, Hillas E, Kohan DE, Miller RL, Nelson RD, Honeggar M, Yang T. Expression and function of cox isoforms in renal medulla: Evidence for regulation of salt sensitivity and blood pressure. Am J Physiol Renal Physiol. 2006;290:F542–549. doi: 10.1152/ajprenal.00232.2005. [DOI] [PubMed] [Google Scholar]
- 32.Mtabaji JP, Kihara M, Yamori Y. The effects of indomethacin and pge2 on vascular reactivity in spontaneously hypertensive rats: Possible role of prostaglandins in the pathogenesis of hypertension. Prostaglandins Leukot Med. 1985;20:255–265. doi: 10.1016/0262-1746(85)90147-7. [DOI] [PubMed] [Google Scholar]
- 33.Puetz S, Lubomirov LT, Pfitzer G. Regulation of smooth muscle contraction by small gtpases. Physiology (Bethesda) 2009;24:342–356. doi: 10.1152/physiol.00023.2009. [DOI] [PubMed] [Google Scholar]
- 34.Rossman KL, Der CJ, Sondek J. Gef means go: Turning on rho gtpases with guanine nucleotide-exchange factors. Nat Rev Mol Cell Biol. 2005;6:167–180. doi: 10.1038/nrm1587. [DOI] [PubMed] [Google Scholar]
- 35.An S, Yang J, So SW, Zeng L, Goetzl EJ. Isoforms of the ep3 subtype of human prostaglandin e2 receptor transduce both intracellular calcium and camp signals. Biochemistry. 1994;33:14496–14502. doi: 10.1021/bi00252a016. [DOI] [PubMed] [Google Scholar]
- 36.Irie A, Segi E, Sugimoto Y, Ichikawa A, Negishi M. Mouse prostaglandin e receptor ep3 subtype mediates calcium signals via gi in cdna-transfected chinese hamster ovary cells. Biochem Biophys Res Commun. 1994;204:303–309. doi: 10.1006/bbrc.1994.2460. [DOI] [PubMed] [Google Scholar]
- 37.Shum WW, Le GY, Jones RL, Gurney AM, Sasaki Y. Involvement of rho-kinase in contraction of guinea-pig aorta induced by prostanoid ep3 receptor agonists. Br J Pharmacol. 2003;139:1449–1461. doi: 10.1038/sj.bjp.0705393. [DOI] [PMC free article] [PubMed] [Google Scholar]
- 38.Ying Z, Jin L, Palmer T, Webb RC. Angiotensin ii up-regulates the leukemia-associated rho guanine nucleotide exchange factor (rhogef), a regulator of g protein signaling domain-containing rhogef, in vascular smooth muscle cells. Mol Pharmacol. 2006;69:932–940. doi: 10.1124/mol.105.017830. [DOI] [PubMed] [Google Scholar]
- 39.Guilluy C, Bregeon J, Toumaniantz G, Rolli-Derkinderen M, Retailleau K, Loufrani L, Henrion D, Scalbert E, Bril A, Torres RM, Offermanns S, Pacaud P, Loirand G. The rho exchange factor arhgef1 mediates the effects of angiotensin ii on vascular tone and blood pressure. Nat Med. 2010;16:183–190. doi: 10.1038/nm.2079. [DOI] [PubMed] [Google Scholar]
- 40.Ohtsu H, Mifune M, Frank GD, Saito S, Inagami T, Kim-Mitsuyama S, Takuwa Y, Sasaki T, Rothstein JD, Suzuki H, Nakashima H, Woolfolk EA, Motley ED, Eguchi S. Signal-crosstalk between rho/rock and c-jun nh2-terminal kinase mediates migration of vascular smooth muscle cells stimulated by angiotensin ii. Arterioscler Thromb Vasc Biol. 2005;25:1831–1836. doi: 10.1161/01.ATV.0000175749.41799.9b. [DOI] [PubMed] [Google Scholar]
- 41.Ohnaka K, Numaguchi K, Yamakawa T, Inagami T. Induction of cyclooxygenase-2 by angiotensin ii in cultured rat vascular smooth muscle cells. Hypertension. 2000;35:68–75. doi: 10.1161/01.hyp.35.1.68. [DOI] [PubMed] [Google Scholar]
- 42.Purdy KE, Arendshorst WJ. Prostaglandins buffer ang ii-mediated increases in cytosolic calcium in preglomerular vsmc. Am J Physiol. 1999;277:F850–858. doi: 10.1152/ajprenal.1999.277.6.F850. [DOI] [PubMed] [Google Scholar]
- 43.Satoh H, Satoh S. Prostaglandin e2 and i2 production in isolated dog renal arteries in the absence or presence of vascular endothelial cells. Biochem Biophys Res Commun. 1984;118:873–876. doi: 10.1016/0006-291x(84)91476-1. [DOI] [PubMed] [Google Scholar]
- 44.Qi Z, Hao CM, Langenbach RI, Breyer RM, Redha R, Morrow JD, Breyer MD. Opposite effects of cyclooxygenase-1 and -2 activity on the pressor response to angiotensin ii. J Clin Invest. 2002;110:61–69. doi: 10.1172/JCI14752. [DOI] [PMC free article] [PubMed] [Google Scholar]
- 45.Francois H, Athirakul K, Mao L, Rockman H, Coffman TM. Role for thromboxane receptors in angiotensin-ii-induced hypertension. Hypertension. 2004;43:364–369. doi: 10.1161/01.HYP.0000112225.27560.24. [DOI] [PubMed] [Google Scholar]
- 46.Crowley SD, Gurley SB, Oliverio MI, Pazmino AK, Griffiths R, Flannery PJ, Spurney RF, Kim HS, Smithies O, Le TH, Coffman TM. Distinct roles for the kidney and systemic tissues in blood pressure regulation by the renin-angiotensin system. J Clin Invest. 2005;115:1092–1099. doi: 10.1172/JCI200523378. [DOI] [PMC free article] [PubMed] [Google Scholar]
- 47.Reudelhuber TL, Bernstein KE, Delafontaine P. Is angiotensin ii a direct mediator of left ventricular hypertrophy? Time for another look. Hypertension. 2007;49:1196–1201. doi: 10.1161/HYPERTENSIONAHA.106.075085. [DOI] [PMC free article] [PubMed] [Google Scholar]
- 48.Kurdi M, Booz GW. New take on the role of angiotensin ii in cardiac hypertrophy and fibrosis. Hypertension. 2011;57:1034–1038. doi: 10.1161/HYPERTENSIONAHA.111.172700. [DOI] [PMC free article] [PubMed] [Google Scholar]
- 49.Shinmura K, Tamaki K, Sato T, Ishida H, Bolli R. Prostacyclin attenuates oxidative damage of myocytes by opening mitochondrial atp-sensitive k+ channels via the ep3 receptor. Am J Physiol Heart Circ Physiol. 2005;288:H2093–2101. doi: 10.1152/ajpheart.01003.2004. [DOI] [PubMed] [Google Scholar]
- 50.Zhang ZH, Yu Y, Wei SG, Nakamura Y, Nakamura K, Felder RB. Ep(3) receptors mediate pge(2)-induced hypothalamic paraventricular nucleus excitation and sympathetic activation. Am J Physiol Heart Circ Physiol. 2011;301:H1559–1569. doi: 10.1152/ajpheart.00262.2011. [DOI] [PMC free article] [PubMed] [Google Scholar]
- 51.Sugimoto Y, Narumiya S. Prostaglandin e receptors. J Biol Chem. 2007;282:11613–11617. doi: 10.1074/jbc.R600038200. [DOI] [PubMed] [Google Scholar]
Associated Data
This section collects any data citations, data availability statements, or supplementary materials included in this article.
Supplementary Materials
Supplemental Figure I. Genotyping and validation of EP3−/− mice. PCR genotyping of EP3+/+ and EP3−/− mice. Two pairs of primers were used for genotyping wild-type (152bp) and EP3−/− (721bp) alleles, respectively. B) RT-PCR analysis of mouse EP3α, EP3β, and EP3γ mRNA expression. Total RNA from kidneys and mesenteric arteries of wild type mice were used to detect EP3α, EP3β, and EP3γ variants and β-actin served as the loading control. C) RT-PCR analysis of EP3 mRNA and its subtype levels from kidneys of EP3+/+ and EP3−/− mice. D) Absence of the EP3 protein in the kidneys of EP3−/− mice, β-actin was used as the loading control.
Supplemental Figure II. Arhgef-1 protein expression and MLC20 and MYPT1 phosphorylation in EP3+/+ and EP3−/− mesenteric arteries. Western blot analysis of Arhgef-1 protein expression in EP3+/+ and EP3−/− mesenteric arteries pooled from 3 animals in each group. EP3−/− mesenteric arteries showed markedly reduced Arhgef-1 protein expression. B) Western blot analysis of MLC and MYPT1 phosphorylation in EP3+/+ and EP3−/− mesenteric arteries pooled from 3 animals in each group with or without 5-min pretreatment of AngII (1μmol/L). AngII enhanced the phosphorylation of both MLC and MYPT1 in EP3+/+ mice, while a lack of EP3 diminished the effect. β-actin was used as the loading control.
Supplemental Figure III. Validation of Arhgef-1 antibody. Rat VSMCs were transfected with three sets of Arhgef-1 siRNA (No. 2723, No. 1619 and No. 704) with the scramble siRNA as a control. Western blot (A) or Real-time PCR (B) was used to determine the protein and mRNA expression levels of Arhgef-1. A) Suppression of Arhgef-1 protein expression by three sets of Arhgef-1 siRNA. β-actin was used as the loading control. B) Arhgef-1 siRNAs reduced Arhgef-1 mRNA levels by 50%, with little effect on Arhgef-11 and Arhgef-12 expression. **P<0.01, siRNA vs. scramble. n=4 in each group.
Supplemental Figure IV. Effect of the EP3 receptor antagonist on AngII-induced MLC20 and MYPT1 phosphorylation in porcine coronary arteries. The rings of porcine coronary arteries were stimulated by AngII (1μmol/L) for 5minutes after preincubated in DG041 (10μmol/L) for 30minutes. DG041 markedly inhibited AngII-induced phosphorylation of MLC20 and MYPT1. *P<0.05, **P<0.01, Control group vs. AngII alone; #P<0.05, ###P<0.001, AngII+DG041 vs. AngII alone. n=3 in each group.
Supplemental Figure V. Effect of sulprostone and DG041treatment on intracellular Ca2+ levels in VSMCs. A) Compared with AngII (1 mol/L), sulprostone alone only slightly increased intracellular Ca2+ levels. ***P<0.001, 10μmol/L sulprostone vs. 1μmol/L sulprostone n=10 in each group. B) Pretreatment of VSMCs with DG041 (10μmol/L) had little effect on phenylephrine (1 mol/L)-induced calcium signal. n=15 in each group.
Supplemental Figure VI. The role of the EP3 receptor in AngII-induced vasoconstriction. AngII evokes vasopressor response through both Gq/Ca2+/calmodulin-dependent activation of MLCK and G12/13/Arhger-1/RhoA/Rho Kinase-mediated phosphorylation of MYPT1. By modulating the levels of Ca2+, Arhgef-1 and phosphorylation of MYPT1/MLC, the EP3 receptor synergistically acts with AngII to contract VSMCs via Ca2+ signaling and Ca2+ sensitivity pathways .
Supplemental Table I. Sequence of primers for genotyping and RT-PCR analysis


