

Abstract
HIV-1 latency is a barrier to overcome in the effort to fully eradicate the virus from infected individuals using highly active anti-retroviral therapy (HAART). Therefore, the study of the mechanisms underlying the establishment and maintenance of HIV-1 latency are vital to achieving a cure. Transcriptional repression of the viral promoter is the major cause of HIV-1 latency. DNA methylation of genomic regions known as CpG islands (CpGIs) is a well-established transcriptional regulatory mechanism, and the HIV-1 provirus contains several conserved CpGIs including two that are located within the viral promoter region. The study of these CpGIs in both in vitro and in vivo models of HIV-1 latency using the technique of bisulfite-mediated methylcytosine mapping has led to their identification as factors that contribute to the maintenance of HIV-1 latency. Here, we discuss the identification of CpGIs within the HIV-1 provirus and the study of their differential methylation patterns in several HIV-1 latency models using bisulfite-mediated methylcytosine mapping.
Keywords: CpG Island, DNA methylation, HIV-1 latency, Bisulfite-mediated methylcytosine mapping
1. Introduction
DNA methylation is an epigenetic modification that is required for normal development of mammals and involves the silencing of gene expression [1, 2]. In contrast to embryonic stem cells, the majority of DNA methylation within somatic cells occurs in a CpG dinucleotide context, with the methyl group being transferred to the number 5 carbon of the cytosine pyrimidine ring. Interestingly, most CpG dinucleotides are present at one-third to one-fourth of their expected frequency within vertebrate genomes, a phenomenon referred to as “CG suppression” [3, 4]. However, stretches of genomic DNA can contain higher than expected frequencies of CpG dinucleotides and this clustering of CpG dinucleotides is termed a CpG Island (CpGI) [3, 5]. CpGIs are mostly unmethylated, and most often associated with the promoter region of mammalian genes. In fact, ~70% of all human gene promoters are associated with CpGIs [6]. Hypermethylation of CpGIs within promoter regions of genes leads to transcriptional repression of those genes [7, 8].
DNA methylation can induce transcriptional repression via two general mechanisms. First, such a DNA modification can inhibit the binding of transcription factors to their respective DNA binding motifs [9]. The majority of mammalian transcription factors bind to GC-rich DNA motifs that contain CpGs, and some cannot bind to their recognition sites in the presence of DNA methylation [10]. Second, methylated CpGs are specifically recognized by a class of proteins that induce a restrictive chromatin state [11, 12]. Methyl-CpG-binding domain proteins (MBDs) bind methylated DNA and recruit chromatin remodeling co-repressor complexes, such as the nucleosome remodeling and histone deacetylation (NuRD) complex [13-18].
The 5’ long terminal repeat (LTR) promoter regions of retroviral proviruses are also subject to DNA methylation-induced transcriptional repression. Early studies of endogenous retroviruses in mice implicated CpG methylation in the silencing of viral gene expression [19]. More recent studies show CpG methylation of the LTR promoter within several different retroviruses, both endogenous and infectious, is coupled to transcriptional repression of these 3 viral promoters. This includes the infectious human T-cell leukemia virus type-1, Moloney murine leukemia virus, Rous sarcoma virus, and the human endogenous retroviral families of H, K, and W [19-27].
Recently published reports indicate that the promoter region of the human immunodeficiency virus type 1 (HIV-1) is also epigenetically regulated by CpG methylation [28, 29]. In agreement with what is observed in retroviruses, HIV-1 LTR promoter methylation is correlated with a transcriptionally silent provirus and a latent state of infection.
HIV-1 latency represents a barrier to eradication of the virus from infected individuals. With the introduction of Highly Active Antiretroviral Therapy (HAART) in the mid-90s, HIV-1-associated mortality has dramatically decreased among infected persons of the developed world [30]. HAART is capable of lowering HIV-1 viral loads to undetectable levels. However, the existence of cellular reservoirs that harbor fully integrated but transcriptionally silent provirus allows the virus to persist, albeit, in an inactive form in the presence of HAART [31-34]. Eradication of these reservoirs through the reactivation of latent provirus could lead to the eradication of infection.
Early studies using plasmids in which the HIV-1 promoter drives transcription of a reporter gene showed that methylation of this promoter inhibits gene expression [35, 36]. Subsequent studies further implicated CpG methylation in HIV-1 latency in both the human monocytic cell line, U937, and the human T-cell line, ACH-2 [37, 38]. More compelling evidence for the role of CpG methylation in HIV-1 latency has been provided by two new studies that show methylation of the HIV-1 LTR promoter in latently infected primary CD4+ T-cells [28, 29].
In the first study, Kauder et al showed that the HIV-1 LTR promoter is methylated in latently infected cells generated in vitro using Jurkat cells, and in primary lymphoid cells [29]. A link was also provided between promoter methylation and a repressive chromatin state by showing that the MBD protein, methyl-CpG binding domain protein 2 (MBD2) and histone deacetylase 2 (HDAC2)—a member of the NuRD complex—interact with the methylated CpGs within the LTR promoter region of latently infected cells. Importantly, Kauder et al showed that this methylation-induced latent state is reversible and that the methylation inhibitor, 5-aza-2’-deoxycytidine (aza-CdR), could synergize with the known latency antagonist, Tumor Necrosis Factor-alpha (TNF-α), to reactivate latent provirus.
In the second study, Blazkova et al, showed that latently infected CD4+ T-cells isolated from aviremic patients harbor provirus with methylated LTR promoters [28]. They also showed that some aviremic patients contained provirus without methylated LTR promoters, pointing to the existence of other methylation-independent mechanisms for latency. However, Blazkova et al further showed that latent cells harboring provirus with methylated LTR promoters were more difficult to reactivate than latent cells harboring provirus with unmethylated LTR promoters. In contrast, methylated HIV promoters where more responsive to reactivation by combinations of methylation inhibitors or HDAC inhibitors with other known HIV-1 latency antagonists, such as TNF-α.
These studies suggest that HIV-1 LTR promoter methylation is involved in the maintenance and the establishment of HIV-1 latency, and likely involves the remodeling of chromatin as a mechanism. The importance of HIV-1 LTR promoter methylation in HIV-1 latency is underscored by the difficulty to reactivate latent provirus that contain hypermethylated LTR promoter regions, and by the observation that reactivation of such provirus using aza-CdR or HDAC inhibitors lead to a greater reactivation when given in combination with other latency antagonists, such as TNF-α. Therefore, the study of DNA methylation within the promoter region of the HIV-1 LTR is important to our understanding of the mechanisms that govern HIV-1 latency, and ultimately to our efforts of trying to eradicate the virus from infected individuals.
In this review, we discuss experimental strategies for the study of CpG methylation within the HIV-1 provirus during latency. Emphasis is placed on identifying and locating CpGIs within the HIV-1 genome as well as HIV-1 latency models that can be used to study promoter methylation. Lastly, we discuss in detail an experimental method, bisulfite-mediated methylcytosine mapping, for assessing the differential methylation pattern of CpGIs within the HIV-1 genome.
2. Identifying CpG islands within the HIV-1 genome
2.1 Defining characteristics of CpG islands
The formal definition of a CpGI is a genomic region of at least 200bp that has a GC content of at least 50% and an observed/expected CpG ratio of at least 60% (defined hereafter) [39]. For example, the human genome has a GC content of ~42% and, statistically, CpG dinucleotides should be expected to account for ~4.4% of the genome (.21 × .21 = 4.41%) [3, 4]. However, CpGs represent less than 1% of all dinucleotide pairs within the human genome, so the majority of the human genome has an observed/expected CpG ratio of ~23% (1%/4.4%=23%). In order for a section of the human genome to be considered as a CpGI, the observance of CpG dinucleotides has to be at least ~2.64% in order to obtain an observed/expected CpG ratio of 60% (2.64%/4.4%). In fact, only ~1% of the entire human genome meets this criteria, with the majority of CpGIs found in and around promoter regions [40-42].
The observed selection against CpG dinucleotides in vertebrate genomes is referred to as “CG suppression”. CG suppression is the result of several factors. First, cytosine and guanine bases have higher stacking energies than do adenine and thymine, therefore the stacking of cytosine and guanine together creates the potential for more structural strain in the double-helix [43]. In addition, the human innate immune response is activated by unmethylated CpGs. Having a large number of CpGs in the genome might contribute to the activation of the innate immune response and potentially increase the risk for autoimmunity [44-47]. Lastly, methylated cytosines of CpGs are prone to spontaneous deamination into thymine, leading to the potential for a higher frequency of mutation [48-49]. Spontaneous deamination of methylated CpGs over the course of millions of years of evolution could also explain the low frequency of this dinucleotide pair.
2.2 Computational analysis of CpG islands
The HIV-1 provirus is similar to mammalian genomes in that CG suppression is observed throughout most of the genome, and CpG dinucleotides are found clustered in CpGIs. CpGIs can be identified within the HIV-1 genome in the same manner as the human genome.
We have used MethPrimer and CpGPlot to identify and locate CpGIs within the HIV genome [50-51]. MethPrimer limits the input sequence to 5000bp and should be used when scanning small stretches of DNA, while CpGPlot has no input nucleotide limit and can be used for scanning large genomes. In fact, MethPrimer’s primary function is aiding in the design of primers to be used for PCR amplification of bisulfite-treated DNA (section 4). CpGPlot’s main function, on the other hand, is to identify and locate CpGIs within an input sequence of DNA. Because, the definition of a CpGI can be somewhat flexible in terms of the length of the CpGI, the observed/expected CpG ratio and the GC%, CpGPlot, and other programs allow for the user to change these parameters before the input sequence is analyzed. This allows the user to identify potentially interesting regions of a genome that may not exactly fit the formal definition. To make identifying these regions a little easier CpGPlot provides three graphs of the output sequence, one for each CpGI criteria. This allows the user to scan the entire input sequence for potential CpGIs without the need to play with the variables multiple times.
2.3 Conservation of CpG islands within the HIV-1 genome
CpGPlot analysis of the HIV-1 infectious molecular clone, HXB2, of the LAI/IIIB laboratory strain (strain used in most experiments), reveals the presence of four CpGIs, which we have named based on their location within the genome: 5’ LTR CpGI, non-coding region CpGI (NCR CpGI), envelope, tat, rev CpGI (ETR CpGI), and 3’ LTR CpGI (Figure 1). The two LTR CpGIs correspond to the U3 region, while the NCR CpGI is situated just outside of the U5 region of the 5’ LTR. The ETR CpGI is an intragenic CpGI found within the envelope gene, as well as the second exons of both the tat and rev genes.
FIGURE 1. Location and conservation of CpGIs within the genome of different HIV-1 M-group subtypes.

Location and conservation of CpGIs (red bars) within the genome of several HIV-1 M-group subtypes. Up to 3 representative sequences of each subtype (A1, A2, B, C, D, F1, F2, G, H, J, K, AE) were analyzed for CpGIs using CpGPlot. Sequences where obtained from the LANL sequence database using the premade subtype sequence alignment. The location of each CpGI identified is mapped relative to the reference strain, HXB2. HXB2 strain sequence and numbering system obtained from Los Alamos National Laboratories sequence database. Percent conservation is calculated as the number of sequences that contain a specific CpGI divided by the total number of sequences analyzed. Parameters used in CpGPlot include 60% observed/expected ratio, 50% GC content, and 100bp for CpGI length. Transcriptional start site is identified by the arrow in the 5’LTR.
The importance of these four CpGIs is underscored by their conservation among the different HIV-1 subtypes (Figure 1). Using CpGPlot, we analyzed ~3 representative sequences of each M-group subtype (A-K, recombinant AE). Sequences were obtained from the Los Alamos National Laboratory HIV sequence database, using the premade subtype sequence alignment [52]. Not enough sequence data is available to attain the conservation of the 5’ LTR CpGI and 3’ LTR CpGI of HIV-1 M-group, while the NCR CpGI is conserved in 92% of HIV-1 M-group subtypes analyzed. The 5’ LTR CpGI and the NCR CpGI encompass the HIV-1 LTR promoter and thus have been the focus of all the studies concerning CpG promoter methylation of the HIV-1 LTR. Perhaps surprisingly, the ETR CpGI is conserved in 85% of HIV-1 M-group subtypes analyzed. Even more surprising, the analysis of multiple sequences from different subtypes revealed an additional CpGI. Envelope CpGI (env CpGI) is located within the env gene, ~600bp upstream of the ETR CpGI. It is not highly conserved among all different subtypes (35%), but is highly conserved within subtypes, D, F2, and AE. Of interest, these two env gene CpGIs are located just upstream of an HIV-1 antisense open reading (ASORF) frame that was computationally predicted by Miller in 1988 [53].
3. HIV-1 latency models used to study methylation
3.1 In vitro model of HIV-1 latency: J-Lat Model
CpG promoter methylation of the HIV-1 LTR has been studied in vitro using both reporter plasmid systems and in latently infected transformed cell lines [35-38]. More recently, analysis of CpG promoter methylation of the HIV-1 LTR has been performed using an ex vivo model of HIV-1 latency in CD4+ T-cells [28, 29]. Here, we will discuss three systems used to study the differential methylation pattern of latently infected cells versus productively infected cells.
The in vitro Jurkat Latency (J-Lat) model of HIV-1 latency (Figure 2a) was established by infecting the human T-cell leukemia cell line, Jurkat, with virus generated from the HIV-1 molecular clone, HIV-R7/E-/GFP [54]. HIV-R7/E-/GFP is a recombinant molecular clone that encodes the green fluorescent protein (GFP) in place of the nef gene, and was generated by introducing a frameshift mutation in the env gene of the HIV-R7/3/GFP molecular clone, a derivative of HXB2 [55]. This mutation limits infection to a single round, and to compensate for the defective HIV-1 envelope, viral particles need to be pseudotyped with VSV-G envelope glycoprotein encoded on a separate plasmid.
Figure 2. Establishment of HIV-1 latency models used to study CpGI methylation of the HIV-1 genome.

A) Establishment of the J-Lat model. Jurkat cells were infected with the HIV/R7/E-/GFP molecular clone, which resulted in productively infected cells (green), latently infected cells (black), and uninfected cells (no DNA). Latently infected cells and uninfected cells (GFP-) were sorted using FACS, and then stimulated with TNF-α. GFP-positive cells were individually sorted via FACS and cloned to produce J-Lat clonal populations tha can be reactivated with TNF-α. B) Establishment of primary CD4+ T-cell model of HIV-1 latency. Naïve CD4+ T-cells are isolated from uninfected donor blood and differentiated into Th1, Th2, and NP CD4+ T-cell populations. Cell populations are maintained in IL-2 and infected with the dHIV molecular clone lacking a functional env gene. Productively infected cells are assessed by p24gag protein levels (green). These cells die in culture within 3-5 days p.i. leaving latently infected cells (black) and uninfected cells (no DNA). These two cell populations are treated with αCD3/αCD28 antibodies, and latently infected cells are identified as those that upregulate p24gag production.
Four days post infection Jurkat cells were analyzed for GFP expression, and GFP-negative cells (GFP-) were isolated by Fluorescence-Activated Cell Sorting (FACS). This population of cells harbored two different cell types: latently infected cells and uninfected cells. In order to distinguish between the two populations, cells were treated with the HIV-1 latency antagonist, TNF-α. A small population of ~2% expressed GFP after TNF-α treatment. These cells represented the latently infected cell population, and were individually sorted via FACS and cloned to produce latently infected cell lines that can be used to study factors that play a role in the maintenance and reactivation of HIV-1 latency.
Analysis of CpG promoter methylation of the HIV-1 LTR within J-Lat clones by bisulfite-mediated methylcytosine mapping (section 4) reveals that latently infected cells (GFP-) exhibit hypermethylation of two CpGIs, 5’ LTR CpGI and NCR CpGI [29]. In contrast, GFP+ cells obtained observing a productive infection show a hypomethylated HIV promoter. Subsequently, treatment of J-Lat clones with aza-CdR can induce hypomethylation of the two promoter-region CpGIs, which leads to reactivation [28, 29].
3.2 In vitro model of HIV latency: Primary T-cell latency model
The J-Lat model has been established using a transformed cell line and therefore possesses cellular abnormalities not found in non-transformed cells. For this reason, CpG promoter methylation of the HIV-1 LTR can also be studied using a recently developed in vitro HIV-1 latency model based on non-transformed cells (Figure 2b) [56].
In this model, naïve CD4 T cells are purified from uninfected donor blood and cultured under activation/differentiation conditions that drive differentiation of these cells to either a Th1, Th2, or non-polarized (NP) central memory phenotype [57,58]. Activation is achieved via incubation of naïve cells with anti-CD3 and anti-CD28 antibodies attached to beads. Simultaneously with this activating condition, cells are incubated with the following cocktails of cytokines and antibodies. Th1 differentiation is driven by the cytokine IL-12, in the presence of an anti- IL-4 monoclonal antibody. This treatment leads to the activation of the transcription factor, T-bet. The use of anti- IL-4 monoclonal antibody minimizes differentiation into the Th2 subset. Th2 differentiatioin is driven by IL-4 in combination with anti-IL-12, leading to activation of the transcription factor, GATA-3. The use of anti-IL-12 here minimizes Th1 differentiation. Finally, NP differentiation is driven by TGF-beta, in combination with anti-IL4 and anti-IL-12. Differentiation of each subset is monitored by phenotypic analysis of specific expression markers. Expression of CD45RA, a marker of naïve T-cells, is low in all three memory subsets, while expression of CD45RO is high in all three subsets.
The NP cell population shares many phenotypic markers with in vivo central memory T-cells (TCM), including a high expression profile for the secondary lymphoid tissue homing receptor, CCR7, and the co-activation molecule, CD27. In addition, NP cells-like TCM cells- do not express the differentiation markers, IL-4 and INF-gamma. In contrast, Th1 cells do not express CCR7 or CD27, but express high levels of the Th1 differentiation marker marker, INF-gamma. Th2 cells also fail to express CCR7 and CD27, and express high levels of the Th2 differentiation marker, IL-4. Recent experiments indicate that central memory T cells harbor latent HIV in patients [59].
The three cell populations are infected, in the presence of IL-2, with the dHIV-1 virus that contains a frameshift mutation in the env gene [60]. This limits infection to a single round within this system, which allows for the detection of latently infected cells by blocking the spread of productive infection and virus-induced apoptosis that are associated with infection by a fully competent molecular clone. For infection, the HIV-1 envelope is provided is trans using a separate expression vector. Three days post infection cells are analyzed for productive infection by intracellular staining for the viral p24gag protein. Cells expressing high levels of p24gag are considered to be productively infected and die in culture within 3-5 days after infection due to virus-induced apoptosis, leaving both uninfected and latently infected cells alive in culture. Seven days post infection, the remaining cells are stimulated with αCD3/αCD28 antibodies and p24gag levels are analyzed to assess the latently-infected population. Cells expressing p24gag after reactivation are considered the latently infected population.
Analysis of the three subsets of CD4+ T-cells reveals that the NP cell population contains the highest percentage of latently infected cells [56]. Analysis of the methylation status of the NCR CpGI within the NP cell population reveals that latently infected NP cells harbor significantly more provirus with a methylated NCR CpGI than the productively infected NP cell population [29].
Lastly, CpG promoter methylation of the HIV-1 LTR can also be analyzed using primary CD4+ T-cells isolated from infected patient’s blood. Methylation analysis of the 5’ LTR CpGI within memory CD4+ T-cells of viremic versus aviremic patients reveals that methylation is more prevalent in aviremic patients [28].
4. Bisulfite-mediated methylcytosine mapping
4.1 Theory
Bisulfite-mediated methylcytosine mapping is an experimental method used for examining the differential methylation pattern of the HIV-1 LTR promoter. Bisulfite-mediated methylcytosine mapping utilizes PCR to amplify target DNA, and is used to identify methylation at the nucleotide level [61]. It is, therefore, useful for high-resolution methylation analyses within regions of known nucleotide sequence. This technique is based upon the observation that cytosine bases are deaminated by sodium bisulfite to produce uracil bases in denatured DNA [62-65]. Importantly, sodium bisulfite also deaminates methylcytosine but the rate of methylcytosine deamination is two orders of magnitude less than that of cytosine [66]. Therefore, during the course of sodium bisulfite treatment nearly all unmethylated cytosines are converted to uracil, while methylated cytosines remain unchanged (Figure 3). Methylation of individual cytosines can be scored by PCR amplification, cloning, and nucleotide sequence determination of the treated DNA, where cytosines that remain so after sodium bisulfite treatment were methylated. The following protocol for bisulfite-mediated methylcytosine mapping is a modified version of one described by Rick Lawrence and Craig Pikaard [67].
Figure 3. Principle of Bisulfite-mediated methylcytosine mapping.
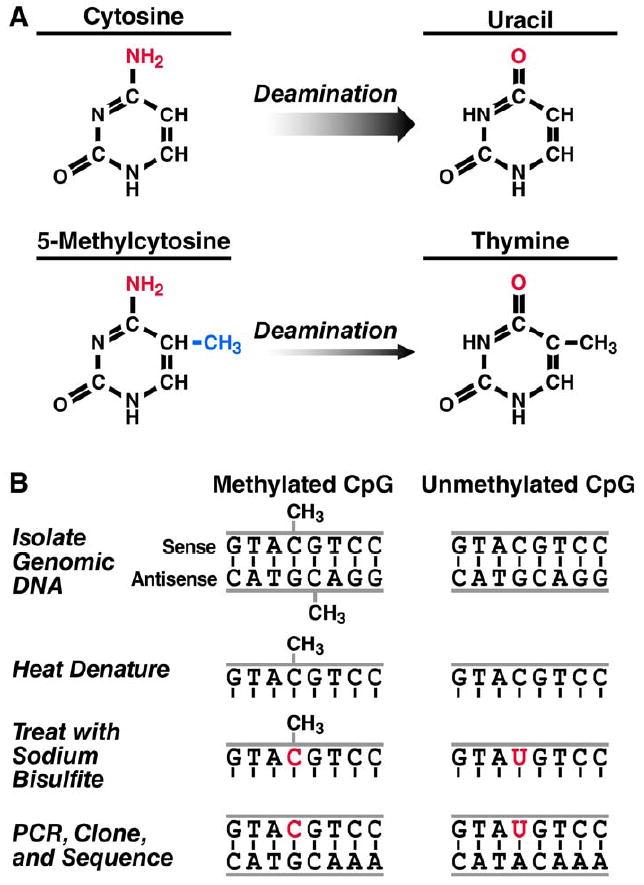
A) Deamination of cytosine and its derivative, methylcytosine. Sodium bisulfite deaminates cytosine to uracil (upper row) and methylcytosine to thymine (lower row). The rate of methylcytosine deamination is two orders of magnitude less than that of cytosine. B) Explanation of the mapping protocol. In otherwise identical sequences, a CpG might be methylated (left column) or unmethylated (right column). After genomic DNA is isolated and denatured, sodium bisulfite deaminates the unmethylated cytosine to uracil. Because methylcytosine is deaminated at a slower rate, it remains cytosine. During PCR amplification, the uracil deamination product templates adenine, which then templates thymine, resulting in a cytosine to thymine transversion at unmethylated cytosines. Upon cloning and determination of nucleotide sequence, methylcytosines can be identified as the bases that remained cytosines after bisulfite treatment.
4.2 Sodium bisulfite conversion of DNA
Near-complete denaturation of the DNA is essential for efficient cytosine deamination by sodium bisulfite. To facilitate this, genomic DNA is cleaved into smaller, more readily denatured fragments by digestion of 4 micrograms of DNA with 20 to 60 units of restriction enzyme in a volume of 100 microliters. Importantly, the restriction enzyme must not cut within the region of interest. Allow the digest to proceed overnight, and verify digestion by running 200 nanograms on a gel alongside an equivalent amount of undigested DNA.
Make fresh sodium bisulfite solution. Dissolve 40.5 grams sodium bisulfite in 80 ml water. Sodium bisulfite oxidizes easily, so stir slowly without aerating the solution. Adjust the pH to 5.1 by adding fresh 10 M sodium hydroxide. Add 3.3 ml freshly prepared 20 mM hydroquinone. Hydroquinone is a free radical scavenger that prevents depurination of the DNA, damage that would hinder DNA amplification by PCR. Adjust the volume to 100 ml, and protect from light.
Purify the restriction-digested DNA using Qiagen’s PCR cleanup kit and elute in a volume of 50 microliters [68]. Take 40 microliters of DNA and denature by heating to 97° C for five minutes. Remove from heat and quickly transfer to ice for at least one minute. The quick change in temperature will help prevent DNA renaturation. Add 2 microliters 6.3 M sodium hydroxide, diluted from the fresh 10 M stock. Incubate for 30 minutes at 39° C in temperature block.
In a water bath, prewarm sodium bisulfite solution to 55° C. Without letting the DNA cool too much, remove from the temperature block, spin to collect condensation on top of the tube, and add 416 microliters sodium bisulfite solution. Mix, centrifuge to collect, and overlay with several drops of mineral oil to prevent evaporation. Incubate at 55° C for 16 hours.
4.3 Recovery of bisulfite converted DNA
The next day, desalt the DNA using Qiagen’s PCR clean up kit and elute with 50 microliters of buffer. Measure the exact volume of eluted DNA and add 6.3 M sodium hydroxide made the previous day to bring the final sodium hydroxide concentration to 0.3 M. Incubate for 15 minutes at 37° C. Precipitate DNA by adding 10 M ammonium acetate to a final concentration of 3 M, 2 microliters of 20 mg/ml glycogen, and three volumes 100% ethanol. Incubate mixture 30 minutes at -20° C or 10 minutes at -80° C. Pellet DNA by centrifugation for 15 minutes at 20,000 × g in a 4° C centrifuge, wash once in 1 ml 70% ethanol, and pellet by centrifugation for 5 minutes at 20,000 × g in a 4° C centrifuge. Resuspend pellet in 100 microliters TE buffer.
4.4 Amplification and cloning of converted DNA
After treatment with sodium bisulfite, DNA is amplified by PCR and cloned into a vector encoding universal primers for sequence determination. Because DNA damage occurs during sodium bisulfite treatment, the DNA should be analyzed within 1 week. Additionally, nested PCR is useful to increase the efficiency of amplification. This consists of two sequential, separate PCR reactions in which the primer pair for the second reaction anneals within the product of the first reaction. Design primers that are complementary to the sodium bisulfite-converted version of the DNA but do not possess CpG dinucleotides, because the sequence of these will depend upon methylation status. Primer design should also take into account that after DNA is denatured and treated with sodium bisulfite, the two strands will no longer be complementary. Online tools such as MethPrimer can be used to design optimal primers that have a melting temperature of approximately 60° C and lack self-complimentarity [51]. The size of the intended PCR product should be taken into consideration, as products with sizes larger than 1 kb may be produced less efficiently. Lastly, add recognition sequences for a common restriction enzyme at the 5’ ends of the second, inner set of PCR primers to facilitate cloning of product into a plasmid vector.
In the first PCR reaction, amplify the region of interest using 2-6 microliters of sodium bisulfite-converted DNA and 100 micromolar concentrations of the outer PCR primers. To minimize background bands associated with PCR amplification of genomic sequences, use a two-step amplification program such as the following: 1×(95° C – 5 minutes), 25×-35×(95° C - 30 seconds, 60° C - 1 minute), 1×(60° C – 7 minutes). To increase specificity, do not add samples to the thermal cycler block until it has reached 95° C. To reduce the probability that any individual PCR product comes to dominate the output, perform the reaction at least in triplicate and pool the results. Next, perform the second PCR in triplicate using the same conditions, with 2-6 microliters of the pooled product as template and the inner primers. At this point a robust product should be visible on an ethidum bromide-stained agarose gel. Pool, gel-purify, and cleave the PCR products with the appropriate restriction enzymes, then clone them into a plasmid vector such as pBluescript for sequence determination [69].
4.5 Analysis of methylation
The detection of cytosine methylation varies from experiment to experiment; therefore determine the nucleotide sequence of at least nine cloned PCR products. Each cytosine in the nucleotide sequence of bisulfite-converted DNA indicates the position of a methylcytosine. This should be found mostly within CpGs. Unmethylated cytosines will be read as thymines, because PCR amplification inserts thymines in place of the uracil bases produced by sodium bisulfite. Untreated DNA must also be cloned and sequenced for two important controls. First, determine the efficiency of sodium bisulfite conversion by comparing the nucleotide sequences of unconverted and converted DNA. Cytosines that are not in the context of a CpG (CpA, CpT, and CpC) are rarely methylated, and greater than 99% of them should be converted to thymine in a typical experiment. The conversion efficiency can be calculated using online comparison tools such as the QUantification tool for Methylation Analysis (QUMA) [70]. Second, identify the positions of unmethylated CpGs by comparing the bisulfite-converted DNA sequence to that of untreated DNA. A TpG in bisulfite-converted DNA could be an unmethylated CpG or could be a true TpG. Verifying it to have originally been a CpG will confirm the existence of an unmethylated cytosine at this position.
4.6 Bisulfite-mediated methylcytosine mapping of the HIV-1, HXB2, provirus
Computational analysis of the HIV-1 infectious molecular clone, HXB2, reveals four CpGIs within its genome. Using bisulfite-mediated methylcytosine mapping we have characterized the differential methylation pattern of these four CpGIs within J-Lat clones (Figure 4) in response to treatment with aza-CdR. The 5’ CpGI and NCR CpGI, as previously stated, are hypermethylated before treatment but become hypomethylated after treatment with aza-CdR. These two CpGIs flank the promoter region of HIV-1 and their methylation status plays an important role in transcriptional activation [28, 29]. Interestingly, the ETR CpGI shows no response to aza-CdR treatment, as it remains in a hypermethylated state. No biological function has been attributed to this CpGI. Lastly, the 3’ LTR, in contrast to the 5’ LTR, is found in a hypomethylated state before and after aza-CdR treatment. This is in agreement with the only other study looking at the methylation status of the 3’ LTR in a latently infected cell line [37]. As with the ETR CpGI, no biological function has been attributed to the 3’ LTR CpGI.
Figure 4. Methylation of CpGIs within J-Lat model of latency.
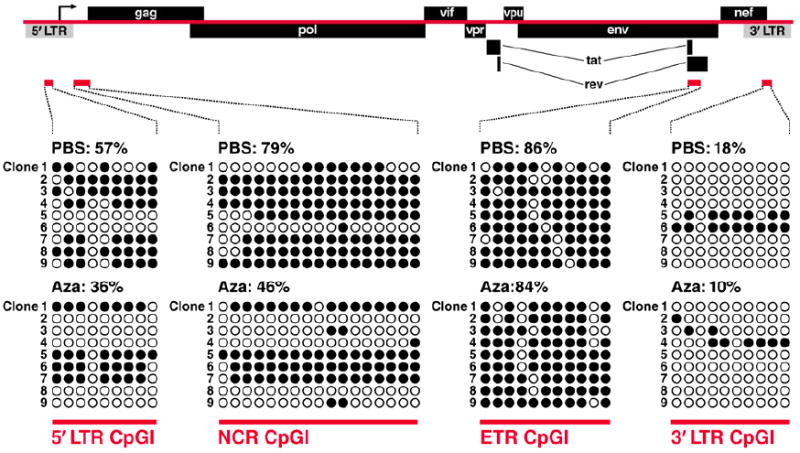
Bisulfite-mediated methylcytosine mapping of HIV-1, HXB2 was performed in J-Lat clone 6.3 cells. J-Lat cells were treated with PBS (left panel) or aza-CdR (right) for 30hrs. Genomic DNA was isolated and bisulfite-mediated methylcytosine mapping was performed for the CpGIs indicated (red bars). Open-circles indicate unmethylated CpGs within each CpGI, while closed-circles indicate methylated CpGs (mCpG). A minimum of 9 clones were analyzed for each CpGI. Each row represents the sequence of each individual clone, and each column represents the individual CpGs within that sequence. Results are representative of at least 3 independent experiments. (results of 5’LTR CpGI & NCR CpGI taken from [29]; results of ETR CpGI and 3’LTR CpGI taken from Chávez PhD Thesis work)
5. Concluding remarks
Here, we have presented a method for studying the differential methylation status of CpGIs within the HIV-1 genome during latency and productive infection. The identification of CpGIs within the HIV-1 genome can be accomplished using computational analysis based on algorithms that take into account the criteria of a CpGI. As we have seen with HIV-1, this criteria is somewhat flexible, as the CpGIs within the HIV-1 genome are only slightly larger than 100bp. Their function as CpGIs is demonstrated, however, by the differential methylation pattern exhibited by the two promoter-region CpGIs during productive infection and latent infection. The methylation pattern of all the CpGIs within the HIV-1 genome can be studied using in vitro models of HIV-1 latency. These models have been instrumental in identifying factors, both methylation-dependent and methylation-independent, involved in controlling HIV-1 latency. With regards to CpG methylation, these models can be coupled with bisulfite-mediated methylcytosine mapping to examine the methylation status during productive and latent infection. While there do exist other methods of examining the methylation status of CpGIs within a genome, bisulfite-mediated methylcytosine mapping produces high resolution results of individual CpGs that cannot be matched by other methods.
The study of CpG methylation within the HIV-1 genome is important for our understanding of HIV-1 latency. HIV-1 encodes two CpGIs that surround the 5’ LTR promoter region, and the methylation of these CpGIs is correlated with latent infection. The HIV-1 genome also contains three other CpGIs, two in the env gene and one in the 3’ LTR. The significance of these three CpGIs is still unknown. The two CpGIs within the env gene are considered to be intragenic CpGIs. Intragenic CpGIs, or CpGIs found within gene bodies, are a common occurrence, yet the biological significance of such CpGIs is unclear. The Costello lab has recently discovered that intragenic CpGIs may regulate intragenic promoter regions as shown in the gene, SH3 and multiple ankyrin repeat domains 3 (SHANK3) {personal communication}. In this regard, the two env gene CpGIs within HIV-1 are located near the purported promoter region of the computationally predicted ASORF, although no promoter in this region has ever been experimentally verified [53]. In fact, experimental evidence has suggested that an antisense promoter may exist in the 3’ LTR near the 3’ LTR CpGI [71-73]. Still, no conclusive evidence has emerged to verify the existence or biological significance of such a promoter. Further investigation is required to determine the biological significance of these highly conserved CpGIs.
Acknowledgments
LC is supported by NIGMS-IMSD R25-GM56847
Footnotes
Publisher's Disclaimer: This is a PDF file of an unedited manuscript that has been accepted for publication. As a service to our customers we are providing this early version of the manuscript. The manuscript will undergo copyediting, typesetting, and review of the resulting proof before it is published in its final citable form. Please note that during the production process errors may be discovered which could affect the content, and all legal disclaimers that apply to the journal pertain.
Contributor Information
Leonard Chávez, Email: leonard.chavez@ucsf.edu.
Steven Kauder, Email: skauder@gladstone.ucsf.edu.
References
- 1.Attwood JT, Yung RL, Richardson BC. Cell Mol Life Sci. 2002;59:241–57. doi: 10.1007/s00018-002-8420-z. [DOI] [PMC free article] [PubMed] [Google Scholar]
- 2.Wade PA. Bioessays. 2001;23:1131–7. doi: 10.1002/bies.10008. [DOI] [PubMed] [Google Scholar]
- 3.Bird AP. Nucleic Acids Res. 1980;8:1499–504. doi: 10.1093/nar/8.7.1499. [DOI] [PMC free article] [PubMed] [Google Scholar]
- 4.Burge C, Campbell AM, Karlin S. Proc Natl Acad Sci U S A. 1992;89:1358–62. doi: 10.1073/pnas.89.4.1358. [DOI] [PMC free article] [PubMed] [Google Scholar]
- 5.Schorderet DF, Gartler SM. Proc Natl Acad Sci U S A. 1992;89:957–61. doi: 10.1073/pnas.89.3.957. [DOI] [PMC free article] [PubMed] [Google Scholar]
- 6.Su J, Zhang Y, Lv J, Liu H, Tang X, Wang F, Qi Y, Feng Y, Li X. Nucleic Acids Res. 2009 doi: 10.1093/nar/gkp882. [DOI] [PMC free article] [PubMed] [Google Scholar]
- 7.Kass SU, Landsberger N, Wolffe AP. Curr Biol. 1997;7:157–65. doi: 10.1016/s0960-9822(97)70086-1. [DOI] [PubMed] [Google Scholar]
- 8.Siegfried Z, Eden S, Mendelsohn M, Feng X, Tsuberi BZ, Cedar H. Nat Genet. 1999;22:203–6. doi: 10.1038/9727. [DOI] [PubMed] [Google Scholar]
- 9.Watt F, Molloy PL. Genes Dev. 1988;2:1136–43. doi: 10.1101/gad.2.9.1136. [DOI] [PubMed] [Google Scholar]
- 10.Bird AP, Wolffe AP. Cell. 1999;99:451–4. doi: 10.1016/s0092-8674(00)81532-9. [DOI] [PubMed] [Google Scholar]
- 11.Boyes J, Bird A. Cell. 1991;64:1123–34. doi: 10.1016/0092-8674(91)90267-3. [DOI] [PubMed] [Google Scholar]
- 12.Hendrich B, Bird A. Mol Cell Biol. 1998;18:6538–47. doi: 10.1128/mcb.18.11.6538. [DOI] [PMC free article] [PubMed] [Google Scholar]
- 13.Jones PL, Veenstra GJ, Wade PA, Vermaak D, Kass SU, Landsberger N, Strouboulis J, Wolffe AP. Nat Genet. 1998;19:187–91. doi: 10.1038/561. [DOI] [PubMed] [Google Scholar]
- 14.Nan X, Ng HH, Johnson CA, Laherty CD, Turner BM, Eisenman RN, Bird A. Nature. 1998;393:386–9. doi: 10.1038/30764. [DOI] [PubMed] [Google Scholar]
- 15.Ng HH, Zhang Y, Hendrich B, Johnson CA, Turner BM, Erdjument-Bromage H, Tempst P, Reinberg D, Bird A. Nat Genet. 1999;23:58–61. doi: 10.1038/12659. [DOI] [PubMed] [Google Scholar]
- 16.Sarraf SA, Stancheva I. Mol Cell. 2004;15:595–605. doi: 10.1016/j.molcel.2004.06.043. [DOI] [PubMed] [Google Scholar]
- 17.Wade PA, Gegonne A, Jones PL, Ballestar E, Aubry F, Wolffe AP. Nat Genet. 1999;23:62–6. doi: 10.1038/12664. [DOI] [PubMed] [Google Scholar]
- 18.Zhang Y, Ng HH, Erdjument-Bromage H, Tempst P, Bird A, Reinberg D. Genes Dev. 1999;13:1924–35. doi: 10.1101/gad.13.15.1924. [DOI] [PMC free article] [PubMed] [Google Scholar]
- 19.Harbers K, Schnieke A, Stuhlmann H, Jahner D, Jaenisch R. Proc Natl Acad Sci U S A. 1981;78:7609–13. doi: 10.1073/pnas.78.12.7609. [DOI] [PMC free article] [PubMed] [Google Scholar]
- 20.Hejnar J, Hajkova P, Plachy J, Elleder D, Stepanets V, Svoboda J. Proc Natl Acad Sci U S A. 2001;98:565–9. doi: 10.1073/pnas.98.2.565. [DOI] [PMC free article] [PubMed] [Google Scholar]
- 21.Hejnar J, Plachy J, Geryk J, Machon O, Trejbalova K, Guntaka RV, Svoboda J. Virology. 1999;255:171–81. doi: 10.1006/viro.1998.9597. [DOI] [PubMed] [Google Scholar]
- 22.Koiwa T, Hamano-Usami A, Ishida T, Okayama A, Yamaguchi K, Kamihira S, Watanabe T. J Virol. 2002;76:9389–97. doi: 10.1128/JVI.76.18.9389-9397.2002. [DOI] [PMC free article] [PubMed] [Google Scholar]
- 23.Lavie L, Kitova M, Maldener E, Meese E, Mayer J. J Virol. 2005;79:876–83. doi: 10.1128/JVI.79.2.876-883.2005. [DOI] [PMC free article] [PubMed] [Google Scholar]
- 24.Matouskova M, Blazkova J, Pajer P, Pavlicek A, Hejnar J. Exp Cell Res. 2006;312:1011–20. doi: 10.1016/j.yexcr.2005.12.010. [DOI] [PubMed] [Google Scholar]
- 25.Niwa O, Sugahara T. Proc Natl Acad Sci U S A. 1981;78:6290–4. doi: 10.1073/pnas.78.10.6290. [DOI] [PMC free article] [PubMed] [Google Scholar]
- 26.Robbins PB, Skelton DC, Yu XJ, Halene S, Leonard EH, Kohn DB. Proc Natl Acad Sci U S A. 1998;95:10182–7. doi: 10.1073/pnas.95.17.10182. [DOI] [PMC free article] [PubMed] [Google Scholar]
- 27.Taniguchi Y, Nosaka K, Yasunaga J, Maeda M, Mueller N, Okayama A, Matsuoka M. Retrovirology. 2005;2:64. doi: 10.1186/1742-4690-2-64. [DOI] [PMC free article] [PubMed] [Google Scholar]
- 28.Blazkova J, Trejbalova K, Gondois-Rey F, Halfon P, Philibert P, Guiguen A, Verdin E, Olive D, Van Lint C, Hejnar J, Hirsch I. PLoS Pathog. 2009;5:e1000554. doi: 10.1371/journal.ppat.1000554. [DOI] [PMC free article] [PubMed] [Google Scholar]
- 29.Kauder SE, Bosque A, Lindqvist A, Planelles V, Verdin E. PLoS Pathog. 2009;5:e1000495. doi: 10.1371/journal.ppat.1000495. [DOI] [PMC free article] [PubMed] [Google Scholar]
- 30.Palella FJ, Jr, Delaney KM, Moorman AC, Loveless MO, Fuhrer J, Satten GA, Aschman DJ, Holmberg SD. N Engl J Med. 1998;338:853–60. doi: 10.1056/NEJM199803263381301. [DOI] [PubMed] [Google Scholar]
- 31.Chun TW, Carruth L, Finzi D, Shen X, DiGiuseppe JA, Taylor H, Hermankova M, Chadwick K, Margolick J, Quinn TC, Kuo YH, Brookmeyer R, Zeiger MA, Barditch-Crovo P, Siliciano RF. Nature. 1997;387:183–8. doi: 10.1038/387183a0. [DOI] [PubMed] [Google Scholar]
- 32.Chun TW, Stuyver L, Mizell SB, Ehler LA, Mican JA, Baseler M, Lloyd AL, Nowak MA, Fauci AS. Proc Natl Acad Sci U S A. 1997;94:13193–7. doi: 10.1073/pnas.94.24.13193. [DOI] [PMC free article] [PubMed] [Google Scholar]
- 33.Finzi D, Hermankova M, Pierson T, Carruth LM, Buck C, Chaisson RE, Quinn TC, Chadwick K, Margolick J, Brookmeyer R, Gallant J, Markowitz M, Ho DD, Richman DD, Siliciano RF. Science. 1997;278:1295–300. doi: 10.1126/science.278.5341.1295. [DOI] [PubMed] [Google Scholar]
- 34.Wong JK, Hezareh M, Gunthard HF, Havlir DV, Ignacio CC, Spina CA, Richman DD. Science. 1997;278:1291–5. doi: 10.1126/science.278.5341.1291. [DOI] [PubMed] [Google Scholar]
- 35.Bednarik DP, Cook JA, Pitha PM. Embo J. 1990;9:1157–64. doi: 10.1002/j.1460-2075.1990.tb08222.x. [DOI] [PMC free article] [PubMed] [Google Scholar]
- 36.Schulze-Forster K, Gotz F, Wagner H, Kroger H, Simon D. Biochem Biophys Res Commun. 1990;168:141–7. doi: 10.1016/0006-291x(90)91685-l. [DOI] [PubMed] [Google Scholar]
- 37.Ishida T, Hamano A, Koiwa T, Watanabe T. Retrovirology. 2006;3:69. doi: 10.1186/1742-4690-3-69. [DOI] [PMC free article] [PubMed] [Google Scholar]
- 38.Singh MK, Pauza CD. Virology. 1992;188:451–8. doi: 10.1016/0042-6822(92)90498-e. [DOI] [PubMed] [Google Scholar]
- 39.Gardiner-Garden M, Frommer M. J Mol Biol. 1987;196:261–82. doi: 10.1016/0022-2836(87)90689-9. [DOI] [PubMed] [Google Scholar]
- 40.Antequera F, Bird A. Proc Natl Acad Sci U S A. 1993;90:11995–9. doi: 10.1073/pnas.90.24.11995. [DOI] [PMC free article] [PubMed] [Google Scholar]
- 41.Caiafa P, Zampieri M. J Cell Biochem. 2005;94:257–65. doi: 10.1002/jcb.20325. [DOI] [PubMed] [Google Scholar]
- 42.McClelland M, Ivarie R. Nucleic Acids Res. 1982;10:7865–77. doi: 10.1093/nar/10.23.7865. [DOI] [PMC free article] [PubMed] [Google Scholar]
- 43.Sponer J, Gabb HA, Leszczynski J, Hobza P. Biophys J. 1997;73:76–87. doi: 10.1016/S0006-3495(97)78049-4. [DOI] [PMC free article] [PubMed] [Google Scholar]
- 44.Bachmann MF, Kopf M. J Exp Med. 2001;193:F47–50. doi: 10.1084/jem.193.12.f47. [DOI] [PMC free article] [PubMed] [Google Scholar]
- 45.Janeway CA, Jr, Medzhitov R. Annu Rev Immunol. 2002;20:197–216. doi: 10.1146/annurev.immunol.20.083001.084359. [DOI] [PubMed] [Google Scholar]
- 46.Krieg AM. Nat Immunol. 2002;3:423–4. doi: 10.1038/ni0502-423. [DOI] [PubMed] [Google Scholar]
- 47.Singal R, Ginder GD. Blood. 1999;93:4059–70. [PubMed] [Google Scholar]
- 48.Fryxell KJ, Zuckerkandl E. Mol Biol Evol. 2000;17:1371–83. doi: 10.1093/oxfordjournals.molbev.a026420. [DOI] [PubMed] [Google Scholar]
- 49.Sved J, Bird A. Proc Natl Acad Sci U S A. 1990;87:4692–6. doi: 10.1073/pnas.87.12.4692. [DOI] [PMC free article] [PubMed] [Google Scholar]
- 50.http://www.ebi.ac.uk/Tools/emboss/cpgplot/index.html
- 51.Li LC, Dahiya R. Bioinformatics. 2002;18:1427–31. doi: 10.1093/bioinformatics/18.11.1427. [DOI] [PubMed] [Google Scholar]
- 52.http://www.hiv.lanl.gov/
- 53.Miller RH. Science. 1988;239:1420–2. doi: 10.1126/science.3347840. [DOI] [PubMed] [Google Scholar]
- 54.Jordan A, Bisgrove D, Verdin E. Embo J. 2003;22:1868–77. doi: 10.1093/emboj/cdg188. [DOI] [PMC free article] [PubMed] [Google Scholar]
- 55.Bieniasz PD, Cullen BR. J Virol. 2000;74:9868–77. doi: 10.1128/jvi.74.21.9868-9877.2000. [DOI] [PMC free article] [PubMed] [Google Scholar]
- 56.Bosque A, Planelles V. Blood. 2009;113:58–65. doi: 10.1182/blood-2008-07-168393. [DOI] [PMC free article] [PubMed] [Google Scholar]
- 57.Messi M, Giacchetto I, Nagata K, Lanzavecchia A, Natoli G, Sallusto F. Nat Immunol. 2003;4:78–86. doi: 10.1038/ni872. [DOI] [PubMed] [Google Scholar]
- 58.Rivino L, Messi M, Jarrossay D, Lanzavecchia A, Sallusto F, Geginat J. J Exp Med. 2004;200:725–35. doi: 10.1084/jem.20040774. [DOI] [PMC free article] [PubMed] [Google Scholar]
- 59.Chomont N, El-Far M, Ancuta P, Trautmann L, Procopio FA, Yassine-Diab B, Boucher G, Boulassel MR, Ghattas G, Brenchley JM, Schacker TW, Hill BJ, Douek DC, Routy JP, Haddad EK, Sekaly RP. Nat Med. 2009;15:893–900. doi: 10.1038/nm.1972. [DOI] [PMC free article] [PubMed] [Google Scholar]
- 60.Andersen JL, DeHart JL, Zimmerman ES, Ardon O, Kim B, Jacquot G, Benichou S, Planelles V. PLoS Pathog. 2006;2:e127. doi: 10.1371/journal.ppat.0020127. [DOI] [PMC free article] [PubMed] [Google Scholar]
- 61.Frommer M, McDonald LE, Millar DS, Collis CM, Watt F, Grigg GW, Molloy PL, Paul CL. Proc Natl Acad Sci U S A. 1992;89:1827–31. doi: 10.1073/pnas.89.5.1827. [DOI] [PMC free article] [PubMed] [Google Scholar]
- 62.Hayatsu H, Wataya Y, Kai K, Iida S. Biochemistry. 1970;9:2858–65. doi: 10.1021/bi00816a016. [DOI] [PubMed] [Google Scholar]
- 63.Shapiro R, Braverman B, Louis JB, Servis RE. J Biol Chem. 1973;248:4060–4. [PubMed] [Google Scholar]
- 64.Shapiro R, Servis RE, Welcher M. J Am Chem Soc. 1970;92:422–24. [Google Scholar]
- 65.Wang RY, Gehrke CW, Ehrlich M. Nucleic Acids Res. 1980;8:4777–90. doi: 10.1093/nar/8.20.4777. [DOI] [PMC free article] [PubMed] [Google Scholar]
- 66.Hayatsu H, Shiragami M. Biochemistry. 1979;18:632–7. doi: 10.1021/bi00571a013. [DOI] [PubMed] [Google Scholar]
- 67.http://www.biology.wustl.edu/pikaard/Protocols%20page.html
- 68.http://www1.qiagen.com/
- 69.http://www.stratagene.com/homepage/
- 70.Kumaki Y, Oda M, Okano M. Nucleic Acids Research. 2008;36:W170–75. doi: 10.1093/nar/gkn294. [DOI] [PMC free article] [PubMed] [Google Scholar]
- 71.Landry S, Halin M, Lefort S, Audet B, Vaquero C, Mesnard JM, Barbeau B. Retrovirology. 2007;4:71. doi: 10.1186/1742-4690-4-71. [DOI] [PMC free article] [PubMed] [Google Scholar]
- 72.Ludwig LB, Ambrus JL, Jr, Krawczyk KA, Sharma S, Brooks S, Hsiao CB, Schwartz SA. Retrovirology. 2006;3:80. doi: 10.1186/1742-4690-3-80. [DOI] [PMC free article] [PubMed] [Google Scholar]
- 73.Michael NL, Vahey MT, d’Arcy L, Ehrenberg PK, Mosca JD, Rappaport J, Redfield RR. J Virol. 1994;68:979–87. doi: 10.1128/jvi.68.2.979-987.1994. [DOI] [PMC free article] [PubMed] [Google Scholar]