Abstract
Sample autofluorescence (fluorescence of inherent components of tissue and fixative-induced fluorescence) is a significant problem in direct imaging of molecular processes in biological samples. A large variety of naturally occurring fluorescent components in tissue results in broad emission that overlaps the emission of typical fluorescent dyes used for tissue labeling. In addition, autofluorescence is characterized by complex fluorescence intensity decay composed of multiple components whose lifetimes range from sub-nanoseconds to a few nanoseconds. For these reasons, the real fluorescence signal of the probe is difficult to separate from the unwanted autofluorescence. Here we present a method for reducing the autofluorescence problem by utilizing an azadioxatriangulenium (ADOTA) dye with a fluorescence lifetime of approximately 15 ns, much longer than those of most of the components of autofluorescence. A probe with such a long lifetime enables us to use time-gated intensity imaging to separate the signal of the targeting dye from the autofluorescence. We have shown experimentally that by discarding photons detected within the first 20 ns of the excitation pulse, the signal-to-background ratio is improved fivefold. This time-gating eliminates over 96 % of autofluorescence. Analysis using a variable time-gate may enable quantitative determination of the bound probe without the contributions from the background.
Keywords: Fluorescence, Luminescence, Spectroscopy theory, Spectroscopy instrumentation, Bioanalytical methods
Introduction
Fluorescence from inherent components of tissue and fixative-induced fluorescence, commonly referred to collectively as “autofluorescence”, is the major source of the fluorescence background in imaging experiments involving biological samples. The fluorescence intensities and fluorescence lifetimes of endogenous fluorophores are very heterogeneous in their nature, and they greatly complicate the signal of targeted probes when imaging live cells and/or tissue and fixed specimens. The most common endogenous fluorophores, flavins and flavoproteins [1], strongly absorb in the 450–500 nm range, and their emission overlaps that of fluorescein and rhodamine dyes, the dyes most commonly used in cell and tissue imaging. The heterogeneous complexes of lipids and proteins found in brain tissue are also excitable in the 400–550 nm range, and their emission spectra (550–750 nm) are broad and overlap those of many commonly used fluorescence probes used for imaging, including green fluorescence protein (GFP) [2–4]. The relative composition of the various endogenous fluorophores depends on the cell and/or tissue type and the autofluorescence level is contingent on the cell or tissue type and their physiological status [5–7].
Many techniques for reducing unwanted autofluorescence have been developed and tested over the years. These include chemical treatment with CuSO4 in ammonium acetate buffer or with Sudan Black B in 70 % ethanol [8], NaBH4 [9], and Pontamine sky blue [10], to name a few. Numerical methods based on prerecorded autofluorescence spectra and known spectra of fluorophores have also been tried in an attempt to numerically subtract the background fluorescence [11, 12]. All of these techniques have significant disadvantages. Treatment with chemicals may reduce the intensity of autofluorescence but it also affects the immunofluorescent labeling, which thus requires a compromise to be made between autofluorescence reduction and antigen visualization. The numerical methods, for example differential fluorescence correction or spectral unmixing are severely obstructed by the significant variability of biological samples, which frequently makes these approaches susceptible to false results. Only when the autofluorescence is dominated by a fluorophore (probe) signal can these methods be successfully and easily used. Unfortunately this happens rarely, especially with live or fixed tissue. Also, one must collect a full emission spectrum at every image point, which makes these approaches impractical for typical laser-scanning microscopes.
The total observed intensity for immunofluorescence-labeled cells is a product of signal contributions from the probe and the intrinsic fluorescence of cellular components, and the latter can often be quite significant, especially when tissue imaging is involved. One very successful approach to solving this problem is to use pulsed excitation and time-resolved detection in combination with luminescent probes with comparatively long emission lifetimes. By a process called time-gating, the signal originating from the long-lived probe can be separated from the relatively short lived background fluorescence [13–15]. If we consider the case where excitation is provided by a pulsed laser source, the emission intensity contribution from autofluorescence decreases very quickly with time after each laser pulse. The time-gating technique involves observation of the sample only after a fixed delay time relative to the excitation pulse. For example, consider the case where the intensity of a probe (fluorescence lifetime 20 ns) is equal to the background (average fluorescence lifetime 4 ns), as measured without any time gating; they have identical steady-state intensity. When detection is delayed (gated) until 10 ns after the excitation pulse, the probe signal becomes seven times higher than the remaining signal of the background. Importantly the loss of overall probe intensity is less than 40 %.
A long-lived fluorescence probe is necessary to ensure that the desired fluorescence can be observed after the autofluorescence has died out. Jin and Piper [16] recently used lanthanide-based luminescence probes with very long emission lifetimes of the order of micro–milliseconds to practically eliminate the background of cellular components. However, such a long lifetime limits the photon flux from the probe, which makes detection very difficult for small confocal volumes or at very low sample and/or probe concentrations. For confocal imaging and single-molecule imaging, the emission lifetimes of fluorescent probes must be limited to 100 ns or less to achieve adequate photon flux and sample brightness. Fortunately, fluorescent probes that have fluorescence lifetimes of approximately 20 ns are still 3–10 times longer-lived than typical autofluorescence background, and thus they can be successfully used with gated detection for background suppression in fast confocal imaging. Recently, we have been working with triangulenium dyes with emission in the red [17–19]. The long-wavelength emission enables much of the autofluorescence to be filtered out spectrally. In addition these dyes also have moderately long (~15 ns) fluorescence lifetimes in biological samples.
The parent compound of the triangulenium dyes is trioxatriangulene (TOTA+), first prepared by Martin and Smith in 1964 [20]. The triangulenium dyes were more recently expanded by addition of the aza/oxa triangulenes: azadioxatriangulene (ADOTA+) and diazaoxatriangulene (DAOTA +) together with the aza analogue of TOTA+: triazatriangulene (TATA+) [21, 22]. The triangulenium dyes all have similar photophysical properties, but the nitrogen-containing analogues have increased oscillator strengths, because of the greater donor strength of nitrogen compared with oxygen [23, 24]. It was recently found that improving the rigidity of the system can increase the quantum yield significantly [25]. Because of their versatile synthesis, these dyes can easily be activated and utilized for cell or tissue labeling, with fluorescence lifetimes much longer than the fluorescence lifetimes of autofluorescence.
Because the fluorescence lifetimes of these new dyes are a few times longer than the fluorescence lifetimes of typical background sources, their emission can be efficiently separated simply by starting detection a few nanoseconds after the excitation pulse. For example, if we assume a 3 ns lifetime for the fluorescence background, then delaying the photon collection by 10 ns after the excitation pulse reduces the intensity of background almost 30-fold. The intensity of the probe is reduced also, but the long lifetime of the triangulenium dyes ensures that the probe intensity is reduced to a much lesser extent. Assuming a 15 ns lifetime, as found for the ADOTA dye used in this study, the probe intensity is only reduced by half when using time-gating of 10 ns. Such long-lived dyes lead to new strategies for drastic suppression of the background level by using time-gated detection [26]. In contrast with lanthanide probes, fluorophores with fluorescence lifetimes shorter than 30 ns have the photon flux necessary for commonly available time-correlated single-photon counting (TCSPC)-based detection systems.
In this paper we describe the first use of the azadioxatriangulenium (ADOTA) fluorophore conjugated to IgG in imaging rodent retinal ganglion cells (RGCs). We chose RGC for this purpose because they are the central nervous system neurons responsible for conveying visual information from the eye to proper targets in the brain. Extensive RGC death, optic nerve cupping, and degeneration are characteristic of glaucoma, a neurodegenerative disease responsible for blindness in approximately 4.5 million people worldwide, according to the WHO [27]. Currently, the loss of vision caused by glaucoma is irreversible and progressive despite anti-occular hypertensive therapy. We used standard imaging microscopy equipped with TCSPC capability, and present simple methods for image analysis that dramatically suppress unwanted fluorescence of the background, enabling quantitative sample analysis which would otherwise be impossible. We must stress that these methods are not limited to RGCs. These methods can be applied to any sample in which the autofluorescence decays significantly faster than the probe, and thus the 20 ns lifetime of ADOTA makes this method applicable to most biological samples.
Materials and methods
Preparation of the active ester of the AzaDiOxaTriAngulenium (ADOTA-NHS) fluorophore
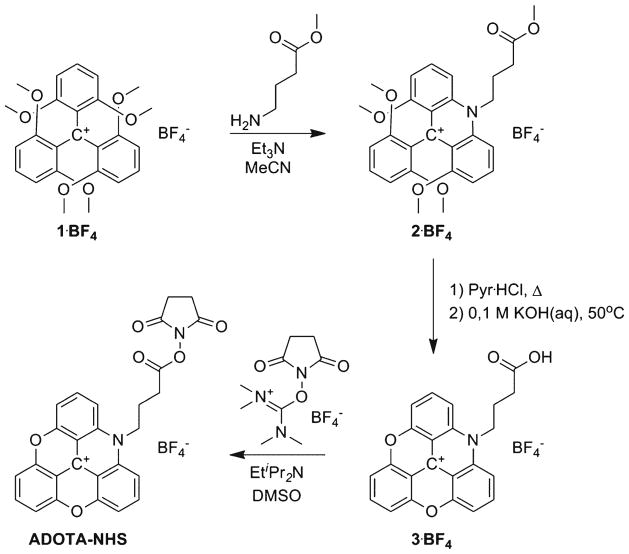
Synthesis of ADOTA-NHS is shown in Fig. 1. The starting material 1 was prepared as described by Martin and Smith [20].
Fig. 1.
Synthesis of ADOTA
N-(ω-(Methyl butanoate)-1,8,2′,6′-tetramethoxy-9-phenylacridinium tetrafluoroborate (2)
DMB3C·BF4 (1, 1 eq), 1.2 eq amino, and 1.5 eq triethylamine were dissolved in 5 mL MeCN per gram starting material. After 30 min the reaction was investigated by MALDI-TOF. After the reaction had run to completion, 600 mL 0.2 molL−1 NaBF4 (aq) was added to the solution. After 12 h the product was collected by filtration. The crude product was recrystallized from MeOH ~10 mL per gram starting material. Typical yields 73–91 %. 1H NMR (CDCl): δ 8.23 (m, 4H), 7.38 (t, J = 7.5 Hz, 1H), 6.98 (d, J = 7.5 Hz, 2H), 6.67 (t, J = 10 Hz, 2H), 5.30 (m, 2H), 3.03 (s, 3H), 3.55 (bs, 12H, convoluted with H2O signal), 2.98 (m, 2H), 2.50 (m, 2H). 13C NMR (CDCl): δ 174.6, 160.8, 157.5, 141.9, 140.7, (central charged carbon missing), 126.6, 120.0, 119.8, 109.8, 106.5, 103.6, 57.0, 56.2, 56.1, 52.2, 52.2, 51.7, 30.0, 22.9 MALDI-TOF MS: m/z = 476.3. High-resolution ESI TOF MS: calculated for C28H30NO6+: m/z = 476.2069; found: m/z = 476.2098 (6.1 ppm).
N-(ω-Butanoic acid)-azadioxatriangulenium tetrafluoroborate (3)
Pyridinium hydrochloride (20 g) was melted at 200 °C, 2 (1 g, 1.8 mmol) was added, and the reaction was heated to the point where the pyridinium hydrochloride started to sublime. After this point the reaction was stirred for 30 min. The methyl ester intermediate was precipitated with 0.2 molL−1 NaBF4 (aq) and collected by filtration. The filtrate was washed repeatedly with water. The ester was hydrolyzed in 0.1 molL−1 KOH at 50 °C. After 12 h the pH was adjusted to <4 with 50 % HBF4 (aq) and the product (780 mg, 1.7 mmol, 94 %) collected as an orange powder by filtration. 1H NMR (DMSO-d6): δ 12.37 (bs, 1H), 8.43 (t, J = 10 Hz, 2H), 8.16 (m, 3H), 7.70 (d, J = 10 Hz, 2H), 7.63 (d, J = 10 Hz, 2H), 4.86 (m, 2H), 2.634.86 (t, J = 10 Hz, 2H), 2.08 (m, 2H). 13C NMR (DMSO-d6): δ 174.1, 152.6, 151.8, 140.8, 140.5. 140.2, 139.7, 111.5, 110.4, 109.1, 108.7, 105.5, 47.4, 30.0, 21.5. MALDI-TOF MS: m/z = 370.2. High-resolution ESI TOF MS: calculated for C23H16NO4+: m/z = 370.1077; found: m/z = 370.1105 (7.6 ppm).
N-(ω-(N′-Hydroxysuccinimde butanoate) azadioxatriangulenium tetrafluoroborate (ADOTA-NHS)
3 (100 mg, 0.22 mmol, 1 eq) was dissolved in 2 mL DMSO and 100 mg (0.33 mmol, 1.5 eq) TSTU (N,N,N′, N′-tetramethyl-O-(N-succinimidyl)uronium tetrafluoroborate) and 0.1 mL (0.074 mg, 0.57 mmol, 2.6 eq) diisopropylethylamine were added in 2 mL DMSO. The reaction was stirred under ambient conditions for 12 h. The product was precipitated with 100 mL ether and the solvent was decanted. The process was repeated three times, after which the crude product was dried. The crude product was taken up in acetonitrile 30 mL, the solution was filtered, and the compound was precipitated with 200 mL 0.2 molL−1 NaBF4 (aq). The product (50 mg, 0.09 mmol, 40 %) was collected as an orange powder by filtration. 1H NMR (DMSO-d6): δ 8.44 (t, J = 7.5 Hz, 2H), 8.21 (t, J = 10 Hz, 1H), 8.14 (d, J = 7.5 Hz, 2H), 7.73 (t, J = 7.5 Hz, 2H), 7.67 (t, J = 10 Hz, 2H), 4.91 (dd, J = 10 Hz, 2H), 3.14 (t, J = 7.5 Hz, 2H), 2.84 (s, 4H), 2.23 (m, 2H). 13C NMR (DMSO-d6): δ 170.3, 168.7, 152.7, 151.8, 140.9, 140.5, 140.2, 139.8, 111.6, 110.3, 109.2, 108.8, 105.6, 46.7, 27.1, 25.5, 21.4. High-resolution ESI TOF MS: calculated for C27H19N2O6+: m/z = 467.1243; found: m/z = 467.1240 (0.6 ppm).
Preparation of ADOTA labeled IgG
Donkey anti-rabbit IgG (αrIgG) was mixed with freshly prepared 100 mmolL−1 bicarbonate solution (0.1 mL to 0.4 mL), and to this was added a small volume of the active ester of ADOTA in DMF (less than 5 % by volume). The final concentrations were 3 μmolL−1 αrIgG and the 30 μmolL−1 ADOTA-NHS. After 18 h of gentle shaking the labeled αrIgG were freed from excess of the free dye by passing over a Sephadex G-25 desalting column (GE electric, USA).
The absorption spectra were recorded on a Cary50 Bio UV-visible double-beam spectrophotometer (Varian) and the steady-state fluorescence spectra were collected on a Cary Eclipse fluorescence spectrophotometer (Varian). The excitation wavelength was 470 nm.
Animals
All animal-related procedures were approved by the Institutional Animal Care and Use Committee (IACUC) of the UNTHSC and are in compliance with the ARVO Statement on the Use of Animals in Ophthalmic and Vision Research.
Histology, paraffin sections
Animals were sacrificed with an overdose of pentabarbitol, after which the eyes were enucleated, immersion fixed in 4 % phosphate-buffered formalin, and processed for paraffin embedding. Paraffin sagittal retina sections through the optic nerve head (5 μm thick) were cut and deparaffinized in xylene (Fisher Scientific, NJ, USA), re-hydrated by use of a descending series of ethanol washes, and processed for immunohistochemical staining.
Immunostaining procedure
The deparafinized and rehydrated retina sections were blocked with 5 % donkey serum and 5 % BSA in PBS, and then treated with primary antibody: rabbit anti-Na,K-ATPase antibody (Cell Signaling Technology, MA, USA) diluted 1:500 and incubated for 1 h at room temperature. Secondary incubation for 1 h was performed with a 1:1000 (1 μgmL−1) dilution of the secondary antibody donkey anti-rabbit IgG conjugated with ADOTA fluorophore (2.5 μg mL−1).
Fluorescence lifetime imaging (FLIM)
Time-resolved images were obtained on a confocal Micro-Time 200 (Picoquant, Germany) system. Excitation was provided by a 470-nm pulsed diode laser (PicoQuant) operating at a 10 MHz repetition rate; it was reflected off a 490 nm dichroic plate into an Olympus IX71 inverted microscope. The light passed through an Olympus 60× 1.2 NA objective and a 20×20, #1 coverslip from Menzel Glaser (Germany). The laser spot remained stationary while the sample was precisely positioned/moved with a piezoelectric stage from Physik Instrumente (Karlsruhe, Germany). After passing through the major dichroic plate, the emitted light was filtered through a 488-nm long wave pass, interference filter and then through a 30-μm confocal pinhole. An additional 600-950 IR (Shemrock) was used for lifetime measurements. The light path terminated at a hybrid photomultiplier assembly detector, also from PicoQuant. The time response of this detector, including the width of the laser pulse, was estimated to be <120 ps. The signal from the detector was routed into a PicoHarp 300 (PicoQuant) time-correlated single-photon counting (TCSPC) module which time-tagged each photon. All analysis was performed by the software SymPhoTime, v. 5.3.2 from PicoQuant.
Analysis and time-gating
After data had been collected for a particular image, all of the fluorescence data were analyzed together to determine a global lifetime from the entire region of interest. This was achieve by use of a tail-fitting routine. It was determined that images without ADOTA had a three-component decay, and the labeled tissue sections also had three-component decays (more details are given in the “Results and discussion” section). The fluorescence lifetime image (FLIM) was then constructed with the lifetime components fixed, but their amplitudes varied accordingly for each pixel. The time-gated FLIM images were obtained in the same manner, with the exception that immediately before the FLIM image was constructed, an electronic filter was applied in which photons arriving before a specified time were discarded. With this configuration, it was determined that the signal from autofluorescence had decayed to a much greater extent than the signal from ADOTA after 20 ns from the 0 ns reference point. In other words, many of the excited states in the unlabeled areas had been depopulated. The 0 ns point was adjusted so that it was located before each excitation pulse in time, and thus, in our configuration, a 20-ns time-gate actually corresponds to an 18-ns delay from the center of the excitation pulse. Thus the time-gate was set at 20 ns and all photons arriving before this point were discarded as the FLIM image was constructed, with the purpose of eliminating the two shortest lifetime components from autofluorescence.
Concept of time-gated detection
Let us consider a sample that comprises two parts with different fluorescence lifetimes, one of which we call the background, τb, and a second which we call the probe signal, τp:
where Ip0 and Ib0 are initial intensities for probe and background, respectively. The overall intensity detected when photon detection and counting has been delayed by a fixed time interval tx is as follows:
The steady-state signal intensity is proportional to a total number of photons detected after δ-pulse excitation. When measuring the signal we collect photons from the probe and from the background. For any steady-state intensity of the sample, Isss we can write:
where αp and αb are the relative fractions of probe and background, respectively, and αp + αb = 1. Figure 2 shows simulated intensities measured for the signals of the probe and the background with different time-gates, tx, changing from 0 to 30 ns. For a gate of 10 ns, the signal from the background is practically negligible whereas the signal from the probe dropped to approximately 40 % only. In comparison, the middle points (▲) represent the cumulative signal from the probe + background (αp = αb = 0.5). This represents significant contamination by autofluorescence that, typically, would prevent measurement. Interestingly the signal from the background drops very quickly, and if photon counting is started 10 ns or more after the excitation pulse the signal of the background becomes negligible.
Fig. 2.
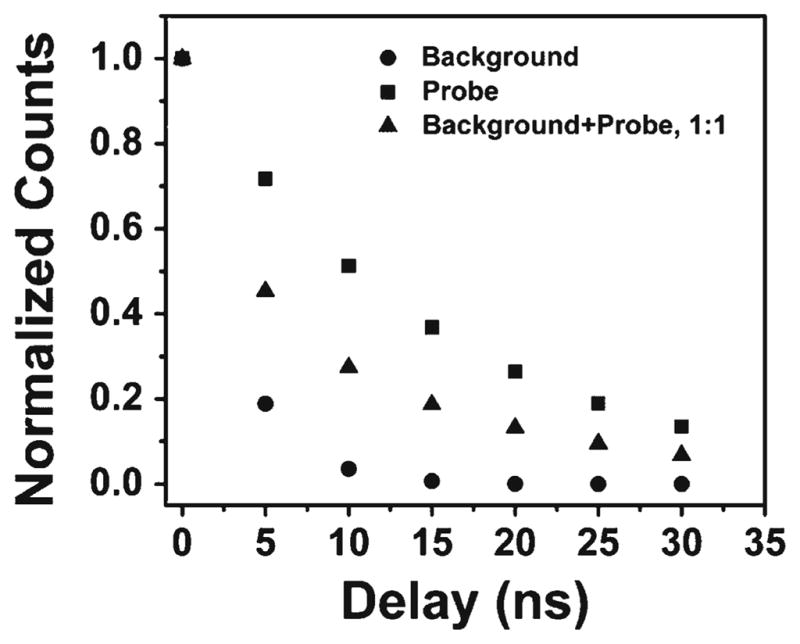
Simulated intensity as a result of time-gating. The background is assumed to have a lifetime of 3 ns, and the probe is assumed to have a lifetime of 20 ns. Intensity values calculated for the isolated background and the probe are shown as circles and squares, respectively. The intensities calculated for an equal contribution of both the background and the probe are shown as triangles. No background is seen after 10–15 ns
Results and discussion
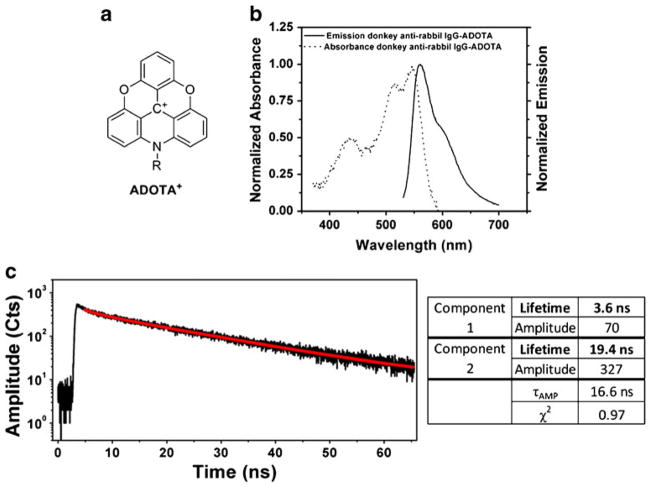
For antibody labeling we used non-symmetric long-lived triangulenium dye; ADOTA+, (Fig. 3a) synthesized as described above. We labeled rabbit anti-rat IgG by use of an active ester of ADOTA (ADOTA-NHS). Next, we measured the absorption (dotted line) and emission (solid line) spectra of IgG-ADOTA (Fig. 3c). The absorption spectrum consisted of three bands at 440 nm, 510 nm, and 550 nm. The emission spectrum of IgG-ADOTA with 470 nm excitation (Fig. 3b, solid line) has maximum emission at approximately 580 nm. We also measured the fluorescence lifetime of the ADOTA-labeled IgG with 470 nm excitation and emission using a 600 nm long-pass filter (Fig. 3c). The tail-fitting lifetime analysis revealed two emission lifetimes, a dominant 19.4 ns component and a shorter 3.6 ns component, resulting in an amplitude averaged lifetime, τAMP, of 16.6 ns (τAMP is the average lifetime of all photons detected using the amplitude averaging procedure). More information on lifetime averaging techniques is given in Ref. [28]. This set of experiments helped us to choose the conditions for the next sets of microscopy experiments. The microscope detection (imaging) of the IgG-ADOTA solution has the same lifetime composition.
Fig. 3.
Characteristics of ADOTA: (a) the chemical structure; (b) the excitation and emission spectra of the donkey anti-rabbit IgG-ADOTA used to label our cells; (c) the fluorescence decay of donkey anti-rabbit IgG-ADOTA and the corresponding fitting data
It is well established that autofluorescence overlaps substantially, both spectrally and temporally, with the fluorescence from fluorophores in common use. A fluorescence image was collected from the unlabeled retinal tissue sections of brown Norway rats from the nerve fiber layer (NFL), the ganglion cell layer (GCL), and the inner plexiform layer (IPL), as shown in Fig. 4a. The measured autofluorescence intensity is represented by a gray scale. The emission spectrum (Fig. 4b) was collected from the entire region imaged in Fig. 4a. The broad green emission band of the autofluorescence extends to 800 nm and overlaps with the fluorescence of the ADOTA dye and many of the most common dyes used in modern studies, for example fluorescein, Alexa Fluor 488, and green fluorescent proteins (GFPs). For both panels of Fig. 4, 470 nm pulsed laser diode excitation was used and emission was collected through a 488 LP filter to eliminate scattered light. In the subsequent FLIM experiments, an additional 600–800 nm bandpass filter was used to spectrally limit the autofluorescence as much as possible. Unfortunately, this spectral filtering cannot completely filter out autofluorescence, even when using a red-emitting dye such as ADOTA, see above. Therefore, typical immune-imaging experiments use a very high degree of labeling, so that the probe signal dominates the emission signal. However, high-efficiency labeling is not always possible and frequently leads to probe self-quenching or sample perturbation [29]. When tissue samples are used, this approach becomes more problematic for qualitative studies, because the contribution of autofluorescent material combined with the increased scattering compromise the contrast between the targeted areas and the background.
Fig. 4.
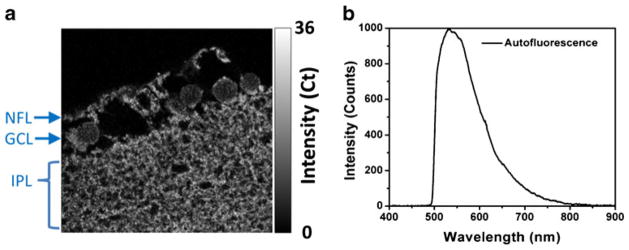
Confocal fluorescence image (a) and fluorescence spectrum (b) collected from unlabeled retinal ganglion cells. Excitation was at 470 nm with a 488 LP filter on emission, and the image is 80×80 μm. The labeled cell groups are: NFL, nerve fiber layer; GCL, ganglion cell layer; IPL, inner plexiform layer
In the studies presented, we used FLIM to reduce and/or remove the unwanted autofluorescence, revealing the ADOTA-specific signal from labeled IgG. Our method of acquiring FLIM data relies on time-correlated single photon counting (TCSCP) in which each photon detected is tagged with the time elapsed between the laser pulse and detection of each individual photon, the so-called time tagged, time-resolved mode. When a sufficient number of photons has been detected, a decay curve can be constructed, to which an exponential decay can be fitted, yielding intensity decay properties (fluorescence lifetimes) of the emission. In our FLIM experiments, this process is performed for each pixel in an array of 300×300 pixels, thus forming a FLIM image. A color gradient is applied to the image which displays the lifetime information. The total number of photons collected for each pixel is also displayed by the gray value, or brightness, of each pixel. Time-gating is applied to FLIM imaging by filtering each detected photon according to its time tag. Immediately after the laser pulse, photons will be detected from autofluorescence and from ADOTA. However, several nanoseconds after the excitation pulse, the autofluorescence will disappear, leaving only the signal from the long-lived ADOTA.
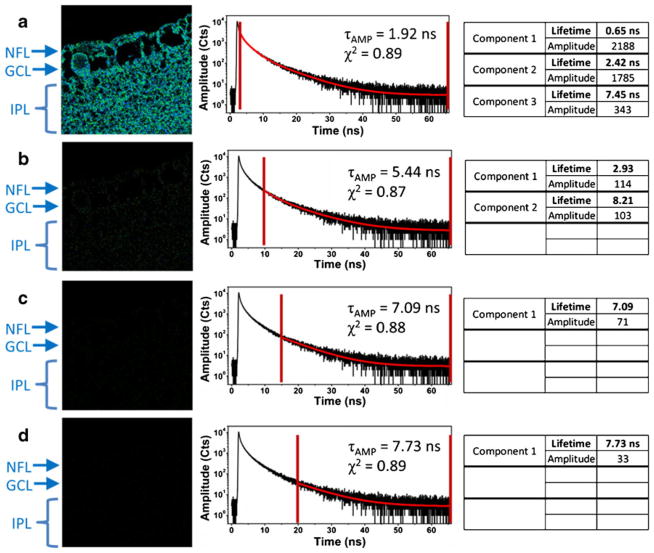
The FLIM image of tissue without any staining is shown in Fig. 5 (autofluorescence), and the image is accompanied by the decay curve constructed from photons collected over the entire image. Tail-fitting analysis shows three lifetime components with a τAMP of less than 2 ns. From this we can calculate that 90 % of the detected photons originate from emitters with fluorescence lifetimes shorter than 2.5 ns; less than 10 % of the intensity decay belongs to the longer, 7.45 ns lifetime component. Therefore, we can say that the excited states of the tissue components will be significantly depopulated after 10 ns. As a consequence, placing the time-gate at time-points delayed by more than 10 ns (starting photon analysis 10 ns after the excitation pulse) will greatly reduce or eliminate detection of autofluorescence. The FLIM images in Fig. 5a–d were constructed with time delays 2.5, 10, 15, and 20 ns, respectively. By cursory inspection it is evident that the autofluorescence signal becomes insignificant with increasing delay time; at 20 ns the autofluorescence is almost completely extinguished.
Fig. 5.
Time-gated FLIM applied to unlabeled tissue. The time-gate was varied as follows: (a) 2.5 ns (immediately after the excitation pulse), (b) 10 ns, (c) 15 ns, and (d) 20 ns. All of the data shown in this figure were obtained in one collection of data from a single, 80× 80 μm (300 pixels × 300 pixels) area of tissue. The red bars in the decay curves in the center show the range of time-resolved photons used to create the FLIM images to the left and fitting data to the right of the decay curves
Next we applied time-gated FLIM to a tissue sample stained with ADOTA-labeled IgG to detect the Na,K-ATPase channels. Na,K-ATPase is an integral membrane heterodimer belonging to the P-type ATPase family. This ion channel uses the energy derived from ATP hydrolysis to maintain membrane potential by driving sodium export and potassium import across the plasma membrane against their electrochemical gradients. It is composed of a catalytic α subunit and a β subunit [30]. Na,K-ATPase is also involved in other signal transduction pathways. For example, insulin regulates its localization in differentiated primary human skeletal muscle cells, and this regulation is dependent on extracellular-signal-regulated kinases 1/2 (ERK1/2) phosphorylation of the α subunit [31]. Na,K-ATPase and Src family kinase (Src) form a signaling receptor complex that affects regulation of Src kinase activity and, subsequently, its downstream effectors [32, 33].
Figure 6 shows that the IgG-ADOTA adds a long lifetime component, over 13 ns, to the intensity decay curve. The short components are slightly different from those of the unstained tissue, which could be the result of a small-amplitude, short-lifetime component of ADOTA or small variations in the autofluorescence and in the fitting. It is clear from Fig. 6a that the areas of concentrated ADOTA are not discernible from the autofluorescence. The fitting data show that the long-lived component (attributed to ADOTA) makes up only 6 % of the detected emission, which is not surprising, because the spectral window used for detection excludes most of the photons emitted by ADOTA. Despite this fact, when the time-gate is set to 20 ns, the contribution from the long fluorescence lifetime component of ADOTA (~13 ns) dominates the detected fluorescence. Because the photons collected 0–20 ns after the excitation pulse are excluded from the decay curve by the time-gating procedure, the remaining photons can be fitted with a single exponential decay of 13.65 ns, confirming that the autofluorescence has been eliminated. The subsequent image corresponding to the 20 ns time-gate shows the ADOTA labeled cells with no background contribution.
Fig. 6.
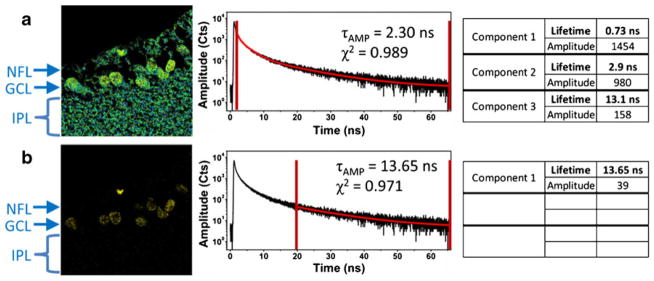
Time-gated FLIM applied to tissue labeled with ADOTA. Panel (a) shows the FLIM equivalent of the steady-state image; data collection begins after 2.5 ns and excludes scattered excitation only. In panel (b) data collection is delayed by 10 ns. All of the data shown in this figure were obtained in one collection of data from a single, 80×80 μm (300 pixels × 300 pixels) area of tissue
Figure 7 shows intensity traces collected along the line of pixels indicated in each image. From Fig. 7b, one can see that it is impossible to distinguish the stained areas from unstained areas by intensity alone. There is very little difference in absolute magnitude, and there is no discernible baseline that one may subtract for quantitative purposes. When time-gating is applied, the intensity trace of unstained tissue (Fig. 7c) is negligible whereas that of the ADOTA-stained tissue (Fig. 7d) shows that the baseline may be more easily isolated from the signal because of the enhanced signal-to-background ratio. Thus we may isolate the ADOTA-IgG labeled RGCs.
Fig. 7.
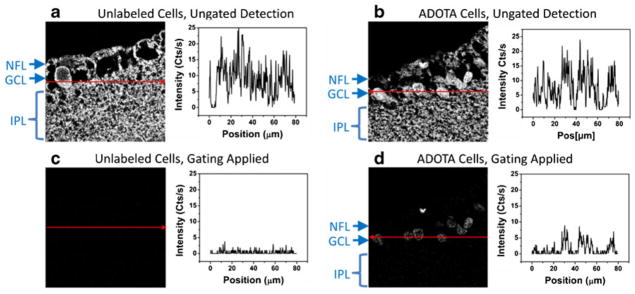
Confocal images (left) and intensity line traces (right) from (a) unlabeled cells and (b) cells labeled with ADOTA. The data presented in (c) and (d) are identical with those in (a) and (b) except that time-gating has been applied to eliminate the signal from autofluorescence. The intensity traces are collected along the red lines in the corresponding images, and all the images measure 80×80 μm. The labeled cell groups are the nerve fiber layer (NFL), ganglion cell layer (GCL), and inner plexiform layer (IPL)
The left panel of Fig. 8 shows the measured normalized intensities of the background (●) and selected region of tested tissue stained with IgG-ADOTA (▼) as a function of time-gate position. These intensities were determined by the total counts collected in the collection area shown in Fig. 6, and to account for heterogeneity between the samples, the data were normalized. The intensity of the background drops very quickly and the intensity from labeled RCG decays in a similar pattern, as predicted in our simulation (Fig. 2). With a time-gate delayed by 5 ns from the excitation pulse, the ADOTA signal is reduced by 51 %, but the signal from the background alone is reduced by 76 %. With a time gate of 20 ns, the signals from ADOTA and the background are reduced by 81 % and 96 % respectively. Thus a balance must be struck between elimination of the background and the preservation of the probe signal. The right panel of Fig. 8 shows the improvement in the signal-to-background ratio with increasing delay of the time gate. This was calculated as the ratio of total fluorescence from ADOTA-labeled cells, IA, minus the fluorescence of the unlabeled cells, IB, divided by the fluorescence of the labeled cells, i.e. (IA − IB)/IA. Again the data were normalized to account for heterogeneity. From this graph one may best determine the optimum settings of the time gate, which will, of course, vary with each experiment. If, for instance, the sample was very heavily labeled, a time gate could be set later than 20 ns, thereby eliminating more of the background. On the other hand, one would have to be very careful choosing a time gate when dealing with a moderately labeled sample, to prevent loss of too much of the probe signal. Once again, one may see the benefit of using ADOTA for these purposes, as its lifetime is long enough that even after only 5 ns the signal-to-noise ratio is improved by ~50 %.
Fig. 8.
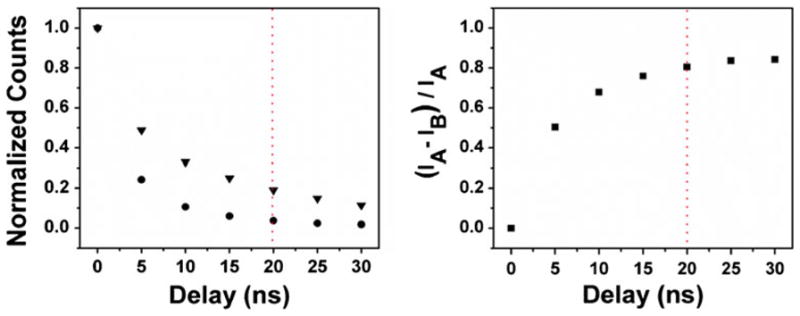
Left: time-gated intensities from unlabeled (circles) and ADOTA labeled (triangles) tissue. The data were obtained by summing the photons collected from the images in Fig. 4 (background) and Fig. 5 (background + ADOTA). Right: improvement of the signal to noise ratio by time gating. Normalized intensities between ADOTA labeled tissue, IA, and unlabeled tissue, IB, were used to account for heterogeneity between the two samples. The red line in both images marks the time gate set at 20 ns
Conclusion
In conclusion, we have demonstrated a method by which the significant contributions of background fluorescence may be almost eliminated from confocal microscopy. The time-gated method was demonstrated for tissue samples, autofluorescence of which is especially strong. The method does not require long collection times or heavy labeling, thus making it ideal for high-resolution, laser-scanning, confocal microscopy. The time-gating technique depends on the use of moderately long-lived dyes, for example the ADOTA dye presented here. FLIM enables temporal separation of short-lived fluorescence emission, which includes scattering of the excitation light and fluorescence of inherent components of tissue and fixative-induced fluorescence, and the long-lived ADOTA dye ensures that the labeled regions will continue to emit photons long after the background has disappeared. The combination of FLIM and ADOTA enable more definitive conclusions to be drawn from fluorescence imaging in precisely targeted studies. We expect that detailed analysis of the images may lead to fully quantitative measurements of labeling efficiency that can be used to detect a variety of transient cellular processes or disease stages.
Acknowledgments
This work was supported by NIH grants R01EB12003 (Z.G.) and 1RO1HL090786-01A2 (J.B.) and the Danish Council for Independent Research, Technology, and Production Sciences grant 10-093546 (T.J.S.).
Contributor Information
Ryan M. Rich, Department of Molecular Biology and Immunology, Center for Commercialization of Fluorescence Technologies, University of North Texas Health Science Center, Fort Worth, TX 76107, USA
Dorota L. Stankowska, Department of Cell Biology and Anatomy, University of North Texas Health Science Center, Fort Worth, TX 76107, USA
Badri P. Maliwal, Department of Molecular Biology and Immunology, Center for Commercialization of Fluorescence Technologies, University of North Texas Health Science Center, Fort Worth, TX 76107, USA
Thomas Just Sørensen, Nano-Science Center and Department of Chemistry, University of Copenhagen, Universitetsparken 5, 2100 København Ø, Denmark.
Bo W. Laursen, Nano-Science Center and Department of Chemistry, University of Copenhagen, Universitetsparken 5, 2100 København Ø, Denmark
Raghu R. Krishnamoorthy, Department of Cell Biology and Anatomy, University of North Texas Health Science Center, Fort Worth, TX 76107, USA
Zygmunt Gryczynski, Department of Molecular Biology and Immunology, Center for Commercialization of Fluorescence Technologies, University of North Texas Health Science Center, Fort Worth, TX 76107, USA. Department of Physics and Astronomy, Texas Christian University, Fort Worth, TX 76129, USA.
Julian Borejdo, Department of Molecular Biology and Immunology, Center for Commercialization of Fluorescence Technologies, University of North Texas Health Science Center, Fort Worth, TX 76107, USA.
Ignacy Gryczynski, Email: ignacy.gryczynski@unthsc.edu, Department of Molecular Biology and Immunology, Center for Commercialization of Fluorescence Technologies, University of North Texas Health Science Center, Fort Worth, TX 76107, USA. Department of Cell Biology and Anatomy, University of North Texas Health Science Center, Fort Worth, TX 76107, USA.
Rafal Fudala, Email: Rafal.Fudala@unthsc.edu, Department of Molecular Biology and Immunology, Center for Commercialization of Fluorescence Technologies, University of North Texas Health Science Center, Fort Worth, TX 76107, USA.
References
- 1.Ghisla S, Massey V, Lhoste J, Mayhew S. Fluorescence and optical characteristics of reduced flavines and flavoproteins. Biochemistry. 13(3):589–597. doi: 10.1021/bi00700a029. [DOI] [PubMed] [Google Scholar]
- 2.Croce AC, Spano A, Locatelli D, Barni S, Sciola L, Bottiroli G. Dependence of fibroblast autofluorescence properties on normal and transform conditions. Role of the metabolic activity. Photochem Photobiol. 1999;69:364–374. doi: 10.1562/0031-8655(1999)069<0364:dofapo>2.3.co;2. [DOI] [PubMed] [Google Scholar]
- 3.Haralampus-Grynaviski NM, Lamb LE, Clancy CM, Skumatz C, Burke JM, Sarna T, Simon JD. Spectroscopic and morphological studies of human retinal lipofuscin granules. Proc Natl Acad Sci U S A. 2003;100:3179–3184. doi: 10.1073/pnas.0630280100. [DOI] [PMC free article] [PubMed] [Google Scholar]
- 4.Doyle KP, Simon RP, Snyder A, Stenzel-Poore MP. Working with GFP in the brain. Biotechniques. 2003;34:492–494. doi: 10.2144/03343bm08. [DOI] [PubMed] [Google Scholar]
- 5.König K, Riemann I. High-resolution multiphoton tomography of human skin with subcellular spatial resolution and picosecond time resolution. J Biomed Opt. 2003;8:432–439. doi: 10.1117/1.1577349. [DOI] [PubMed] [Google Scholar]
- 6.Richards-Kortum R, Drezek R, Sokolov K, Pavlova I, Follen M. Survey of endogenous biological fluorophores. In: Mycek MA, Pogue BW, editors. Handbook of biomedical fluorescence. Marcel Dekker Inc; New York: 2003. pp. 237–264. [Google Scholar]
- 7.Schweitzer D, Schenke S, Hammer M, Schweitzer F, Jentsch S, Birckner E, Becker W. Towards metabolic mapping of the human retina. Microsc Res Tech. 2007;70:403–409. doi: 10.1002/jemt.20427. [DOI] [PubMed] [Google Scholar]
- 8.Schnell SA, Staines WA, Wessendorf MW. Reduction of lipofuscin like autofluorescence in fluorescently labeled tissue. J Histochem Cytochem. 1999;47:719–730. doi: 10.1177/002215549904700601. [DOI] [PubMed] [Google Scholar]
- 9.Clancy B, Cauller LJ. Reduction of background autofluorescence in brain sections following immersion in sodium borohydride. J Neurosci Methods. 1998;83:97–102. doi: 10.1016/s0165-0270(98)00066-1. [DOI] [PubMed] [Google Scholar]
- 10.Cowen T, Haven AJ, Burnstock G. Pontamine Sky Blue: a counterstain for background autofluorescence in fluorescence and immunofluorescence histochemistry. Histochemistry. 1985;82:205–208. doi: 10.1007/BF00501396. [DOI] [PubMed] [Google Scholar]
- 11.Steinkamp JA, Stewart CC. Dual-laser, differential fluorescence correction method for reducing cellular background autofluorescence. Cytometry. 1986;7:566–574. doi: 10.1002/cyto.990070611. [DOI] [PubMed] [Google Scholar]
- 12.Van de Lest CH, Versteeg EM, Veerkamp JH, Van Kuppevelt TH. Elimination of autofluorescence in immunofluorescence microscopy with digital image processing. J Histochem Cytochem. 1995;43:727–730. doi: 10.1177/43.7.7608528. [DOI] [PubMed] [Google Scholar]
- 13.Beeby A, Botchway SW, Clarkson IM, Faulkner S, Parker AW, Parker D, Williams JAG. Luminescence imaging microscopy and lifetime mapping using kinetically stable lanthanide(III) complexes. 2000;57(2):83–89. doi: 10.1016/s1011-1344(00)00070-1. [DOI] [PubMed] [Google Scholar]
- 14.Frangioni JV. The problem is background, not signal. Mol Imaging. 2009;8(6):303–304. [PubMed] [Google Scholar]
- 15.Mathejczyk JE, Pauli J, Dullin C, Napp J, Tietze LF, Kessler H, Resch-Genger U, Alves F. Spectroscopically well-characterized RGD optical probe as a prerequisite for lifetime-gated tumor imaging. Mol Imaging. 2011;10(6):469–480. [PubMed] [Google Scholar]
- 16.Jin D, Piper JA. Time-gated luminescence microscopy allowing direct visual inspection of lanthanide-stained microorganisms in background-free condition. Anal Chem. 2011;83(6):2294–2300. doi: 10.1021/ac103207r. [DOI] [PubMed] [Google Scholar]
- 17.Laursen BW, Sørensen TJ. Synthesis of super stable triangulenium dye. J Org Chem. 2009;74(8):3183–3185. doi: 10.1021/jo9002486. [DOI] [PubMed] [Google Scholar]
- 18.Sørensen TJ, Laursen BW, Luchowski R, Shtoyko T, Akopova I, Gryczynski Z, Gryczynski I. Enhanced fluorescence emission of Me-ADOTA by self-assembled silver nanoparticles on a gold film. Chem Phys Lett. 2009;476(1):46–50. doi: 10.1016/j.cplett.2009.05.064. [DOI] [PMC free article] [PubMed] [Google Scholar]
- 19.Folmar M, Shtoyko T, Fudala R, Akopova I, Gryczynski Z, Raut S, Gryczynski I. Metal enhanced fluorescence of Me-ADOTA•Cl dye by silver triangular nanoprisms on a gold film. Chem Phys Lett. 2012;531:126–131. [Google Scholar]
- 20.Martin JC, Smith RG. Factors influencing the basicities of triarylcarbinols. The synthesis of sesquixanthydrol. J Am Chem Soc. 1964;86:2252–2256. [Google Scholar]
- 21.Laursen BW, Krebs FC. Synthesis of a triazatriangulenium salt. Angew Chem Int Ed Engl. 2000;39(19):3432–3434. doi: 10.1002/1521-3773(20001002)39:19<3432::aid-anie3432>3.0.co;2-s. [DOI] [PubMed] [Google Scholar]
- 22.Laursen BW, Krebs FC. Synthesis, structure, and properties of azatriangulenlenium salts. Chemistry. 2001;7(8):1773–1783. doi: 10.1002/1521-3765(20010417)7:8<1773::aid-chem17730>3.0.co;2-f. [DOI] [PubMed] [Google Scholar]
- 23.Reynisson J, Wilbrandt R, Brinck V, Laursen BW, Nørgaard K, Harrit N, Brouwer AM. Photophysics of trioxatriangulenium ion. Electrophilic reactivity in the ground state and excited singlet state. Photochem Photobiol Sci. 2002;1(10):763–773. doi: 10.1039/b204954f. [DOI] [PubMed] [Google Scholar]
- 24.Dileesh S, Gopidas KR. Photophysical and electron transfer studies of a stable carbocation. Chem Phys Lett. 2000;330:397–402. [Google Scholar]
- 25.Hammershøj P, Sørensen TJ, Han BH, Laursen BW. Base-assisted one-pot synthesis of N, N′, N″-triaryltriazatriangulenium dyes: enhanced fluorescence efficiency by steric constraints. J Org Chem. 2012;77(13):5606–5612. doi: 10.1021/jo3007732. [DOI] [PubMed] [Google Scholar]
- 26.Lakowicz JR, Gryczynski I, Gryczynski Z, Johnson ML. Background suppression in frequency-domain fluorimetry. Anal Biochem. 2000;277:74–85. doi: 10.1006/abio.1999.4346. [DOI] [PMC free article] [PubMed] [Google Scholar]
- 27.http://www.who.int/blindness/causes/priority/en/index7.html
- 28.Sillen A, Engelborghs Y. The correct use of “average fluorescence parameters”. Photochem Photobiol. 1998;67(5):475–486. [Google Scholar]
- 29.Ogawa M, Kosaka N, Choyke PL, Kobayashi H. H-type dimer formation of fluorophores: a mechanism for activatable, in vivo optical molecular imaging. ACS Chem Biol. 2009;4:535–546. doi: 10.1021/cb900089j. [DOI] [PMC free article] [PubMed] [Google Scholar]
- 30.Therien AG, Blostein R. Mechanisms of sodium pump regulation. Am J Physiol Cell Physiol. 2000;279(3):C541–C566. doi: 10.1152/ajpcell.2000.279.3.C541. [DOI] [PubMed] [Google Scholar]
- 31.Al-Khalili L, Kotova O, Tsuchida H, Ehrén I, Féraille E, Krook A, Chibalin AV. ERK1/2 mediates insulin stimulation of Na (+), K(+)-ATPase by phosphorylation of the alpha-subunit in human skeletal muscle cells. J Biol Chem. 2004;279(24):25211–25218. doi: 10.1074/jbc.M402152200. [DOI] [PubMed] [Google Scholar]
- 32.Tian J, Cai T, Yuan Z, Wang H, Liu L, Haas M, Maksimova E, Huang XY, Xie ZJ. Binding of Src to Na+/K+-ATPase forms a functional signaling complex. Mol Biol Cell. 2006;1:317–326. doi: 10.1091/mbc.E05-08-0735. [DOI] [PMC free article] [PubMed] [Google Scholar]
- 33.Liang M, Cai T, Tian J, Qu W, Xie ZJ. Functional characterization of Src-interacting Na/K-ATPase using RNA interference assay. J Biol Chem. 2006;281(28):19709–19719. doi: 10.1074/jbc.M512240200. [DOI] [PubMed] [Google Scholar]


