Abstract
Qualitative and quantitative changes characterize locomotion and rhythmic interlimb coordination at different speeds. Legs and hands do not just move more or less quickly; they also adopt different relative coordination patterns. Here we asked whether similar transitions occur for unimanual hand movements when speed is slowed below the preferred speed. Participants moved a hand-held dowel back and forth between two large circular targets in time with a metronome at periods between 370 ms and 1667 ms. We analyzed the kinematics of participants’ movements at each period and found that proportional dwell time and number of peaks in the velocity profile increased as driving periods increased. Path lengths and peak velocities remained relatively constant for driving periods exceeding 800 ms. Participants made only gradual changes to their movement parameters, such that they went from a continuous mode to a more discrete mode of behavior for longer driving periods. Thus, unlike for rhythmic bimanual movements or locomotory patterns, there are quantitative but no clear qualitative changes for unimanual movements. The results suggest that participants tried to move close to their preferred tempo at different rates, and that they avoided moving slowly.
INTRODUCTION
When physical actions are performed at different rates, they are not simply sped up or slowed down. Rather, categorical changes are seen in the movements. For horses and other quadrupeds, there is a switch from a walk to a trot to a gallop as the animal locomotes at higher and higher rates, as evidenced by different phase relations between the limbs (e.g., Hoyt & Taylor, 1981). For human bipedal locomotion, there is an analogous transition from walking to running, evidenced by an abrupt change in the proportion of flight and stance times (e.g., Alexander, 1989). Such transitions in movement patterns have also been observed in the upper limbs. For example, when people perform flexion/extension movements with their two index fingers, they switch from an anti-phase to an in-phase pattern with increasing movement rate (e.g., Kelso, 1984).
Research on transitions in movement patterns has predominantly focused on changes in the relative coordination between two or more limbs. Such abrupt transitions in relative phase elicited by continuous changes in movement frequency are consistent with phase transitions in nonlinear dynamical systems. A question that has not been explored in this line of research is whether transitions in movement patterns occur within a single limb when people perform movements at different rates. There is reason to expect such transitions to occur in single limb movements principally because intralimb coordination is also a nonlinear system or coordinative structure consisting of multiple degrees of freedom at different levels (joint angles, muscles, motor units, etc.) that could reorganize with speed changes (Turvey, 1990).
To pursue this possibility, we examined possible transitions in the kinematics of movements of a single arm driven at different rates. We were especially interested in the very low rates. Our approach was motivated by several studies showing that humans display significant deviations from typical arm-movement patterns when they move slowly. The instructions in these studies were to move slowly (Atkeson & Hollerbach, 1985; Nishikawa, Murray, & Flanders, 1999), to move at a constant slow speed (Doeringer & Hogan, 1998), or to move slowly and smoothly (Adam & Paas, 1996; Nagasaki, 1989). Given these instructions, participants did not have the liberty to choose how to fill the long time intervals with movement or, alternatively, to hold still. For locomotion, it is well known that at different locomotion rates, the duration of the swing phase changes much less than the duration of the stance phase (Murray, 1967). We wondered whether a similar result would hold for the hand.
To pursue this question, we asked participants to perform the task of moving a hand-held dowel between two targets in time with a metronome to bring the base of the dowel onto the target in time with the metronome clicks. We varied the metronome’s click rate in different conditions and studied the movement patterns that participants spontaneously adopted. Critically, we included periods with unusually long intervals, effectively creating a situation in which participants had much more time to complete their movements than we expected them to prefer for the movements covering the distance used here.
The analyses of kinematic changes in movement characteristics were guided by three hypotheses. The first was that with different driving periods, the movement characteristics would change abruptly, similar to the robust phenomenon of phase transition identified in bimanual coordination and locomotory patterns.
The second hypothesis was based on the influential rate scaling model by Viviani and Terzuolo (1982). This model says that moving at different rates leads to stretching or compressing a movement profile to match a desired movement rate, with no qualitative changes coming into play. While this model is attractive for its parsimony, it has been questioned, principally because gait transitions are observed at different rates of locomotion. Gentner (1987) summarized violations of the rate scaling model for a wide range of movements, and such violations have been further supported by subsequent studies (e.g., Beek, 1992; Burgess-Limerick, Neal, & Abernethy, 1992; Gutnik, Nicholson, Go, Gale & Nash, 2003). Despite these arguments and violations, there are demonstrations supporting this model – first and foremost Viviani and Terzuolo’s data on typing. Hence, we considered it worthwhile to test the model in simple unimanual movements to determine the boundaries of the model’s validity for this class of movements, where it has not been tested before, to the best of our knowledge.
The third hypothesis we considered was one we called the preferred frequency hypothesis. This hypothesis relied on the fact that any moving system has a preferred frequency that is largely determined by its resonance frequency. The preferred frequency hypothesis states that people adjust their movement patterns so as to move as close as possible to resonance. There is indeed experimental evidence that people adjust their movement patterns to move at or near resonance (e.g., Abe & Yamada, 2003; Goodman, Riley, Mitra, & Turvey, 2000; Hatsopoulos & Warren, 1996; Holt, Jeng, Radcliffe, & Hamill, 1995; Raftery, Cusumano, & Sternad, 2008; Rosenbaum, Slotta, Vaughan, & Plamondon, 1991; Rosenblum & Turvey, 1988; Yu, Russell, & Sternad, 2003). The preferred frequency hypothesis predicted that when people move, they would do so close to or at the preferred frequency of the moved limb. In particular, they would avoid moving very slowly in the most critical conditions of the present experiment, those conditions in which the driving period was long enough for participants not to have to move quickly to accomplish the task. One way they could do so is to adopt a stereotypical movement pattern in which they only vary their dwell times on the targets, keeping their movement times approximately constant. This strategy would be like the one shown in walking (e.g. Herman, Wirta, Bampton, & Finley, 1976).
METHOD
Participants moved a hand-held dowel back and forth between two circular targets on a tabletop in time with a metronome that clicked at 8 driving periods ranging, in equal frequency steps of 0.3 Hz, from 370 ms (2.7 Hz frequency) to 1667 ms (0.6 Hz frequency).Participants were asked to bring the base of the dowel onto one target and then the other in time with the metronome. No other instruction was given about timing. Thus, nothing was said about how the movements should be carried out to achieve the goal of synchronizing the landings of the dowel base onto the two targets in time with the metronome.
In a control condition, we asked participants to perform the back-and-forth tapping task in the absence of an external metronome. Our reason for including this condition was to obtain estimates of each participant’s preferred movement period. We were interested in the possibility that participants avoided deviating too much from their preferred rates in the experimental conditions.
Participants
Eight neurologically healthy right-handed participants (5 males, 3 females) participated. They were drawn from the undergraduate psychology subject pool at Penn State University. Participants ranged in age from 18 to 22 years. We evaluated handedness with the Edinburgh handedness inventory (Oldfield, 1971). All participants said that they used their right hand for at least 8 out of 11 tasks mentioned. All participants used their dominant (right) hand in all the conditions. The Penn State Institutional Review Board approved the experiment.
Procedure
Figure 1 shows the experimental setup. Participants sat at a table whose horizontal surface had two circular targets made of red foam (8 cm diameter, 0.2 cm thick). The centers of the targets were spaced 30 cm apart. The target diameters were large enough to keep precision requirements low. The manipulandum was a 99 g wooden dowel that was 20 cm long and 3 cm wide.
Figure 1.
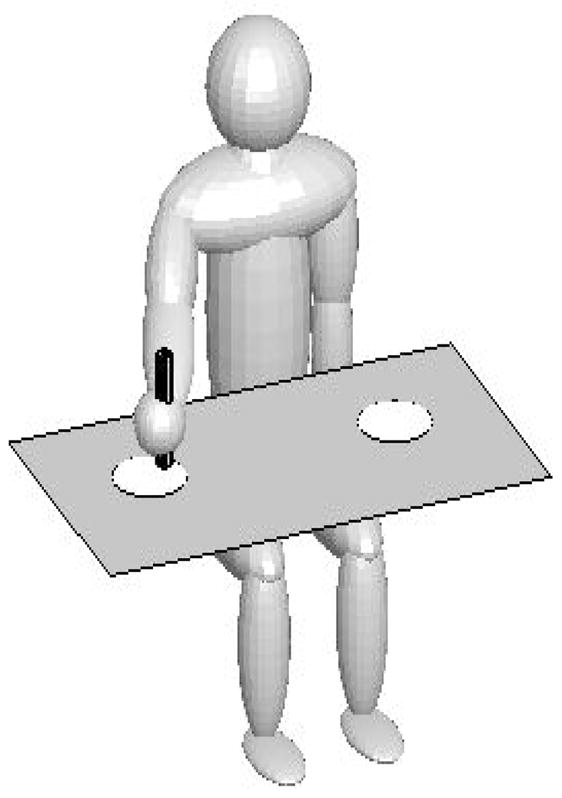
Experimental setup, rendered in MATLAB (MathWorks, Natick, MA). Participants sat at a table and moved a dowel back and forth between the two target positions in time with a metronome. Each trial started on the right target and finished once participants landed on the right target the 20th time.
Participants lined up their right shoulder with the midpoint between the two targets so they could perform the movements with the arm extended. Participants’ movements were recorded with three infrared light emitting diodes (IRED) attached to the top edge of the dowel at equal angular intervals. We used multiple IREDs to ensure that the position of the dowel would always be in view of the OPTOTRAK 3020 motion analysis camera system (Northern Digital Inc., Waterloo, Ontario, CN) used to record the data at 100 Hz.
Before the start of each trial, the participant held the dowel with his or her dominant hand, keeping the base of the dowel on the right target circle. After a few beats of the metronome, once the participant felt that s/he had internalized the beat, s/he moved back and forth between the targets in time with the metronome until the experimenter told her or him to stop. Even though the targets were made of foam, the contact of the dowel with the targets in most cases resulted in a relatively soft but noticeable tapping sound.
In the experimental trials, participants made 40 back-and-forth movements in time with the metronome but were not responsible for keeping track of the number of back-and-forth movements that were completed. The experimenter told the participant to stop after the requisite number of back-and-forth movements was made.
Each participant also performed without the metronome, moving back and forth between the same two targets at their preferred rate. This self-paced condition was run for each participant before the first experimental (metronome-driven) trial, halfway through the block, and again at the end of the block. Each participant performed two trial blocks, each of which included every driving period and the three self-paced trials. The order of driving periods was randomized and counterbalanced over participants.
The dependent variables per inter-target move were times between target hits and metronome clicks, times spent dwelling on the target, number of velocity peaks, path lengths, and peak velocities. We took the means of these values over the 40 inter-target moves per trial. The raw position data were filtered with a low-pass Butterworth filter with a cut-off frequency of 10 Hz to remove measurement noise. Velocity was obtained by a two-point difference algorithm and was subsequently differentiated again at 10Hz. We defined dwell times as times spent on the targets between when the velocity first fell below 10% of the preceding peak velocity and when the velocity next exceeded 10% of the following peak velocity. Movement times were defined as times between successive dwell times. Movement onset and offset criteria were selected based on convention as well as on a careful exploration of the effects of different onset criteria on our results (Teasdale, Bard, Fleury, Young, & Proteau, 1993). Each of the movement-related variables was calculated only for times at which participants moved, thus omitting dwell times for the calculating of these variables. Velocity peaks were defined as local maxima in the velocity profile of the movement times. Path lengths were defined as total distance traveled in x (left-right), y (in-out), and z (up-down), between dwell times. To determine how closely participants followed the metronome rate, we calculated the asynchrony, defined as the difference between the start of the dwell time on a target and the nearest-in-time metronome beat. Negative asynchronies denoted early arrivals, whereas positive asynchronies denoted late arrivals.
We submitted each of the dependent variables -- dwell time, number of velocity peaks, mean path length, mean peak velocity, and asynchrony -- to separate 8 ×2 repeated-measures ANOVAs with the 8 driving periods and 2 trial blocks as within subject factors. We included dwell status (explained below) as a between-subject factor and applied a Greenhouse-Geisser correction to the degrees of freedom where appropriate. Trial block was not included in the analyses because exploratory analyses indicated that it did not have a significant effect for any of the dependent variables.
RESULTS
Figure 2 provides example trajectories from one participant in each of the experimental conditions. The figure illustrates how trajectories became less smooth as driving periods increased. Note that the trajectories are projected onto the coronal plane from the viewpoint of the participant. The trajectories are from movements in both directions (left to right and right to left), which may add to the noticeable variability in the trajectories.
Figure 2.
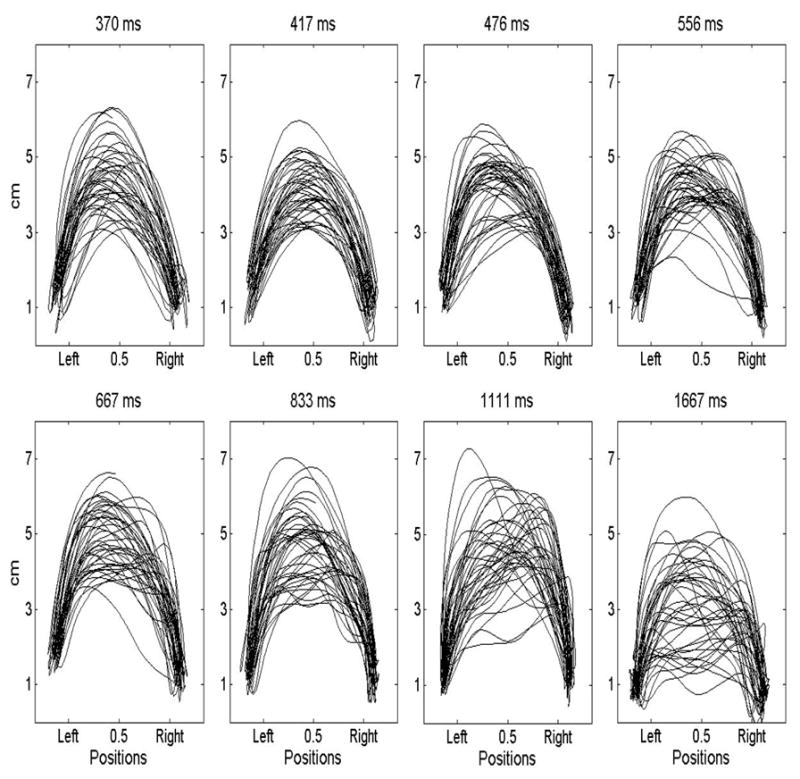
Example trajectories from one participant for each driving period. The abscissa corresponds to the horizontal position of the dowel the participant held relative to the two target locations. Values on the ordinate correspond to the vertical position of the dowel.
Trials at Preferred Period
In the self-paced trials, the mean period of participants’ movements was 650 ms (SD = 175.36 ms). In these trials, participants dwelled on average 216 ms (SD = 206.48 ms). The mean proportion of the inter-target movement time spent dwelling on the targets was .227 (SD = .16 ). The average number of velocity peaks per inter-target move was 1.53 (SD = .47), the average path length per inter-target movement was 35.93 cm (SD = .3.87 cm), and the average peak velocity per inter-target move was 0.87 m/s (SD = 0.21 m/s).
Asynchrony
Figure 3 shows mean asynchrony (± 1 SE) as a function of driving period. A repeated measures ANOVA revealed no significant main effect of driving period on asynchrony, p > .10. On average, participants arrived at the targets within 20 ms of the metronome beats for all periods. This result is surprising in view of previous findings showing a shift from positive to negative asynchrony for short versus long periods (e.g., Mates et al., 1994). However, others have argued that the strategy to react to tones instead of predicting them arises as an artifact of imprecise task instruction (Repp & Doggett, 2007). Perhaps our particular instructions together with the feedback available from tapping on the targets with the dowel resulted in near synchronous performance for all driving periods tested here.
Figure 3.
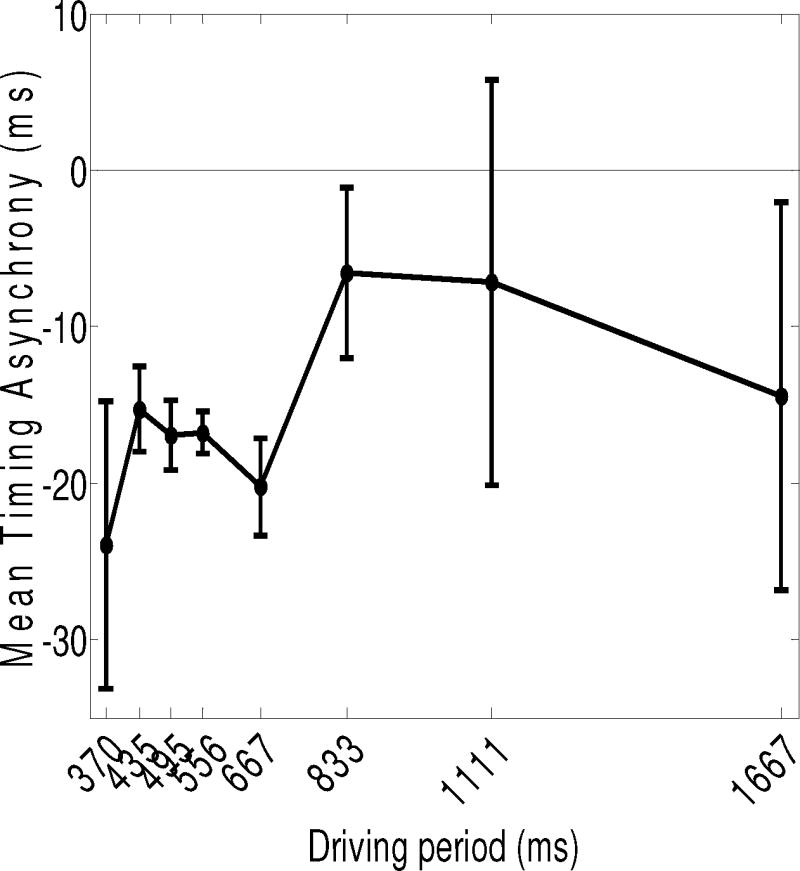
Mean asynchrony error (± 1 SE) as a function of driving period. Negative values indicate that target arrivals tended to occur before the onset of metronome beats.
Dwell Time and Movement Time
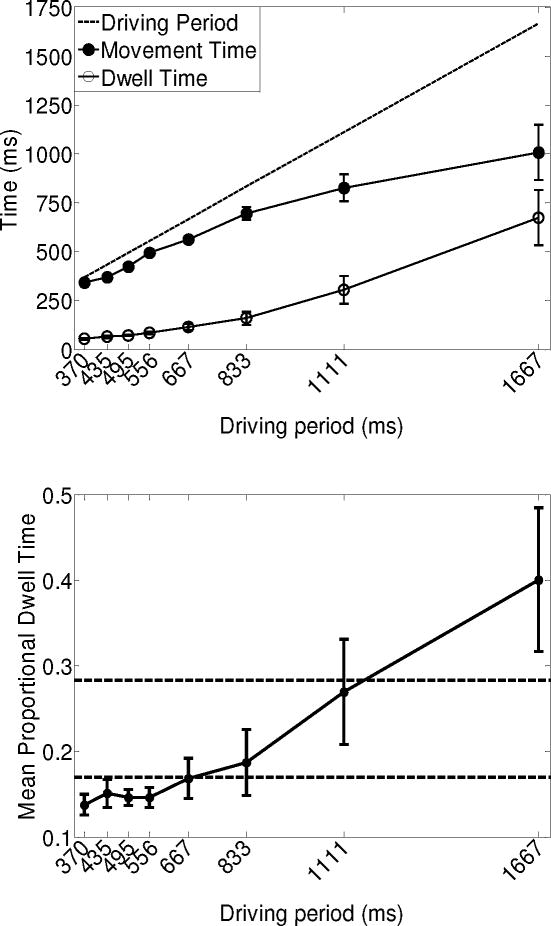
The top panel of Figure 4 shows the mean dwell times (± 1 SE) and mean movement times (± 1 SE) as a function of driving period. An ANOVA concerning the effect of driving period on dwell time revealed a main effect, F(1.25, 8.72) = 18.79, p < .01, such that dwell time increased as driving period lengthened. The lengthening of dwell time had an approximately exponential time course, suggesting gradual rather than discontinuous change.
Figure 4.
Top panel: Dwell times (± 1 SE) and movement times (± 1 SE) as a function of driving period. The solid unity line indicates the driving periods generated by the metronome. The dotted horizontal lines indicate mean movement times (± 1 SE) generated when moving in the self-paced trials. Bottom panel: Proportional dwell times (± 1 SE) as a function of driving period. The horizontal lines indicate mean values (± 1 SE) generated when moving in the self-paced trials.
For movement time, the ANOVA revealed a main effect of driving period, F(1.22, 8.55) = 23.03, p < .01, such that movement time increased as driving period lengthened. The lengthening of movement time with driving period approximated an exponential function, again indicating gradual instead of discontinuous change across the range of driving periods.
To test for rate scaling, we calculated proportional dwell times by dividing the total dwell time by the sum of dwell time and movement time. The bottom panel of Figure 4 shows the mean proportional dwell time as a function of driving period. The ANOVA revealed a main effect of driving period on proportional dwell time, F(1.62, 11.37) = 7.73, p = .01. Proportional dwell time tended to increase with increasing driving periods, especially for the two longest driving periods. Again, the function relating proportional dwell time to driving period was monotonic without clear discontinuous changes.
Path Length
An ANOVA testing for effects of driving period on the mean path length showed that participants did not change their movement trajectories appreciably for different driving periods, p > .10. The horizontal lines indicate mean values (± 1 SE) generated when moving in the preferred trials.
Peak Velocity
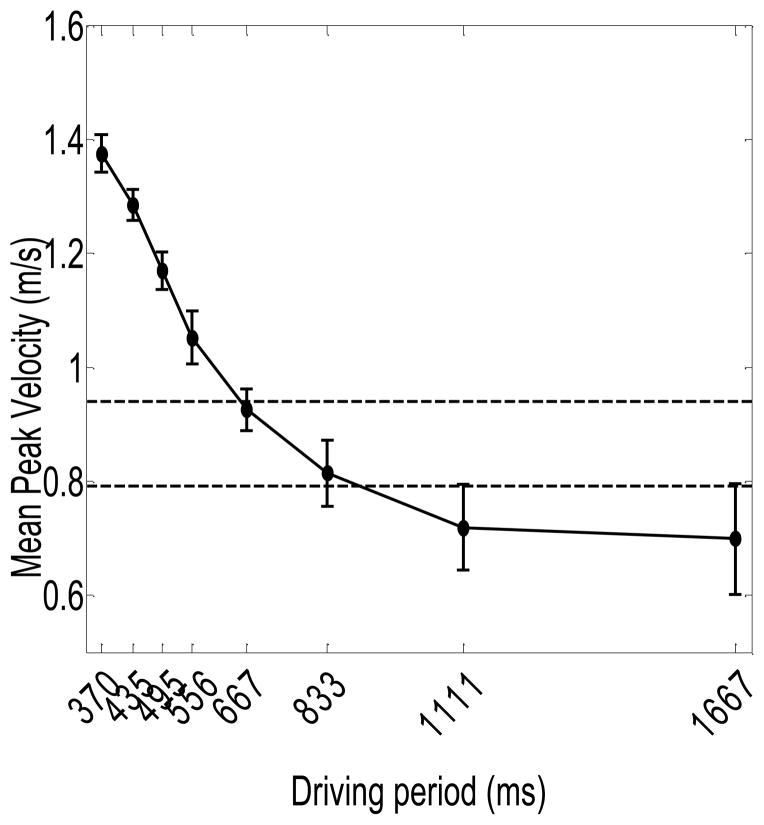
Figure 5 shows the mean peak velocity per inter-target movement (± 1 SE) as a function of driving period. The two horizontal lines indicate the upper and lower bounds around the mean preferred values. We considered mean peak velocity as a function of movement time as well, and found that the pattern of results was very similar.
Figure 5.
Mean peak velocity (± 1 SE) as a function of driving period. The horizontal lines indicate mean values (± 1 SE) generated when moving in the self-paced trials.
The ANOVA revealed a main effect of driving period on mean peak velocity, F(1.52,10.67) = 64.13, p < .01, such that in general peak velocity per inter-target movement decreased with increasing driving periods. As can be seen in Figure 5, peak velocities decreased roughly linearly with increasing driving periods for driving periods below 833 ms, and stayed roughly constant and close to the preferred range for driving periods exceeding 833 ms. Thus, participants held their movement speed roughly constant at long driving periods. The function does not suggest clear discontinuous changes, however.
Number of Velocity Peaks
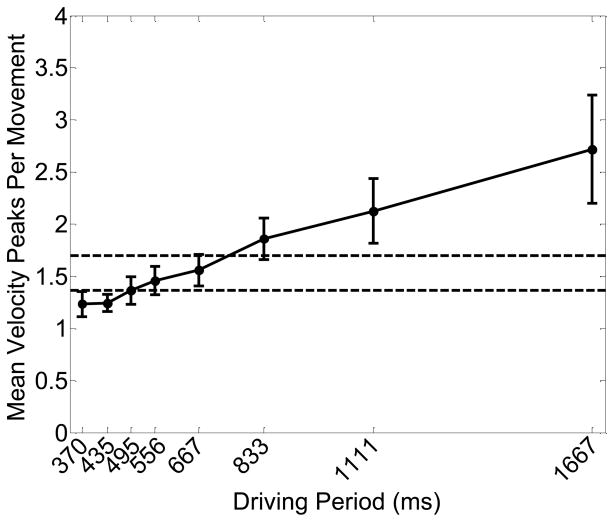
Figure 6 shows the mean number of velocity peaks per inter-target movement (± 1 SE) as a function of driving period. The pattern of results was very similar when we considered the mean number of velocity peaks as a function of movement time.
Figure 6.
Mean number of velocity peaks per movement (± 1 SE) as a function of driving period. The horizontal lines indicate mean values (± 1 SE) generated when moving in the self-paced trials.
The ANOVA revealed a main effect of driving period on the mean number of velocity peaks per inter-target movement, F(1.46, 10.24) = 7.70, p < .05, such that the mean number of velocity peaks per inter-target movement increased with increasing driving periods. Figure 6 suggests that the relationship between the mean number of velocity peaks and driving period was close to linear.
DISCUSSION
The question we sought to address in this study was whether transitions in arm movement patterns would occur when people moved a hand-held dowel between targets in time with a metronome that clicked at each of a number of frequencies. Following observations in locomotion and other multi-limb coordination tasks, we predicted that discontinuous transitions would occur at some metronome rates. An alternative hypothesis was motivated by the rate scaling model of Viviani and Terzuolo (1980), according to which movement time should scale continuously with driving period. The third hypothesis we considered was based on the notion of preferred frequency of movement, according to which participants would adhere to their preferred movement speeds and would satisfy the task requirement of placing the base of the dowel on the targets in time with the metronome principally by inserting longer dwell intervals when the required frequency was low.
Our data did not support the first hypothesis. The results clearly showed that the quantitative changes in dwell time, movement time, and peak velocity occurred gradually, even though for most dependent measures, changes were pronounced for the shorter periods and leveled out for periods longer than approximately 833 ms. The foregoing comments pertain to the average data (averages over participants), but we also inspected the data of individual subjects and in none of them found evidence for abrupt transitions. Hence, we did not find support for the first hypothesis.
With regard to the second, rate scaling hypothesis, none of our participants behaved in a way that was consistent with it. None of them scaled their movement speed proportionally to the required inter-target interval. This outcome indicates that the rate scaling model was violated for the simple motor task used here, just as it has been for more complex motor tasks, as reviewed in the introduction.
What do our data say about the preferred frequency hypothesis? If participants mainly cared about moving at their preferred frequency for long time intervals, they would have tried to generate movements whose periods approximated the preferred periods for the effector system in use. Some of our results are consistent with this hypothesis, as indicated by the data points in our graphs that fell within the ranges of values characterizing the participants’ self-paced performance (i.e., between the horizontal lines in Figures 5 and 6). However, there were also results that were inconsistent with the hypothesis. Especially for the slower driving periods, proportional dwell time, peak velocity, and the mean number of velocity peaks per movement were outside the range given by participants’ preferred periods. Thus, participants’ movements for slower driving periods had different kinematic properties than the movements the participants generated in the self-paced trials.
Our results indicate then that our participants used a combination of moving more slowly, dwelling longer, and generating more submovements at low metronome rates. This outcome was not directly predicted by any of the hypotheses we adduced at the start of this research. How, then, can we explain our data?
Because the results were most consistent with the preferred frequency hypothesis, we consider the possibility that some factor caused that hypothesis not to be confirmed exactly. Specifically, it is possible that at low driving periods participants had difficulty perceiving the long time intervals. The longer the time interval to be perceived or produced, the less precise the estimate of the interval becomes, as reflected in greater variances for longer intervals (e.g., Dunlap, 1910; Ivry & Hazeltine, 1995; Peters, 1989; Wing & Kristofferson, 1973) and a shift from anticipatory to reactive behavior at longer intervals (e.g., Engström, Kelso, & Holroyd, 1996; Mates, Radil, Müller, & Pöppel, 1994; Miyake, Onishi, & Pöppel, 2004; Repp, 2006, but see Repp & Doggett, 2007). Consistent with this explanation of avoiding long time intervals, our participants may have adopted strategies that helped them improve their time estimation, permitting reductions in the discrepancy between when they brought the base of the dowel to each target and when the metronome clicked. Participants may have subdivided the time intervals to reduce timing variance (Killeen & Weiss, 1987), either by waiting longer on the targets (increasing dwell times) and departing for the next target after a critical subinterval time, by making submovements with durations approximating preferred time intervals (i.e., time intervals whose estimate variances were acceptably low), or both.
As plausible as this may be, we doubt it actually accounts for our results. We base this statement on consideration of results from other studies. Buchanan and colleagues (2006) obtained patterns of results similar to ours in a task in which the index of difficulty (ID) of Fitts (1954; Fitts & Peterson, 1964) varied between trials. In the task studied by Buchanan and colleagues, participants were not constrained in their movement period, though, unlike in our study, only ID changed, not driving period. The results of Buchanan’s experiment showed that participants changed their movement kinematics as a function of ID, such that there was a critical ID below which participants moved in a continuously rhythmic pattern and above which participants shifted to a discrete movement pattern. Our results suggest that gradual changes from more continuous to more discrete movement occur when movement timing is, to a degree, under the participant’s control.
Another study provides further support for the argument that our results did not solely reflect difficulties with timing longer durations. Adam and Paas (1996) used a reciprocal aiming task to investigate how dwell time related to Fitts’ ID. These authors found that dwell time increased as target size decreased and that this held both for rhythmic tapping and for sliding movements. In Adam and Paas’ Experiment 4, participants performed rhythmic sliding movements over a short distance (10 cm) between two large targets (8 cm diameter) and at a slow, medium, or fast pace under the instruction to move smoothly. Participants moved in the absence of a metronome and freely chose which movement frequency constituted the slow, medium, and fast rates. Adam and Paas found that dwell time depended on movement rate such that participants dwelled longer during slow rhythmic movements than during fast rhythmic movements. As was the case for the participants of Buchanan et al. (2006), changes in movement kinematics at slow and fast movement rates thus emerged in the absence of explicit timing constraints. Consistent with these findings, our results suggest that participants did not experience more difficulty with timing longer durations.
If difficulties with timing longer durations do not account for violations of the preferred frequency hypothesis, then what does? The results suggest that participants slowed down their movements when confronted with driving periods that were slower than the preferred tempo, but only up to a point. With increasingly slow rates, participants did not move ever slower. Instead, they adopted a movement time and speed that was slightly below their preferred tempo but that was still acceptably fast. Thus, the results suggest that participants avoided slow movements at driving periods that exceeded their preferred tempo.
Insofar as scientific progress is often measured by which hypotheses can be ruled out as well as, or instead of, by which hypotheses can be considered still viable, we have learned several useful things from this study. First, the experiment suggests that a gradual change occurs from more continuous to more discrete behavior for long driving periods. The gradual nature of this change contrasts with the qualitative changes in movement patterns that are observed when people locomote at different rates. Second, the results suggest that participants try to move close to their preferred tempo and specifically avoid very slow movements through a combination of moving acceptably quickly and dwelling for acceptably long times at slow rates. Third, the results provide further evidence against the hypothesis that people use proportional rate scaling when they move at different rates. Finally, in contrast to other related studies, instead of explicitly instructing people how to move we allowed different strategies in the adopted movement pattern. Our results suggest that this basic approach provides a useful window into the mechanisms that underlie movement rate control.
Acknowledgments
The authors thank Rajal Cohen, Jeffrey Eder, Bruno Repp, Joe Santamaria, and an anonymous reviewer for helpful comments. We also thank Christine Schiller and Matthew Walsh for their help with data collection. This research was supported by grant SBR-94-96290 from the National Science Foundation, grants KO2-MH0097701A1 and R15 NS41887-01 from the National Institute of Mental Health, and grants from the Social Science Research Institute and the College of Liberal Arts Office of Research and Graduate Studies, Pennsylvania State University. Dagmar Sternad was supported by grants from the National Science Foundation, BCS-0450218, the National Institutes of Health, R01 HD045639, and the Office of Naval Research, N00014-05-1-0844.
Contributor Information
Robrecht P.R.D. van der Wel, Email: R.vanderwel@donders.ru.nl.
Dagmar Sternad, Email: dagmar@neu.edu.
David A. Rosenbaum, Email: dar12@psu.edu.
References
- Abe MO, Yamada N. Modulation of elbow joint stiffness in a vertical plane during cyclic movement at lower or higher frequencies than natural frequency. Experimental Brain Research. 2003;153:394–399. doi: 10.1007/s00221-003-1583-5. [DOI] [PubMed] [Google Scholar]
- Adam JJ, Paas FGWC. Dwell time in reciprocal aiming tasks. Human Movement Science. 1996;15:1–24. [Google Scholar]
- Alexander RM. Optimization and gaits in the locomotion of vertebrates. Physiological Review. 1989;69:1199–1227. doi: 10.1152/physrev.1989.69.4.1199. [DOI] [PubMed] [Google Scholar]
- Atkeson CG, Hollerbach JM. Kinematic features of unrestrained vertical arm movements. Journal of Neuroscience. 1985;5(9):2318–2330. doi: 10.1523/JNEUROSCI.05-09-02318.1985. [DOI] [PMC free article] [PubMed] [Google Scholar]
- Beek PJ. Inadequacies of the proportional duration model: Perspectives from a dynamical analysis of juggling. Human Movement Science. 1992;11:227–237. [Google Scholar]
- Buchanan JJ, Park J, Shea CH. Target width scaling in a repetitive aiming task: switching between cyclical and discrete units of action. Experimental Brain Research. 2006;175:710–725. doi: 10.1007/s00221-006-0589-1. [DOI] [PubMed] [Google Scholar]
- Burgess-Limerick R, Neal RJ, Abernethy B. Against relative timing invariance in movement kinematics. Quarterly Journal of Experimental Psychology Section A. 1992;44(4):705–722. doi: 10.1080/14640749208401306. [DOI] [PubMed] [Google Scholar]
- Doeringer JA, Hogan N. Intermittency in preplanned elbow movements persists in the absence of visual feedback. Journal of Neurophysiology. 1998;80:1787–1799. doi: 10.1152/jn.1998.80.4.1787. [DOI] [PubMed] [Google Scholar]
- Dunlap K. Reactions to rhythmic stimuli, with attempts to synchronize. Psychological Review. 1910;17:399–416. [Google Scholar]
- Engström DA, Kelso JAS, Holroyd T. Reaction-anticipation transitions in human perception-action cycles. Human Movement Science. 1996;15:809–832. [Google Scholar]
- Fitts PM. The information capacity of the human motor system in controlling the amplitude of movement. Journal of Experimental Psychology. 1954;47(6):381–391. [PubMed] [Google Scholar]
- Fitts PM, Peterson JR. Information capacity of discrete motor responses. Journal of Experimental Psychology. 1964;67:103–112. doi: 10.1037/h0045689. [DOI] [PubMed] [Google Scholar]
- Gentner DR. Timing of skilled motor performance: Tests of the proportional duration model. Psychological Review. 1987;94(2):255–276. [Google Scholar]
- Goodman L, Riley MA, Mitra S, Turvey MT. Advantages of rhythmic movements at resonance: Minimal active degrees of freedom, minimal noise, and maximal predictability. Journal of Motor Behavior. 2000;32(1):3–6. doi: 10.1080/00222890009601354. [DOI] [PubMed] [Google Scholar]
- Gutnik BJ, Nicholson J, Go W, Gale D, Nash D. Are temporal characteristics of fast oscillating movements invariant? Perceptual and Motor Skills. 2003;96:1027–1039. doi: 10.2466/pms.2003.96.3.1027. [DOI] [PubMed] [Google Scholar]
- Hatsopoulos NG, Warren WH. Resonance tuning in rhythmic arm movements. Journal of Motor Behavior. 1996;28:3–14. doi: 10.1080/00222895.1996.9941728. [DOI] [PubMed] [Google Scholar]
- Herman R, Wirta R, Bampton S, Finley FR. Human solutions for locomotion: I. Single limb analysis. In: Herman R, Grillner S, Stein P, Stuart D, editors. Neural control of locomotion. New York: Plenum; 1976. pp. 13–49. [Google Scholar]
- Holt KG, Jeng SF, Radcliffe R, Hamill J. Energetic cost and stability during human walking at the preferred stride frequency. Journal of Motor Behavior. 1995;27:164–178. doi: 10.1080/00222895.1995.9941708. [DOI] [PubMed] [Google Scholar]
- Hoyt DF, Taylor CR. Gait and the energetics of locomotion in horses. Nature. 1981;292:239–240. [Google Scholar]
- Ivry RB, Hazeltine RE. Perception and production of temporal intervals: Evidence for a common timing mechanism. Journal of Experimental Psychology: Human Perception and Performance. 1995;21:3–18. doi: 10.1037//0096-1523.21.1.3. [DOI] [PubMed] [Google Scholar]
- Kelso JAS. Phase transitions and critical behavior in human bimanual coordination. American Journal of Physiology: Regulatory, Integrative and Comparative. 1984;246:R1000–R1004. doi: 10.1152/ajpregu.1984.246.6.R1000. [DOI] [PubMed] [Google Scholar]
- Killeen PR, Weiss NA. Optimal timing and the Weber function. Psychological Review. 1987;94:455–468. [PubMed] [Google Scholar]
- Mates J, Radil T, Müller U, Pöppel E. Temporal integration in sensorimotor synchronization. Journal of Cognitive Neuroscience. 1994;64:332–340. doi: 10.1162/jocn.1994.6.4.332. [DOI] [PubMed] [Google Scholar]
- Miyake Y, Onishi Y, Pöppel E. Two types of anticipation in synchronization tapping. Acta Neurobiologiae Experimentalis. 2004;64:415–426. doi: 10.55782/ane-2004-1524. [DOI] [PubMed] [Google Scholar]
- Murray MP. Gait as a total pattern of movement. American Journal of Physical Medicine. 1967;46:290–333. [PubMed] [Google Scholar]
- Nagasaki H. Asymmetric velocity and acceleration profiles of human arm movements. Experimental Brain Research. 1989;74:319–326. doi: 10.1007/BF00248865. [DOI] [PubMed] [Google Scholar]
- Nishikawa KC, Murray ST, Flanders M. Do arm postures vary with the speed of reaching? Journal of Neurophysiology. 1999;81:2582–2586. doi: 10.1152/jn.1999.81.5.2582. [DOI] [PubMed] [Google Scholar]
- Oldfield RC. The assessment and analysis of handedness: The Edinburgh inventory. Neuropsychologia. 1971;9:97–113. doi: 10.1016/0028-3932(71)90067-4. [DOI] [PubMed] [Google Scholar]
- Peters M. The relationship between variability of intertap intervals and interval duration. Psychological Research. 1989;51:38–42. [Google Scholar]
- Raftery A, Cusumano JP, Sternad D. Chaotic frequency scaling in a coupled oscillator model for free rhythmic actions. Neural Computation. 2008;20(1):205–226. doi: 10.1162/neco.2008.20.1.205. [DOI] [PubMed] [Google Scholar]
- Repp BH. Rate limits of sensorimotor synchronization. Advances in Cognitive Psychology. 2006;2:163–181. [Google Scholar]
- Repp BH, Doggett R. Tapping to a very slow beat: A comparison of musicians and non-musicians. Music Perception. 2007;24:367–376. [Google Scholar]
- Rosenbaum DA, Slotta JD, Vaughan J, Plamondon R. Optimal movement selection. Psychological Science. 1991;2:86–91. [Google Scholar]
- Rosenblum LD, Turvey MT. Maintenance tendency in coordinated rhythmic movements: Relative fluctuations and phase. Neuroscience. 1988;27:289–300. doi: 10.1016/0306-4522(88)90238-2. [DOI] [PubMed] [Google Scholar]
- Teasdale N, Bard C, Fleury M, Young DE, Proteau L. Determining movement onsets from temporal series. Journal of Motor Behavior. 1993;25(2):97–106. doi: 10.1080/00222895.1993.9941644. [DOI] [PubMed] [Google Scholar]
- Turvey MT. Coordination. American Psychologist. 1990;45:938–953. doi: 10.1037//0003-066x.45.8.938. [DOI] [PubMed] [Google Scholar]
- Viviani P, Terzuolo C. Space-time invariance in learned motor skills. In: Stelmach GE, Requin J, editors. Tutorials in motor behavior. Amsterdam: North-Holland; 1980. pp. 525–533. [Google Scholar]
- Wing AM, Kristofferson AB. Response delays and the timing of discrete motor responses. Perception & Psychophysics. 1973;14:5–12. [Google Scholar]
- Yu H, Russell DM, Sternad D. Task-effector asymmetries in a rhythmic continuation task. Journal of Experimental Psychology: Human Perception and Performance. 2003;29(3):616–630. doi: 10.1037/0096-1523.29.3.616. [DOI] [PubMed] [Google Scholar]


