Abstract
Objective
Nonlinear frequency compression attempts to restore high-frequency audibility by lowering high-frequency input signals. Methods of determining the optimal parameters that maximize speech understanding have not been evaluated. The effect of maximizing the audible bandwidth on speech recognition for a group of listeners with normal hearing is described.
Design
Nonword recognition was measured with twenty normal-hearing adults. Three audiograms with different high-frequency thresholds were used to create conditions with varying high-frequency audibility. Bandwidth was manipulated using three conditions for each audiogram: conventional processing, the manufacturer’s default compression parameters, and compression parameters that optimized bandwidth.
Results
Nonlinear frequency compression optimized to provide the widest audible bandwidth improved nonword recognition compared to both conventional processing and the default parameters.
Conclusion
These results showed that using the widest audible bandwidth maximized speech identification when using nonlinear frequency compression. Future studies should apply these methods to listeners with hearing loss to demonstrate efficacy in clinical populations.
INTRODUCTION
Nonlinear frequency compression (NLFC) is hearing aid signal processing designed to increase the audibility of high-frequency sounds by compressing inputs above a start frequency by a specific compression ratio. Speech recognition outcomes with NLFC typically have varied from no mean difference to improvement. Variability has been observed both within groups of subjects in the same study (Simpson et al. 2005; 2006) and across studies (Glista et al. 2009; Bohnert et al. 2010; Wolfe et al. 2010; 2011). The selection method for start frequency and compression ratio for each participant could contribute to the observed variability. Studies that selected these parameters based on maximizing high-frequency audibility (Glista et al. 2009; Wolfe et al. 2010; 2011) have more consistently observed improvements in speech recognition with NLFC than studies that use the highest audible frequency as the start frequency (Simpson et al. 2005; 2006) or listener preference (Bohnert et al. 2010). A standardized method for estimating audibility with NLFC would allow selection of parameters that optimizes outcomes.
The speech intelligibility index (SII; ANSI S3.5-1997) is used to estimate the audibility of speech with and without amplification. However, the validity of the SII for signals where the frequency spectrum has been altered has not been systematically evaluated. Calculation of the audible output could be used to compare audibility across conditions of varying frequency lowering parameters. While improvements in audibility that occur due to NLFC may result in increased access to high-frequency acoustic cues, these improvements could be offset by alterations to the acoustic cues that are important for speech perception. The purpose of the current study was to determine if improvements in audibility from NLFC could be predicted based on a calculation of the audible bandwidth of the output signal for a group of normal hearing listeners. In this study, processing through a hearing aid simulator altered audibility of nonword stimuli. Participants repeated nonwords processed using conventional processing with wide dynamic range compression (WDRC) only, manufacturer default NLFC settings and NLFC optimized for audibility. Nonword recognition was anticipated to increase as estimated bandwidth increased for all conditions. While results from normal-hearing listeners cannot predict performance in listeners with hearing loss, evidence of audibility-based improvements in speech understanding could be used as a paradigm for optimizing NLFC in further investigations of listeners with hearing loss. Additionally, the use of normal-hearing listeners allows for control of bandwidth using the same frequency lowering settings across subjects, which would not be possible in listeners with hearing loss with varying audiometric configurations.
METHOD
Participants
Twenty adults (mean age = 25 years, SD = 3.26, range = 19 – 31) participated. All had clinically normal hearing with thresholds < 20 dB HL at octave frequencies between 250 and 8000 Hz. Subjects were recruited from the Boys Town Human Research Subjects Core Database and consented to participation.
Stimuli
Stimuli were consonant-vowel-consonant (CVC) nonword stimuli that were developed for another study (McCreery & Stelmachowicz, 2011). Nonwords were selected using an online calculator to remove real words and combinations of phonemes that do not occur in English (Storkel & Hoover, 2010). The nonwords had /f/, /ʤ/, /s/, /ʃ/, /θ/, /ð/, /v/, /z/, and /ʒ/ in either the initial or final position. These 250 stimuli were divided into ten lists with fricative and affricate content balanced across the lists for initial and final positions. Vowel context was balanced across lists. A 22 year-old female talker spoke each stimulus.
Procedure
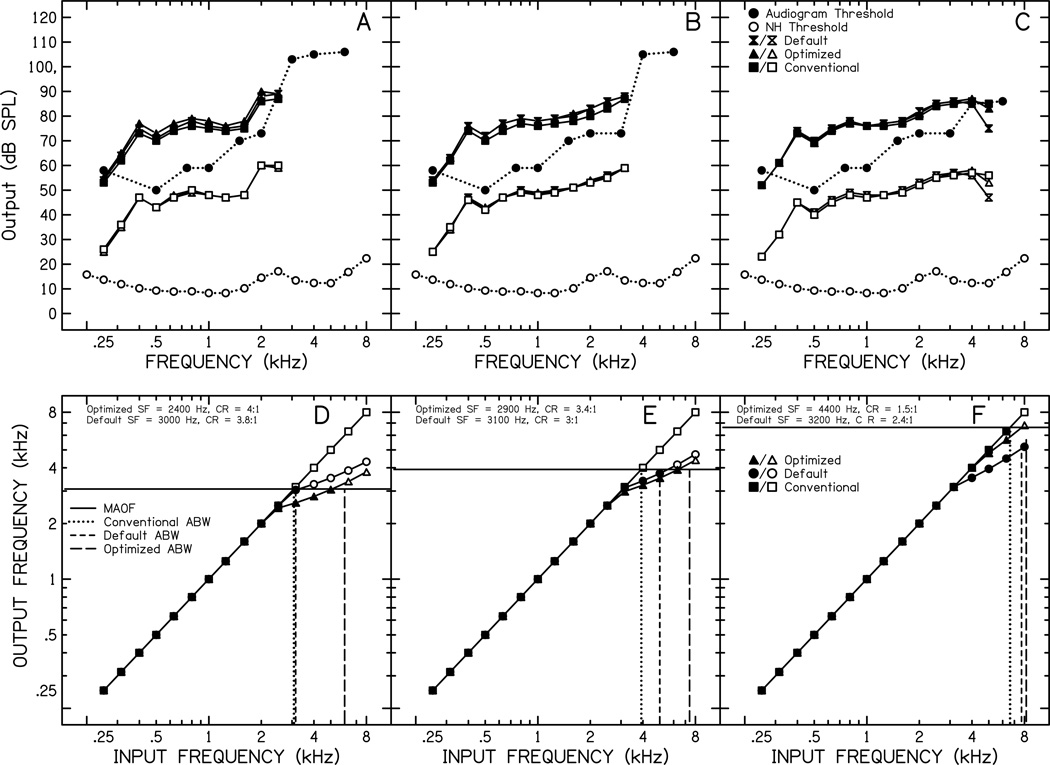
1. To create processing conditions with varying high-frequency audibility, three audiograms were used (Figure 1, A–C, filled circles). All three audiograms were identical from 250 Hz through 2000 Hz with thresholds of 40 dB HL at 250 Hz and 500 Hz, 50 dB HL at 1000 Hz and 60 dB HL at 2000 Hz. Audiogram A had thresholds of 90 dB HL at 3000 Hz and above, Audiogram B had thresholds of 90 dB HL at 4000 Hz and above, and Audiogram C had thresholds of 70 dB at 4000 Hz and above.
Figure 1.
Output in one-third octave band level in an IEC 711 coupler attached to KEMAR for amplified (filled: hourglass, triangle, square) and normalized (open: hourglass, triangle, square) long-term average speech spectra are shown in panels A–C with each panel corresponding to the same letter audiogram. Thresholds for normal hearing are plotted as open circles and the thresholds for each audiogram are plotted as the filled circles. Panels D-F display the audible bandwidth for each audiogram and condition as frequency input/output functions for each type of processing with filled symbols representing audible frequencies and open symbols representing inaudible frequencies. Differences in the audible bandwidth among the processing types are indicated by the frequency where the vertical lines intersect the horizontal line representing maximum audible output frequency (MAOF). NH = normal hearing; SF = start frequency; CR = compression ratio; ABW = audible bandwidth.
2. Frequency compression parameters were determined for each audiogram. The default condition used the frequency compression settings that the Phonak programming software prescribed for a Phonak Naida SP. The optimized condition used frequency compression settings based on the audible bandwidth quantified using the steps illustrated in Figure 1, D–F. First, the output for a Phonak Naida SP hearing aid was matched to DSL v5 (Scollie et al. 2005) using an average adult RECD transform. Then, the lowest frequency where the average of the long-term speech spectrum intersected the audiogram was determined to be the maximum audible output frequency (MAOF: 2.5 kHz in panel A). Finally, the MAOF and the SoundRecover Fitting Assistant (2010) were use to select the frequency compression settings that maximized the audible bandwidth (ABW: panels D–F). The conventional condition limited the maximum frequency to that of a hearing aid without NLFC for each audiogram.
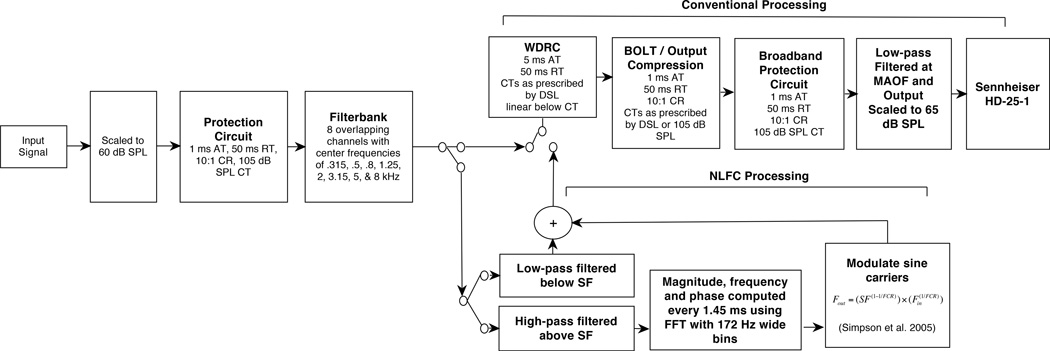
3. The stimuli were processed as illustrated in Figure 2. The output levels after processing are shown as filled hourglass (default), triangle (optimized) and circle (conventional) symbols in panels A–C of Figure 1.
Figure 2.
Hearing aid simulator. Sampling rate was 22050 Hz, compression characteristics were based on the ANSI S3.22-2009 standard, and the equation d (n) = αd (n-1) + (1-α) \x(n)\ if \x(n)\ ≥ d(n-1) else d(n) = βd(n-1) was used to control the gain (Kates 2008), where x(n) is the input signal, d(n)is the output signal, α is the attack time, and β is the release time. If the signal is increasing in level, then the first part of the equation applies otherwise the second part applies. The simulator was programmed to match DSL v5 targets in an IEC 711 coupler attached to KEMAR. Because DSL does not define a target level for the 8 kHz band, a target level was derived that provided the same sensation level as the 6 kHz target. The minimum and maximum gain was limited to 0 and 65 dB, respectively. Frequency compression was applied for the default and optimized conditions using an based onSimpson et al. (2005). Only amplitude compression (WDRC) processing was applied for the conventional condition. AT, attack time; CR, amplitude-compression ratio; CT, compression threshold; FCR, frequency-compression ratio; Fin, input frequency; Fout, output frequency; FFT, Fast-Fourier Transform; RT, release time; SF, start frequency
4. The stimuli were then normalized to 65 dB SPL prior to presentation and low-pass filtered with a brick-wall filter at 2500 Hz (audiogram A), 3600 Hz (audiogram B), or 5200 Hz (audiogram C) to simulate the MAOF (open symbols in panels A–C).
All of the test procedures were completed in a sound-treated test room. Pure-tone thresholds were obtained using TDH-49 earphones. Participants were instructed that they would hear a list of words that were not real words and to repeat exactly what they heard. Each subject completed a practice condition without amplification processing. Following completion of the practice trial, the speech recognition task was completed using one 25-item list per condition. Presentation order of conditions for audiogram (3 levels) and fitting method (conventional, default NLFC, and optimized NLFC) were randomized across subjects using a Latin Squares method. The stimulus list and presentation order of the stimuli within each list were randomized.
Scoring of nonwords was completed offline by two independent and blinded raters using audio-visual recordings for three of the participants. The Cohen’s kappa for scoring between the two examiners was 0.998 for words and 0.996 for phonemes. Given high inter-rater reliability, only one rater scored the remaining subjects.
RESULTS
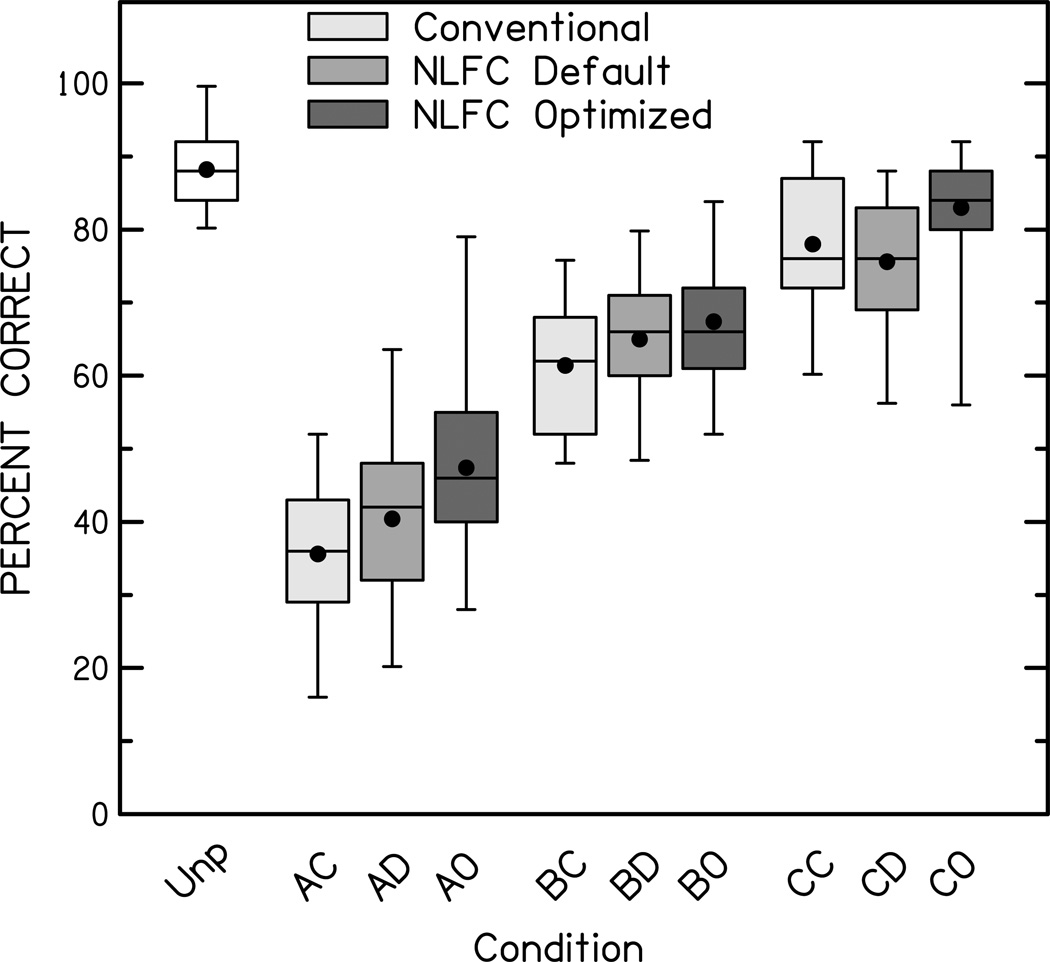
Figure 3 shows nonword recognition for each condition. Recognition across conditions was evaluated using repeated-measures ANOVA with audiogram (A, B, and C) and fitting method (conventional, default, or optimized) as factors. The main effect for audiogram was significant, F(2,38) = 197.838, p < .001, ŋp2 =.912. Post hoc tests using Bonferroni adjustment for multiple comparisons revealed significant differences in the average performance across all three audiograms with the lowest average performance for Audiogram A (Mean = 41.1% correct, SD=1.8%), followed by Audiogram B (Mean = 64.6%, SD=1.5%) and Audiogram C (Mean = 78.9%, SD = 1.2%). The main effect for fitting method also was significant, F(2,38) = 13.248, p<.001, ŋp2 =.411. Post hoc tests using Bonferroni adjustment indicated that the optimized fitting method resulted in significantly higher speech recognition (Mean= 65.9%, SD=1.3%) than the default fitting method (Mean=60.3%, SD=1.4%) and conventional condition without NLFC (Mean=58.3%, SD=1.4%). The difference between default and conventional processing was not significant. The two-way interaction between audiogram and fitting method was not significant, F(4,76) = 1.655, p = .169, ŋp2 =.080, suggesting that the main effect for the fitting method on nonword recognition was the same across the three audiograms.
Figure 3.
Percent correct nonword recognition for each condition. Boxes represent the interquartile range (25th – 75th percentile), error bars represent the range of the 5th – 95th percentiles. Medians are plotted as lines within each box. Black circles are means for each condition. Conditions are noted by: Unp = Unprocessed; First letter: A,B,C= Audiogram A,B,C, respectively; Second letter: C=Conventional Processing, D = Default NLFC settings, O = Optimized NLFC settings.
DISCUSSION
The current study sought to evaluate whether speech recognition of stimuli processed by NLFC followed predictions of audibility based on estimation of the audible bandwidth in listeners with normal hearing. Overall, speech recognition followed predictions of audibility based on bandwidth. Specifically, speech recognition improved across conditions as estimated audibility and bandwidth increased. For all three audiograms, the manufacturer’s default setting did not provide maximum audible output bandwidth. In contrast, start frequencies and compression ratios optimized for audibility resulted in superior nonword recognition. These results suggest that, for the limited range of settings tested in the current study, optimizing NLFC parameters to maximize audibility could provide an effective method of improving perception.
These results should be verified in children and adults with hearing loss to determine if the same patterns are observed in listeners who use amplification. Speech perception studies have demonstrated that adults with hearing loss experience improvements in speech understanding as high-frequency audibility increased (Hornsby, et al. 2011). However, several factors may limit generalization of the current results to listeners with hearing loss. While the stimuli were processed through a hearing aid simulator to alter the audibility of the signal, the presentation level of the signal was reduced to minimize potential loudness discomfort for normal-hearing listeners. Individuals with hearing loss listen to amplified signals at higher levels than used in this study. Degradation in speech recognition as the intensity level increases for listeners with hearing loss has been reported (Dubno et al. 2005). Such degradation was not a factor in the current study and the extent to which it would occur in listeners with hearing loss could offset audibility-based improvements in perception. Listeners with normal hearing in the current study also had access to the entire dynamic range of speech, given the relatively high sensation level of stimuli presented at 65 dB SPL. Listeners with hearing loss would hear these stimuli at a comparatively reduced sensation level, limiting access to softest speech cues that could fall below threshold. If the improvements observed in this study are dependent on the audibility of the least intense speech cues, similar improvements may not be observed in listeners with hearing loss. Finally, improving audibility in listeners with greater degrees of hearing loss may necessitate lower start frequencies and higher compression ratios than used in the current study. Lower start frequencies and higher compression ratios are likely to alter the spectral characteristics of the speech signal more significantly than the settings simulated in the current study. Further research is necessary to resolve these issues before audibility estimation for compressed signals could be applied clinically.
ACKNOWLEDGMENTS
The authors wish to express their thanks to Prasanna Aryal for computer programming assistance and Josh Alexander for theoretical support and the code for the hearing-aid simulator. This research was supported by a grant to the first author from NIH NIDCD (F31-DC010505), a grant to the fifth author (R01 DC04300) and the Post-doctoral training (T32 DC00013) and Human Research Subjects Core (P30-DC004662) grants for Boys Town National Research Hospital.
Footnotes
Publisher's Disclaimer: This is a PDF file of an unedited manuscript that has been accepted for publication. As a service to our customers we are providing this early version of the manuscript. The manuscript will undergo copyediting, typesetting, and review of the resulting proof before it is published in its final citable form. Please note that during the production process errors may be discovered which could affect the content, and all legal disclaimers that apply to the journal pertain.
References
- ANSI. ANSI S3.5-1997, American National Standard Methods for Calculation of the Speech Intelligibility Index. New York: American National Standards Institute; 1997. [Google Scholar]
- ANSI. ANSI S3.22-2009, American National Standard Specification of Hearing Aid Characteristics. New York: American National Standards Institute; 2009. [Google Scholar]
- Bohnert A, Nyffeler M, Keilmann A. Advantages of a non-linear frequency compression algorithm in noise. Eur Arch Otorhinolaryngol. 2010;267(7):1045–1053. doi: 10.1007/s00405-009-1170-x. [DOI] [PubMed] [Google Scholar]
- Dubno J, Horwitz A, Ahlstrom J. Word recognition in noise at higher-than-normal levels: Decreases in scores and increases in masking. J Acoust Soc Am. 2005;118:914–922. doi: 10.1121/1.1953107. [DOI] [PubMed] [Google Scholar]
- Glista D, Scollie S, Bagatto M, Seewald R, Parsa V, Johnson A. Evaluation of nonlinear frequency compression: clinical outcomes. Int J Audiol. 2009;48:632–644. doi: 10.1080/14992020902971349. [DOI] [PMC free article] [PubMed] [Google Scholar]
- Hornsby B, Johnson E, Picou E. Effects of degree and configuration of hearing loss on the contribution of high- and low-frequency speech information to bilateral speech understanding. Ear Hear. 2011;32:543–555. doi: 10.1097/AUD.0b013e31820e5028. [DOI] [PMC free article] [PubMed] [Google Scholar]
- Kates JM. Digital hearing aids. San Diego: Plural Publishing; 2008. [Google Scholar]
- McCreery R, Stelmachowicz P. Audibility-based predictions of speech recognition for children and adults with normal hearing. J Acoust Soc Am. 2011;130:4070–81. doi: 10.1121/1.3658476. [DOI] [PMC free article] [PubMed] [Google Scholar]
- Scollie S, Seewald R, Cornelisse L, Moodie S, Bagatto M, Laurnagaray D, Beaulac S, et al. The desired sensation level multistage input/output algorithm. Trends in Amplif. 2005;9:159–197. doi: 10.1177/108471380500900403. [DOI] [PMC free article] [PubMed] [Google Scholar]
- Simpson A, Hersbach A, McDermott H. Improvements in speech perception with an experimental nonlinear frequency compression hearing device. Int J Audiol. 2005;44:281–292. doi: 10.1080/14992020500060636. [DOI] [PubMed] [Google Scholar]
- Simpson A, Hersbach A, McDermott H. Frequency-compression outcomes in listeners with steeply sloping audiograms. Int J Audiol. 2006;45:619–629. doi: 10.1080/14992020600825508. [DOI] [PubMed] [Google Scholar]
- SoundRecover Fitting Assistant [Computer Program]. Version 1.10. West Lafayette, IN: Joshua Alexander; 2010. [Google Scholar]
- Storkel H, Hoover J. An online calculator to compute phonotactic probability and neighborhood density on the basis of child corpora of spoken American English. Behav Res Methods. 2010;42:497–506. doi: 10.3758/BRM.42.2.497. [DOI] [PMC free article] [PubMed] [Google Scholar]
- Wolfe J, John A, Schafer E, Nyffeler M, Boretzki M, Caraway T. Evaluation of nonlinear frequency compression for school-age children with moderate to moderately severe hearing loss. J Am Acad Audiol. 2010;21:618–28. doi: 10.3766/jaaa.21.10.2. [DOI] [PubMed] [Google Scholar]
- Wolfe J, John A, Schafer E, Nyffeler M, Boretzki M, Caraway T, Hudson M. Long-term effects of non-linear frequency compression for children with moderate hearing loss. Int J Audiol. 2011;50:396–404. doi: 10.3109/14992027.2010.551788. [DOI] [PubMed] [Google Scholar]


