

Abstract
A key clinical outcome for peripheral vascular disease (PVD) in patients is a progressive decay in skeletal muscle performance and its ability to resist fatigue with elevated metabolic demand. We have demonstrated that PVD in obese Zucker rats (OZR) is partially due to increased perfusion distribution heterogeneity at successive microvascular bifurcations within skeletal muscle. As this increased heterogeneity (γ) is longitudinally present in the network, its cumulative impact is a more heterogeneous distribution of perfusion between terminal arterioles than normal, causing greater regional tissue ischemia. To minimize this negative outcome, a likely compensatory mechanism against an increased γ should be an increased temporal switching at arteriolar bifurcations to minimize downstream perfusion deficits. Using in situ cremaster muscle, we determined that temporal activity (the cumulative sum of absolute differences between successive values of γ, taken every 20 s) was lower in OZR than in control animals, and this difference was present in both proximal (1A-2A) and distal (3A-4A) arteriolar bifurcations. Although adrenoreceptor blockade (phentolamine) improved temporal activity in 1A-2A arteriolar bifurcations in OZR, this was without impact in the distal microcirculation, where only interventions against oxidant stress (Tempol) and thromboxane A2 activity (SQ-29548) were effective. Analysis of the attractor for γ indicated that it was not only elevated in OZR but also exhibited severe reductions in range, suggesting that the ability of the microcirculation to respond to any challenge is highly restricted and may represent the major contributor to the manifestation of poor muscle performance at this age in OZR.
Keywords: rodent models of obesity, microcirculation, skeletal muscle blood flow regulation, models of peripheral vascular disease, blood flow heterogeneity, vascular dysfunction
with ongoing study, there is increasing appreciation that the transition from healthy physiology to disease states represents a change in the overall system of control from an existing normal structure (46). It is also generally unclear whether this transition represents a failure of the healthy system or evolving compensations to attempt to optimize the most critical biological outcomes despite progression of a challenged environment (38, 57). For this reason, a detailed understanding of which major contributing processes to an outcome are altered with pathology and the extent for which these are compensated is critical for developing appropriate therapeutic interventions. Failure to elucidate both the key sites of impairment and the compensatory mechanisms, as well as how these impact functional outcomes, has resulted in poorly targeted interventional measures.
Although the existing literature contains extensive prior interrogation into the effects of atherosclerotic peripheral vascular disease on perfusion and performance outcomes in multiple model systems as well as the identification of many putative mechanistic contributors to plaque/lesion development (1, 9, 20, 27, 30, 39), investigation into the impact of nonatherosclerotic peripheral vascular disease (PVD) has received a much more limited investment. Although underrepresented to date, this is an exceedingly important area of investigation, since a growing body of evidence suggests that an increasing number of human subjects are afflicted with the symptomology of PVD in the absence of overt plaque/lesion development (12, 19, 31, 44, 45).
Based on its origin in a dysfunctional leptin receptor gene, destroying the satiety reflex, the obese Zucker rat (OZR) experiences a chronic hyperphagia, developing severe obesity, a progressive worsening of glycemic control and plasma lipid profiles and, ultimately, the development of moderate hypertension (32, 37). The importance of the OZR model for studying nonatherosclerotic PVD is considerable, since the genesis of the pathological state lies within the leptin resistance-induced hyperphagia, which is found in the human population (53, 56). Furthermore, the severity of the elevated risk factors for a negative cardiovascular outcome has repeatedly been demonstrated to be comparable with that determined in afflicted patients, and these animals do not develop atherosclerotic lesions.
A recent study has provided clear and compelling evidence that impairments to skeletal muscle performance that are associated with development of nonatherosclerotic PVD in OZR are not adequately predicted by basic indexes such as the mechanical responses of resistance arterioles to stimuli or by bulk blood flow responses to skeletal muscle (25). Rather, we have recently demonstrated that a defining characteristic of nonatherosclerotic PVD in OZR skeletal muscle is an increasingly asymmetric blood flow distribution at successive microvascular bifurcations, resulting in pronounced heterogeneity of perfusion across the distal arterioles within the network (24, 59). Although this increased spatial heterogeneity of perfusion distribution was improved by interventions against reactive oxygen stress, the actions of thromboxane, and altered function within adrenergic vasoconstriction (24, 59), the question of the system compensation for this increased perfusion heterogeneity in OZR is entirely unknown. Conceptually, a likely compensation for the increased spatial heterogeneity of perfusion in the microcirculation of OZR could be via increased temporal switching at arteriolar bifurcations. Because the spatial heterogeneity between parallel daughter arterioles would create relative degrees of downstream ischemic signals between the parallel perfused regions, a compensation that resulted in increased temporal switching between high flow and low flow daughter arterioles would help to minimize the severity and duration of the resulting ischemic regions and could act to maintain muscle performance to the greatest possible extent.
Given this conceptual framework, the purpose of the present study was to determine the degree of temporal switching at arteriolar bifurcations within the resting skeletal muscle microcirculation of OZR versus lean Zucker rats (LZR), the extent to which this acts as a compensatory physiological mechanism to the increased spatial perfusion heterogeneity and to determine the major contributing mechanisms to differences between the two conditions. This study tested the hypothesis that temporal switching at arteriolar bifurcations is increased in skeletal muscle of OZR as a means for compensating for the increased spatial perfusion heterogeneity and helping to maintain skeletal muscle performance at optimal levels despite the evolving pathological state.
MATERIALS AND METHODS
Animals.
Male lean (total n = 20; Harlan) and obese Zucker rats (total n = 38; fa-/fa-; Harlan) were fed standard chow and drinking water ad libitum and were housed in the animal care facility at the West Virginia University Health Sciences Center or the Medical College of Wisconsin. All protocols received prior Institutional Animal Care and Use Committee (IACUC) approval. At ∼17 wk of age, rats were anesthetized with injections of pentobarbital sodium (50 mg/kg ip) and received tracheal intubation to facilitate maintenance of a patent airway. In all rats, a carotid artery and an external jugular vein were cannulated for determination of arterial pressure and for infusion of supplemental anesthetic and pharmacological agents, as necessary. Any animal in which mean arterial pressure (MAP) was found to be below 85 mmHg or where MAP had decreased by more than 15% from that following this initial surgery (without any pharmacological intervention) was not used in the present study. Blood samples were drawn from the venous cannula for determination of glucose and insulin concentrations (Millipore, Billerica, MA) as well as cholesterol/triglyceride levels (Wako Diagnostics, Richmond, VA), and nitrotyrosine (Oxis International, Foster City, CA). Unless otherwise noted, all drugs and chemicals were purchased from Sigma-Aldrich (St. Louis, MO).
Preparation of in situ cremaster muscle.
In each rat (LZR, n = 20; OZR, n = 38), an in situ cremaster muscle was prepared for intravital microscopy (2, 26, 35) and was continuously superfused with PSS equilibrated with a 5% CO2-95% N2 gas mixture, maintained at 35°C, as it flowed over the muscle. Volume flow rate was ∼3.0 ml/min. The ionic composition of the PSS was as follows (in mM) 119.0 NaCl, 4.7 KCl, 1.6 CaCl2, 1.18 NaH2PO4, 1.17 MgSO4, 24.0 NaHCO3, and 0.03 disodium EDTA. After a 30-min period of equilibration following the surgical preparation, arterioles and bifurcations within two distinct bifurcation categories were selected for investigation: 1) ∼100 μm parent to ∼80 μm daughters (1A-2A) and 2) ∼60 μm parent to ∼40 μm daughters (3A-4A). Arterioles/bifurcations were selected based on the following criteria: 1) distance from any site of incision, 2) presence of significant vascular tone (assessed by brisk dilator response to challenge with 10−3 M adenosine), 3) clearly discernible walls, 4) a rapid and stable level of erythrocyte perfusion, and 5) the presence of two clearly defined daughter branches that also met criteria 1–4. Please see Fig. 1 for a schematic representation (also Ref. 24).
Fig. 1.

Schematic representation of an arteriolar bifurcation used for study. Presented are the key measured parameters of arteriolar diameter and erythrocyte velocity, which are used to calculate blood flow volumes. Perfusion distribution volumes are given as the proportionality parameter γ and (1-γ) in the two daughter arterioles arising from a parent. RBC, red blood cell.
The mechanical (using on-screen videomicroscopy) and perfusion (using optical Doppler velocimetry) responses of both the parent and daughter arterioles within a bifurcation class were assessed under resting conditions within the cremaster muscle of each rat. All procedures were performed under control conditions in LZR and OZR and after treatment of the in situ cremaster muscle with the antioxidant Tempol (10−3 M), the TxA2 receptor antagonist SQ-29548 (10−4 M), and/or the α1/α2-adrenergic receptor antagonist phentolamine (10−5 M), within the superfusate solution. All treatments to the cremaster were of a minimum of 40 min duration before any subsequent experimental manipulation/data collection.
Interrogation of arteriolar bifurcations.
Within each animal, one 1A-2A bifurcation and one 3A-4A bifurcation was studied within the arteriolar network. For an individual measurement, arteriolar diameter and erythrocyte velocity were monitored for 5 min, with measurements taken every 20 s. All arterioles and bifurcations were selected on the basis of the criteria outlined above and were placed into their categories by size rather than by strict branch number within the network.
To maintain preparation and collected data quality, no cremaster muscle was exposed to all interventions and combinations listed above. In addition to the collection of responses under control conditions, individual cremaster preparations were exposed to a maximum of four interventions, each separated by ∼30 min of washout. Treatment or washout effectiveness was verified by determining abolition or recovery of mechanical responses following challenge with appropriate agonists (e.g., the α1-adrenergic antagonist phenylephrine, the stable TxA2 mimetic U-46619, and the endothelium-dependent dilator agonist acetylcholine for the appropriate initial treatments). Maximum experimental duration from preparation to termination was ∼4 h, after which time all animals were humanely euthanized by an intravenous overdose of anesthetic followed by a bilateral pneumothoracotomy, as per approved IACUC protocols.
Data and statistical analyses.
Arteriolar perfusion in both parent and daughter vessels within in situ cremaster muscle of LZR and OZR was calculated as Q = V × 1.6−1)(πr2)(0.001), where Q represents arteriolar perfusion (in nl/s), V represents the measured red cell velocity from the optical Doppler velocimeter (in mm/s; with V/1.6 representing an estimated average velocity assuming a parabolic flow profile; Ref. 18), and r represents arteriolar radius (in μm; Ref. 4).
The total volume perfusion in the daughters was determined as the sum of the individual perfusion rates, and the proportion of flow within each was determined as the quotient of the individual branch divided by the total. γ is defined as the ratio of the greater of the two flows in the daughter vessel to the total flow in the parent vessel. As an example, if flow distribution was homogeneous between daughters, γ for that bifurcation would be 0.5 in both daughter arterioles, whereas if the proportion of flow in one daughter arteriole was 60%, for that bifurcation would be 0.6, with flow distribution being 0.6 in the high perfusion arteriole and 0.4 in the low perfusion arteriole (Fig. 1) (6).
Monitoring γ throughout the observation period and analyzing those resulting data used three initial approaches. The first of these was simply to determine the means ± SE of the individual measurements throughout the 5-min observation window, providing the mean value for γ. However, this is clearly not sufficiently informative in terms of understanding the temporal behavior for γ at a bifurcation. The second approach was to determine the cumulative change in γ from each of the 15 successive measurements: ∑t=115(y(t) − y(t+1)), where γ represents the perfusion distribution at any given bifurcation and t represents the measurement time from 1 (initial) to 15 (final). Although these data can provide us with evidence of broader changes in γ with longer durations, it was apparent that a more sensitive marker is needed to provide sufficient insight into temporal switching at an arteriolar bifurcation. As such, the final approach is to summate the absolute values of the differences in γ from one time point to the next to provide for a superior index of total activity: ∑t=115 ABS{(y(t) − y(t+1))}.
This final index (summating absolute difference in γ) will provide insight into the total temporal switching at any arteriolar bifurcation within the data collection window.
To determine the effectiveness of any intervention on improving the behavior of γ over the data collection window in OZR, the values for the γ (cumulative, absolute differences) that were collected for arteriolar bifurcations in LZR under control conditions (A) were set as the overall control value. As such, the impact of pathology (development of the metabolic syndrome) is determined from the data collected in OZR under control conditions (B) and is the absolute difference between these two values: x = ABS(A − B). The extent to which any intervention in OZR can improve normal behavior is given by the value of γ (cumulative, absolute) following the intervention (C) and is represented by y = ABS(B − C). Given this, the percent effectiveness of any intervention in restoring the normal behavior of γ at a bifurcation in OZR is provided by z = (y/x) × 100.
An attractor is generally defined as the set of conditions toward which a given variable evolves over time. To a significant extent, this can be considered as the representation of the behavior of a dynamic system over a period of time, and this can be extremely useful in understanding the limits of a system (i.e., what behaviors are either not possible, not generally attainable, or are extremely unlikely) and the effects on system behavior (either beneficial or detrimental) subsequent to an imposed intervention. The most informative manner in presenting an attractor is as an iterated map, where the current state of the parameter under study is plotted at a given moment and then its change in position replotted at the next time interval. This process is iterated repeatedly, to the conclusion of the data set, and the shape and location of the attractor on the coordinate system becomes evident. This approach also facilitates comparisons between experimental conditions and the impact these have on the location and shape of the attractor.
All data throughout the manuscript are presented as means ± SE. Statistically significant differences in measured and calculated parameters were determined using a one sample t-test (differences from 0), Student's t-test, or ANOVA with Student-Newman-Keuls post hoc test used as needed. In all cases, P < 0.05 was taken to reflect statistical significance.
RESULTS
Table 1 presents the baseline characteristics of animals used in the present study. By ∼17 wk of age, OZR demonstrated striking obesity and had a significantly higher mass than LZR. Furthermore, OZR exhibited statistically significant elevation in mean arterial pressure, and both plasma insulin and nitrotyrosine concentrations. Data describing the dimension and perfusion characteristics of the cremasteric arteriolar bifurcation segments (described above) under the conditions of the present study are summarized in Table 2. These data clearly demonstrate general differences between arteriolar diameter and perfusion characteristics that are distributed longitudinally throughout the cremasteric microcirculation under the conditions of the present study.
Table 1.
Baseline characteristics of ∼17-wk-old LZR and OZR used in the present study
| LZR | OZR | |
|---|---|---|
| n | 20 | 38 |
| Mass, g | 357 ± 9 | 676 ± 10* |
| MAP, mmHg | 104 ± 4 | 135 ± 6* |
| [Glucose]plasma, mg/dl | 106 ± 9 | 188 ± 12* |
| [Insulin]plasma, ng/ml | 1.7 ± 0.2 | 8.8 ± 1.3* |
| [Nitrotyrosine]plasma, ng/ml | 17 ± 4 | 53 ± 7* |
Values are means ± SE.
P < 0.05 vs. lean Zucker rats (LZR). OZR, obese Zucker rats; MAP, mean arterial pressure.
Table 2.
Arteriolar perfusion in LZR and OZR
| LZR | OZR | O-P | O-T | O-SQ | O-PT | O-PSQ | O-TSQ | O-PTSQ | |
|---|---|---|---|---|---|---|---|---|---|
| 1A | |||||||||
| ID | 95 ± 4 | 81 ± 5 | 93 ± 4 | 83 ± 5 | 84 ± 6 | 93 ± 4 | 94 ± 4 | 85 ± 5 | 94 ± 4 |
| VRBC | 56 ± 6 | 42 ± 6 | 53 ± 6 | 46 ± 5 | 44 ± 5 | 53 ± 5 | 53 ± 6 | 47 ± 4 | 54 ± 5 |
| Q | 248 ± 12 | 135 ± 15* | 225 ± 16† | 156 ± 13 | 152 ± 11 | 225 ± 9† | 230 ± 15† | 167 ± 11 | 234 ± 12† |
| 2A | |||||||||
| ID | 70 ± 5 | 60 ± 6 | 67 ± 5 | 64 ± 4 | 63 ± 5 | 68 ± 4 | 68 ± 5 | 64 ± 4 | 69 ± 4 |
| VRBC | 50 ± 4 | 34 ± 6 | 47 ± 6 | 38 ± 6 | 36 ± 4 | 46 ± 5 | 48 ± 4 | 41 ± 5 | 49 ± 5 |
| Q | 120 ± 12 | 60 ± 7* | 104 ± 11† | 76 ± 10 | 70 ± 6 | 104 ± 6† | 109 ± 7† | 82 ± 12 | 115 ± 7† |
| 3A | |||||||||
| ID | 54 ± 5 | 46 ± 6 | 50 ± 5 | 51 ± 6 | 49 ± 4 | 53 ± 4 | 52 ± 4 | 51 ± 5 | 53 ± 5 |
| VRBC | 35 ± 6 | 24 ± 4 | 34 ± 6 | 25 ± 5 | 27 ± 4 | 35 ± 4 | 36 ± 4 | 27 ± 4 | 36 ± 4 |
| Q | 50 ± 5 | 25 ± 4* | 42 ± 4† | 32 ± 6 | 32 ± 4 | 48 ± 5† | 48 ± 5† | 33 ± 5 | 50 ± 6† |
| 4A | |||||||||
| ID | 37 ± 5 | 32 ± 4 | 33 ± 5 | 38 ± 5 | 37 ± 4 | 38 ± 4 | 38 ± 4 | 37 ± 5 | 38 ± 4 |
| VRBC | 35 ± 5 | 20 ± 5 | 30 ± 5 | 24 ± 4 | 23 ± 3 | 32 ± 4 | 33 ± 5 | 24 ± 5 | 36 ± 5 |
| Q | 24 ± 3 | 10 ± 3* | 16 ± 3 | 17 ± 3 | 15 ± 3 | 23 ± 3† | 23 ± 4† | 16 ± 4 | 26 ± 4† |
Values are means ± SE and presented for arteriolar inner diameter (ID; in μm), centerline erythrocyte velocity (VRBC; in mm/s), and volume perfusion within the arteriole (Q; in nl/s).
P < 0.05 vs. LZR;
P < 0.05 vs. OZR. P, treatment with phentolamine; T, treatment with Tempol; SQ, treatment with SQ-29548, with combinations representing treatment with multiple agents.
Figure 2 presents representative data describing the distribution of the magnitude of γ and its temporal behavior across 1A-2A (Fig. 2, A and B, respectively) and 3A-4A (Fig. 2, C and D, respectively) arteriolar divisions. As suggested by these data, in addition to a shift in the frequency distribution of γ between LZR and OZR at both microvascular divisions, the changes in γ (measured every 20 s over the course of 5 min) were less extensive in both proximal and distal bifurcations of the resting cremaster muscle microcirculation of OZR compared with LZR.
Fig. 2.
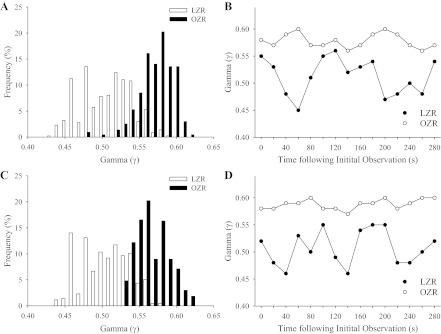
Frequency distribution and representative sample of the temporal changes in γ in 1A-2A (A and B, respectively) and 3A-4A (C and D, respectively) arteriolar bifurcations in lean Zucker rats (LZR) and obese Zucker rats (OZR) under control conditions. For data in B and D, γ is determined every 20 s throughout a 5-min collection window.
Proximal resistance arterioles.
The summarized results of the average magnitude of γ at 1A-2A arteriolar bifurcations over the observation period are presented in Fig. 3. In LZR (Fig. 3A), γ was ∼0.51 under control conditions and was not altered by acute pharmacological intervention. In contrast, average γ over the 5-min period in OZR (Fig. 3B) was much higher, ∼0.58 under control conditions. Although interventions containing phentolamine (regardless of the presence of any other substance) reduced average γ to levels determined in LZR, treatment against either the increased TxA2 production (SQ-29548) or the elevated vascular oxidant stress (Tempol) in OZR were not effective, resulting in minimal changes to γ.
Fig. 3.
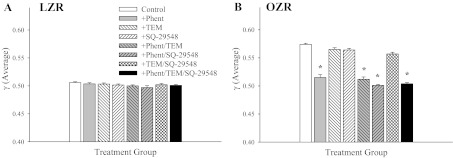
The average γ in 1A-2A arteriolar bifurcations of LZR (A) and OZR (B) over the 5-min collection period. Data (presented as means ± SE) are presented for LZR and OZR under control conditions and in OZR after treatment of the cremaster muscle with phentolamine (Phent), Tempol (Tem), SQ-29548, or combinations of these agents. *P < 0.05 vs. control in that strain.
Data describing the changes in γ in 1A-2A bifurcations between LZR and OZR over the 5-min observation window are summarized in Fig. 4. When presented as the cumulative change in γ, neither LZR (Fig. 4A) nor OZR (Fig. 4B) exhibited a difference between strains or a clear pattern in terms of the cumulative change in γ within a strain. However, when the cumulative changes in γ are presented as the sum of the absolute changes, striking differences are evident. Although a clear reduction in the cumulative change in γ (absolute) was evidence in OZR (Fig. 4D) as compared with LZR (Fig. 4C), blockade of adrenoreceptors (alone or with any other pharmacological intervention) in 1A-2A bifurcations in LZR reduced activity at the bifurcation. In contrast, treatment of elevated oxidant stress with Tempol or blockade of TxA2 with SQ-29548 has no discernible impact. In 1A-2A bifurcations from OZR, treatment with phentolamine (either alone or with Tempol and/or SQ-29548) significantly increased the cumulative change in γ (absolute) over the data collection window (Fig. 4D). Similarly to LZR, treatment with Tempol and/or SQ-29548 in the absence of phentolamine did not have a significant impact.
Fig. 4.
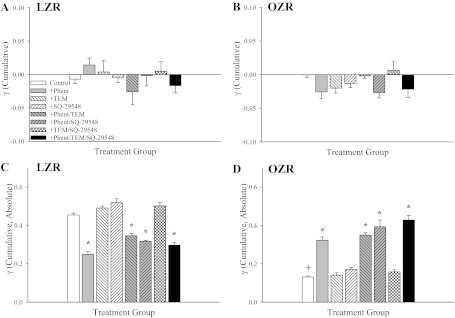
Data describing the cumulative changes in γ over the 5-min collection period in 1A-2A arteriolar bifurcations in LZR and OZR. Data (presented as means ± SE) are presented for LZR and OZR under control conditions and in OZR after treatment of the cremaster muscle with phentolamine (Phent), Tempol (Tem), SQ-29548, or combinations of these agents. Cumulative changes in γ are summated either as differences between successive time points (A and B) or as the absolute differences between successive time points (C and D). *P < 0.05 vs. control in that strain; †P < 0.05 vs. LZR control.
Distal resistance arterioles.
Comparable with data presented for proximal resistance arterioles, the average γ for 3A-4A arteriolar bifurcations over the 5-min period was ∼0.5 in LZR under control conditions (Fig. 5A), and this was elevated in OZR (Fig. 5B). However, although treatment interventions were without effect in LZR, application of either Tempol or SQ-29548 in OZR significantly reduced mean γ toward 0.5. In contrast with the results from more proximal resistance arterioles, γ was largely unaffected by phentolamine treatment and interventions targeted at rectifying endothelial dysfunction were required to cause a significant restoration of γ.
Fig. 5.
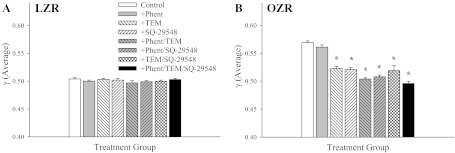
The average γ in 3A-4A arteriolar bifurcations of LZR (A) and OZR (B) over the 5-min collection period. Data (presented as means ± SE) are presented for LZR and OZR under control conditions and in OZR after treatment of the cremaster muscle with phentolamine (Phent), Tempol (Tem), SQ-29548, or combinations of these agents. *P < 0.05 vs. control in that strain.
Figure 6 presents the cumulative changes in γ over the 5-min period in 3A-4A arteriolar bifurcations from LZR (Fig. 6, A and C) and OZR (Fig. 6, B and D). When the changes in γ are presented as simple accumulation, there were no significant differences between LZR (Fig. 6A) and OZR (Fig. 6B) or within a strain as a result of any intervention. However, when the changes in γ are summated as absolute differences, clear differences were identified. In 3A-4A arteriolar bifurcations of LZR (Fig. 6C), acute treatment with phentolamine reduced the accumulated changes to γ, whereas the presence of Tempol and/or SQ-29548 resulted in minimal total changes or marginal change (when applied in combination with each other or with phentolamine). In contrast, application of Tempol and/or SQ-29548 significantly improved the cumulative changes to γ (absolute) in 3A-4A arteriolar bifurcations of OZR, whereas the effects of phentolamine application were muted (Fig. 6D).
Fig. 6.
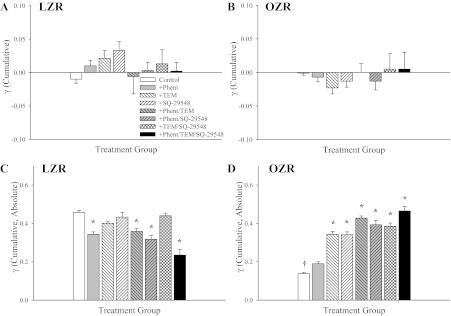
Data describing the cumulative changes in γ over the 5-min collection period in 3A-4A arteriolar bifurcations in LZR and OZR. Data (presented as means ± SE) are presented for LZR and OZR under control conditions and in OZR after treatment of the cremaster muscle with phentolamine (Phent), Tempol (Tem), SQ-29548, or combinations of these agents. Cumulative changes in γ are summated either as differences between successive time points (A and B) or as the absolute differences between successive time points (C and D). *P < 0.05 vs. control in that strain; †P < 0.05 vs. LZR control.
Effects of adenosine.
To simulate the impact of elevated metabolic demand on the temporal stability of γ throughout the cremaster muscle microcirculation, increasing concentrations of adenosine were added to the preparation superfusate. Although application of adenosine had minimal impact on average γ in LZR, it reduced average γ in OZR, at both 1A-2A (Fig. 7A) and 3A-4A (Fig. 7C) bifurcations to levels that were very similar to that determined in LZR, with the greatest impact being observed with the highest level of adenosine (Fig. 7). Adenosine did not impact the cumulative change in γ over the 5-min period in either strain, at either bifurcation location (data not shown). However, when the changes in γ are summated as absolutes, application of increasing concentrations of adenosine reduced temporal activity in LZR at both 1A-2A (Fig. 7B) and 3A-4A (Fig. 7D) bifurcations, although it had minimal impact on activity in the bifurcations of OZR (Fig. 7, B and D).
Fig. 7.
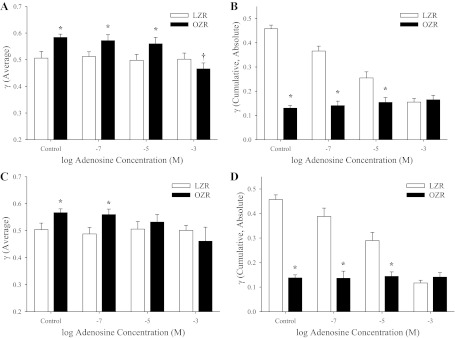
Data describing the changes in γ over the 5-min collection window in proximal and distal arteriolar bifurcations of LZR and OZR in response to increasing concentrations of adenosine. Data (presented as means ± SE) are presented for 1A-2A arteriolar bifurcations either as average γ (A) or as the cumulative changes in γ, summated as absolute differences (B). Similarly, data for 3A-4A arteriolar bifurcations are presented as average γ (C) or as the cumulative changes in γ, summated as absolute differences (D). *P < 0.05 vs. LZR under that condition; †P < 0.05 vs. LZR control.
Effectiveness of interventions in restoring normal behavior.
Figure 8 summarizes the impact of the interventions on restoring normal temporal activity at 1A-2A (Fig. 8A) and 3A-4A (Fig. 8B) arteriolar bifurcations in OZR (where the activity at those bifurcation levels in untreated LZR is defined as control/normal). As shown in Fig. 8A, although there is a significant recovery in function with treatment with the adrenoreceptor antagonist alone, combined therapy of phentolamine with the agents targeted at improving endothelial dysfunction resulted in a dramatic improvement in the temporal behavior of γ at the proximal arteriolar bifurcations of OZR. Conversely, the reverse pattern was evident for distal arteriolar bifurcations of OZR, as treatment with SQ-29548 and/or Tempol resulted in significant improvements to the temporal activity of γ, whereas the combined application with phentolamine resulted in a further marginal improvement to this outcome.
Fig. 8.
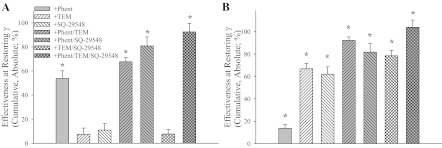
The effectiveness of the employed interventions at restoring normal activity of γ (cumulative, absolute) at 1A-2A (A) and 3A-4A (B) bifurcations in OZR. Normal activity is defined as that determined in arteriolar bifurcations at those 2 sites in LZR. Data (presented as means ± SE) are presented for OZR after treatment of the cremaster muscle with phentolamine (Phent), Tempol (Tem), SQ-29548, or combinations of these agents. *P < 0.05 vs. no change under that condition.
Establishment of a new attractor for PVD.
Figure 9 presents the attractor for γ at 1A-2A arteriolar bifurcations in cremaster muscle of LZR and OZR (control conditions). As show in Fig. 9A, the attractor for changes in γ in OZR was shifted from that in LZR, exhibiting a higher γ, and a smaller range over which γ can move. Treatment with phentolamine (Fig. 9B) was effective in restoring the magnitude of the attractor in OZR compared with that in LZR, although range remained restricted. In contrast, treatment of the cremasteric network with Tempol and/or SQ-29548 was of minimal benefit in restoring the attractor in OZR to that in LZR (Fig. 9C). However, combined treatment with phentolamine and TEMPOL/SQ-29548 almost completely restored the magnitude and the shape of the attractor in OZR to that in LZR. This situation was reversed in distal arteriolar bifurcations of OZR and LZR (Fig. 10), as the shift in the attractor for OZR versus LZR under control conditions (Fig. 10A) was much more strongly impacted by treatment with Tempol and/or SQ-29548 (Fig. 10C) than with phentolamine (Fig. 10B); although combined treatment with phentolamine and Tempol/SQ-29548 still resulted in near complete restoration of the attractor shape and magnitude determined in LZR (Fig. 10D).
Fig. 9.

Presentation of the attractor describing the overall spatial-temporal behavior of γ at 1A-2A arteriolar bifurcations in LZR (blue) and OZR (red) under control conditions (A). The attractors are presented as iterated maps, where the respective value for γ is presented at multiple successive time points within that condition. In subsequent panels, the control data are grayed (light for LZR, dark for OZR) and the effects of the interventions on the attractor are presented in black. This is done for treatment with phentolamine (B), Tempol and/or SQ-29548 (C) and phentolamine and Tempol and/or SQ-29548 (D).
Fig. 10.

Presentation of the attractor describing the overall spatial-temporal behavior of γ at 3A-4A arteriolar bifurcations in LZR (blue) and OZR (red) under control conditions (A). The attractors are presented as iterated maps, where the respective value for γ is presented at multiple successive time points within that condition. In subsequent panels, the control data are grayed (light for LZR, dark for OZR) and the effects of the interventions on the attractor are presented in black. This is done for treatment with phentolamine (B), Tempol and/or SQ-29548 (C) and phentolamine and Tempol and/or SQ-29548 (D).
The effects of increasing adenosine concentration on the attractor in arteriolar bifurcations of OZR are summarized in Fig. 11. In both proximal (Fig. 11A) and distal (Fig. 11B) arteriolar bifurcations, treatment with high concentrations of adenosine (10−3 M) restored the attractor magnitude, but not the full extent of the shape. Lower concentrations of adenosine (10−7 or 10−5 M) were without discernible effect (data not shown). The temporal behavior of γ suggested that, with the highest concentrations of adenosine, there was a less heterogeneous distribution of perfusion at bifurcations, but also that the activity of γ over time remained reduced.
Fig. 11.

Presentation of the attractor describing the overall spatial-temporal behavior of γ at 1A-2A (A) and 3A-4A (B) arteriolar bifurcations in LZR and OZR under control conditions and in response to treatment with 10−3 M adenosine. As described in Figs. 9 and 10, the control data are grayed (light for LZR, dark for OZR) and the effects of the elevated adenosine concentration γ in bifurcations in OZR are presented in black.
DISCUSSION
It has long been understood that the development of nonatherosclerotic PVD, with its implicit failure of appropriate matching of blood perfusion to meet requisite metabolic demand, is associated with a severely compromised ability of the skeletal muscle to maintain performance (i.e., developed tension levels) (19, 44). However, with the use of the OZR model of the metabolic syndrome, it has been clearly demonstrated that blood-perfused skeletal muscle rates of fatigue are increased as compared with LZR and that this compromised performance is not simply a function of global ischemia (25). Rather, treatment with an adrenoreceptor antagonist and a substantial restoration of functional hyperemia, muscle fatigue rates, and oxygen uptake (VO2) remained compromised in OZR as compared with LZR. It was only after combined treatment with both the adrenoreceptor antagonist and interventions ameliorating endothelial dysfunction (the antioxidant Tempol and/or the PGH2/TxA2 receptor antagonist SQ-29548) that muscle performance and VO2 were improved. These results strongly suggest a spatial divergence with regard to dysfunction wherein altered adrenoreceptor function primarily impacts bulk perfusion resistance while altered endothelial function primarily impairs perfusion:demand matching in the distal microvasculature (25). We have interrogated this spatial divergence in blood flow control in skeletal muscle of OZR and have determined that a defining characteristic of PVD in this model is an increasingly heterogeneous distribution of blood flow at successive bifurcations within the arteriolar network (defined by the proportionality parameter: γ). The deviation of γ from 0.5 (homogeneous distribution) is not only strongly predictive of poor muscle performance, it was determined to be longitudinally consistent down the arteriolar network, and was demonstrated to lead to severe increases in blood flow distribution at the precapillary level in OZR as compared with LZR (24, 59).
The elevated γ at arteriolar bifurcations and increased spatial heterogeneity of perfusion distribution represent a deviation from the normal system behavior identified in microvascular networks of LZR. However, as with the majority of biological systems, compensatory mechanisms that can minimize the impact of the increased spatial heterogeneity in perfusion should be present. Logically, the most likely compensatory mechanism would be an increased temporal switching at the individual bifurcations (an increased rate of change with regard to which daughter represents the high or low flow branch, or at least in the severity of the change in γ), which would serve to minimize the extent to which signals associated with any developed ischemic signals accumulate within a low flow branch. Although the nature of these signals is not fully clear at this time, with potential contributors stemming from the buildup of parenchymal tissue metabolic signals (10, 13, 17, 49), substances released from increasingly deoxygenated erythrocytes as they pass through the microcirculation (22, 29, 50, 51), or undefined signals that are propagated along myocyte and/or endothelial communication pathways (3, 7, 21, 55), the general principle appears to be valid regardless of the stimuli involved.
The data presented in this study refute our general hypothesis, as the accumulated shifts in γ with time at both 1A-2A (Fig. 3 of 4) and 3A-4A (Fig. 5 of 6) arteriolar bifurcations in resting skeletal muscle of OZR were significant reduced as compared with levels determined in LZR. This is a particularly striking observation, as it clearly suggests that not only does a change in temporal switching at arteriolar bifurcations not serve as a compensatory mechanism for the increased γ at arteriolar bifurcations in OZR, the reduction in temporal switching actually entrenches the negative outcomes for perfusion distribution associated with the increased γ. The results from subsequent interventions demonstrated that this blunting of temporal activity in arteriolar bifurcations of OZR could be ameliorated. In proximal resistance arterioles, treatment of the resting cremaster muscle with phentolamine, to remove alterations to the distribution of adrenergic constriction throughout the network, significantly increased the cumulative γ, an observation that was not identified in the distal microcirculation, where adrenoreceptor blockade was not associated with a significant change in γ. Conversely, interventions targeted at correcting endothelial dysfunction (Tempol and/or SQ-29548) had minimal impact on the temporal activity of perfusion distribution at proximal arterioles but significantly improved this response in more distal 3A-4A bifurcations (Fig. 8). In all cases, combined treatments improved γ to levels that were very similar to that determined for LZR under control conditions. It is particularly compelling that these interventions and their sites of greatest impact parallel results in our previous studies with regard to correcting the spatial heterogeneity of γ throughout the microcirculation (24) and improving muscle fatigue resistance and VO2 (24). Specifically, although treatment with either phentolamine or Tempol/SQ-29548 alone improved select or localized indexes of vascular function (with no beneficial impact on muscle performance), only combined treatment with phentolamine and Tempol/SQ-29548 resulted in a widely distributed and significant improvement to muscle perfusion, VO2, and performance (25). Taken together, this series of observations suggest that, with a combined intervention designed to remove alterations to adrenergic constriction and endothelial dysfunction in the OZR model of metabolic syndrome, blood flow hemodynamics at successive arteriolar bifurcations is improved to a condition which helps to restore the processes of mass transport and exchange in the microcirculation to a level that allows for a significant improvement to muscle performance. However, the extent to which this is manifested as a change to the total surface area available for exchange in the muscle or an improvement to erythrocyte distribution within the terminal arterioles and capillary networks remains to be elucidated.
One of the benefits derived from the increased effort of acquiring temporal data is that it can allow for the determination of an attractor. In essence, an attractor is the set to which a variable will adhere over time (36, 58). Even following perturbation as a result of an imposed challenge, the variable will change its behavior over time to return to its attractor if possible (36, 58). In the present experiments, the attractor for both proximal (1A-2A) and distal (3A-4A) arteriolar bifurcations in LZR exhibited a wide range of states around a central region with γ approximating 0.5. This was dramatically different in both proximal (Fig. 9) and distal (Fig. 10) arteriolar bifurcations of OZR, where the central region of the attractor was shifted to ∼0.58, with a narrowed range of achieved values. Beyond being an intriguing scientific curiosity, this shift in the attractor has critical implications for blood flow control in OZR. The change in both magnitude and range of the attractor with the development of pathology in OZR indicates that the ability of arterioles and arteriolar bifurcations to respond to imposed challenges (e.g., changes in metabolic demand) will be severely compromised as the potential for perfusion redistribution will be constrained to a more limited set of attainable conditions. Essentially, the development of nonatherosclerotic PVD in OZR is defined by a loss of flexibility in the control systems contributing to the regulation of perfusion distribution in skeletal muscle, thus severely compromising the ability to effectively adapt to changing conditions. This is a particularly striking outcome and it may represent the more functionally integrated extension of a similar process identified by Tigno et al. (54) in diabetic monkeys, where the randomness of arterial vasomotion was found to be dampened with disease progression. Taken together, it is not simply that we have dysfunction and can identify it in a series of reduced preparations. It is that indexes of dysfunction in simplified preparations, when integrated, produce an outcome wherein the pathology is partially defined by an impaired ability of the system to respond to stressors.
Despite numerous attempts, we were unable to acquire a sufficiently robust data set that outlined the impact of muscle contraction on γ in the cremaster muscle microcirculation. However, as a simulator of this condition, we used elevated concentrations of adenosine in the preparation superfusate and determined the resulting effects on γ. The results clearly indicate that superfusion with low (10−7 M) or moderate (10−5 M) levels of adenosine had a limited impact on the temporal behavior of γ or the resulting attractor in arteriolar bifurcations of OZR, whereas superfusion with high concentrations of adenosine (10−3 M) nearly restored γ to levels determined in arteriolar bifurcations in LZR, but did not restore the range of the attractor (Fig. 11). These observations strongly suggest that the arteriolar networks in OZR may be resistant responding to elevated metabolic demand, until a threshold is reached. Once a sufficient metabolic intensity (or build-up of the appropriate signal) has been attained, the system will respond, although to a constrained extent (i.e., magnitude of γ is restored, but range remains blunted). As we have demonstrated previously (24), this high concentration of adenosine results in a maximal relaxation of in situ skeletal muscle arterioles in OZR, meaning that the entire vascular network should be without any significant source of tone. This would mean that any changes in γ would reflect only the impact of the architecture and geometric arrangement of the network, as well as the intrinsic physical processes associated with blood flow and erythrocyte distribution in vascular networks, as has been previously studied by Cokelet (14, 15) and Kiani et al. (33), among others (23, 28). As presented in Fig. 11, the attractor for γ under these conditions is very similar between LZR and OZR in terms of magnitude and shape, but with a restricted range.
Given the nature of the data in the present study, attention should be given to the impact of the method of anesthesia on outcomes and data interpretation. Numerous previous studies have demonstrated that both inhalational volatile and injectable general anesthetics can impact endothelial function and vasomotion (16, 41, 48), as well as baroreflex sensitivity and the sympathetic control of vascular tone (48). As such, either option presents a challenge for data interpretation in the present study, especially given the complications associated with altered baroreflex control (40, 47), sympathetic output (11, 47), and endothelial function (25) that has been demonstrated in the obese Zucker rat. Although for this research, we have elected to use a barbiturate anesthetic (owing to the time between exposure and data collection, and to avoid the impact on vasomotion), these are issues that become extremely complicated and further investigation of the impact of anesthetic regimen on microvascular outomes in models of increased PVD risk may be warranted.
Obviously, the ultimate outcome for microvascular function, regardless of condition, is the ability of the networks to adequately support mass transport and exchange under both resting and challenged conditions. If we assume that the attractors identified for LZR under control conditions are representative of health, for the purposes of the present discussion it may be useful to consider this as optimized (i.e., these attractors describe microvascular networks functioning optimally). With this assumption, the attractors for OZR would represent the resultant state of the microcirculation under conditions of the metabolic syndrome. As such, it is important to estimate how these changes to perfusion distribution would impact indices such as tissue oxygenation or microvascular hematocrit. Although these measurements are outside of the scope of the current study, previous research efforts can provide some potential insight. In particular, the work of Pries et al. (42, 43) has identified a network Fahraeus effect that can represent a significant contributor to the ultimate reduction in microvascular hematocrit at successive bifurcations owing to a disproportionate distribution of flow (and therefore, erythrocytes) at arteriolar bifurcations. Under control conditions, those authors suggested that this alone could cause a reduction in microvascular hematocrit approaching 20%, with direct implications for tissue oxygenation (8, 52). As the results from the present study clearly indicate that γ is increased in the arteriolar networks of OZR (vs. control), it would be logical to speculate that this would result in an exacerbation of the network Fahraeus effect, which, when taken in combination with other contributors to hematocrit reduction [e.g., the vessel Fahraeus effect (15, 43) and other hemorheological parameters (5, 23, 34)], would result in a further reduction of microvascular hematocrit within the networks. Although specific interventions such as adrenoreceptor blockade and inhibiting the actions of TxA2 could provide some amelioration of this impairment, based on alterations to the shape of the attractors, only a combined interventional strategy would be sufficient to cause an improvement to arteriolar network function that would be sufficient to result in alterations to mass transport and exchange that were large enough to improve muscle fatigue resistance (25). Further investigation into the impact of these cumulative perfusion abnormalities in the skeletal muscle microcirculation of OZR could provide us with a far more complete understanding of how nonatherosclerotic PVD is manifest in this increasingly relevant animal model of the metabolic syndrome.
GRANTS
This study was supported by grants from the National Institutes of Health (NIH DK-R01-64668, T32-HL-90610, and RR-2865AR) and the American Heart Association (AHA EIA 0740129N).
DISCLOSURES
No conflicts of interest, financial or otherwise, are declared by the author(s).
AUTHOR CONTRIBUTIONS
Author contributions: J.T.B. and J.C.F. analyzed data; J.T.B., A.G.G., S.C.S., and J.C.F. interpreted results of experiments; J.T.B., A.G.G., and J.C.F. drafted manuscript; J.T.B., A.G.G., S.C.S., and J.C.F. edited and revised manuscript; J.T.B., A.G.G., S.C.S., and J.C.F. approved final version of manuscript; A.G.G. and J.C.F. performed experiments; J.C.F. conception and design of research; J.C.F. prepared figures.
ACKNOWLEDGMENTS
We thank Milinda James from the Department of Physiology and Pharmacology at West Virginia University for expert technical assistance and the Translational Research Facility in the Center for Cardiovascular and Respiratory Sciences at the West Virginia University Health Sciences Center for support.
REFERENCES
- 1. Ait-Oufella H, Taleb S, Mallat Z, Tedgui A. Recent advances on the role of cytokines in atherosclerosis. Arterioscler Thromb Vasc Biol 31: 969–979, 2011 [DOI] [PubMed] [Google Scholar]
- 2. Bagher P, Segal SS. The mouse cremaster muscle preparation for intravital imaging of the microcirculation. J Vis Exp 52: 2874, 2011 [DOI] [PMC free article] [PubMed] [Google Scholar]
- 3. Bagher P, Segal SS. Regulation of blood flow in the microcirculation: role of conducted vasodilation. Acta Physiol (Oxf) 202: 271–284, 2011 [DOI] [PMC free article] [PubMed] [Google Scholar]
- 4. Baker M, Wayland H. On-line volume-flow rates and velocity profile measurements for blood in microvessels. Microvasc Res 7: 131–143, 1974 [DOI] [PubMed] [Google Scholar]
- 5. Baskurt OK, Yalcin O, Gungor F, Meiselman HJ. Hemorheological parameters as determinants of myocardial tissue hematocrit values. Clin Hemorheol Microcirc 35: 45–50, 2006 [PubMed] [Google Scholar]
- 6. Bassingthwaighte JB, Liebovitch LS, West BJ. Intraorgan flow heterogeneities. In: Fractal Physiology. New York: Oxford University Press, 1994. p. 236–262 [Google Scholar]
- 7. Behringer EJ, Segal SS. Spreading the signal for vasodilatation: implications for skeletal muscle blood flow control and the effects of aging. J Physiol 15: 6277–6284, 2012. [DOI] [PMC free article] [PubMed] [Google Scholar]
- 8. Bos C, Hoofd L, Oostendorp T. Mathematical model of erythrocytes as point-like sources. Math Biosci 125: 165–189, 1995 [DOI] [PubMed] [Google Scholar]
- 9. Businaro R, Tagliani A, Buttari B, Profumo E, Ippoliti F, Di Cristofano C, Capoano R, Salvati B, Riganò R. Cellular and molecular players in the atherosclerotic plaque progression. Ann N Y Acad Sci 1262: 134–141, 2012 [DOI] [PubMed] [Google Scholar]
- 10. Calbet JA, Joyner MJ. Disparity in regional and systemic circulatory capacities: do they affect the regulation of the circulation? Acta Physiol (Oxf) 199: 393–406, 2010 [DOI] [PMC free article] [PubMed] [Google Scholar]
- 11. Carlson SH, Shelton J, White CR, Wyss JM. Elevated sympathetic activity contributes to hypertension and salt sensitivity in diabetic obese Zucker rats. Hypertension 35: 403–408, 2000 [DOI] [PubMed] [Google Scholar]
- 12. Chandra S, Singh V, Nehra M, Agarwal D, Singh N. ST-segment elevation in non-atherosclerotic coronaries: a brief overview. Intern Emerg Med 6: 129–139, 2011 [DOI] [PubMed] [Google Scholar]
- 13. Clifford PS, Hellsten Y. Vasodilatory mechanisms in contracting skeletal muscle. J Appl Physiol 97: 393–403, 2004 [DOI] [PubMed] [Google Scholar]
- 14. Cokelet GR. Rheology and hemodynamics. Annu Rev Physiol 42: 311–324, 1980 [DOI] [PubMed] [Google Scholar]
- 15. Cokelet GR. Experimental determination of the average hematocrit of blood flowing in a vessel. Microvasc Res 7: 382–384, 1974 [DOI] [PubMed] [Google Scholar]
- 16. Colantuoni A, Bertuglia S, Intaglieeta M. Effects of anesthesia on the spontaneous activity of the microvasculature. Int J Microcirc Clin Exp 3: 13–28, 1984 [PubMed] [Google Scholar]
- 17. Davis MJ. Perspective: physiological role(s) of the vascular myogenic response. Microcirculation 19: 99–114, 2012 [DOI] [PubMed] [Google Scholar]
- 18. Davis MJ. Determination of volumetric flow in capillary tubes using an optical Doppler velocimeter. Microvasc Res 34: 223–230, 1987 [DOI] [PubMed] [Google Scholar]
- 19. Dean SM. Atypical ischemic lower extremity ulcerations: a differential diagnosis. Vasc Med 13: 47–54, 2008 [DOI] [PubMed] [Google Scholar]
- 20. Demer L, Tintut Y. The roles of lipid oxidation products and receptor activator of nuclear factor-κB signaling in atherosclerotic calcification. Circ Res 108: 1482–1493, 2011 [DOI] [PMC free article] [PubMed] [Google Scholar]
- 21. Diep HK, Vigmond EJ, Segal SS, Welsh DG. Defining electrical communication in skeletal muscle resistance arteries: a computational approach. J Physiol 568: 267–281, 2005 [DOI] [PMC free article] [PubMed] [Google Scholar]
- 22. Ellsworth ML, Sprague RS. Regulation of blood flow distribution in skeletal muscle: role of erythrocyte-released ATP. J Physiol 590: 4985–4991, 2012 [DOI] [PMC free article] [PubMed] [Google Scholar]
- 23. Fenton BM, Carr RT, Cokelet GR. Nonuniform red cell distribution in 20 to 100 micrometers bifurcations. Microvasc Res 29: 103–126, 1985 [DOI] [PubMed] [Google Scholar]
- 24. Frisbee JC, Wu F, Goodwill AG, Butcher JT, Beard DA. Spatial heterogeneity in skeletal muscle microvascular blood flow distribution is increased in the metabolic syndrome. Am J Physiol Regul Integr Comp Physiol 301: R975–R986, 2011 [DOI] [PMC free article] [PubMed] [Google Scholar]
- 25. Frisbee JC, Goodwill AG, Butcher JT, Olfert IM. Divergence between arterial perfusion and fatigue resistance in skeletal muscle in the metabolic syndrome. Exp Physiol 96: 369–383, 2011 [DOI] [PMC free article] [PubMed] [Google Scholar]
- 26. Frisbee JC, Sylvester FA, Lombard JH. Contribution of extrinsic factors and intrinsic vascular alterations to reduced arteriolar reactivity with high-salt diet and hypertension. Microcirculation 7: 281–289, 2000 [PubMed] [Google Scholar]
- 27. Fuster JJ, Castillo AI, Zaragoza C, Ibáñez B, Andrés V. Animal models of atherosclerosis. Prog Mol Biol Transl Sci 105: 1–23, 2012 [DOI] [PubMed] [Google Scholar]
- 28. Gaehtgens P. Distribution of flow and red cell flux in the microcirculation. Scand J Clin Lab Invest Suppl 156: 83–87, 1981 [DOI] [PubMed] [Google Scholar]
- 29. Goldman D, Fraser GM, Ellis CG, Sprague RS, Ellsworth ML, Stephenson AH. Toward a multiscale description of microvascular flow regulation: O2-dependent release of ATP from human erythrocytes and the distribution of ATP in capillary networks. Front Physiol 3: 246, 2012 [DOI] [PMC free article] [PubMed] [Google Scholar]
- 30. Greenwald SE. Ageing of the conduit arteries. J Pathol 211: 157–172, 2007. 17200940 [Google Scholar]
- 31. Hill SF, Sheppard MN. Non-atherosclerotic coronary artery disease associated with sudden cardiac death. Heart 96: 1119–1125, 2010 [DOI] [PubMed] [Google Scholar]
- 32. Kasiske BL, O′Donnell MP, Keane WF. The Zucker rat model of obesity, insulin resistance, hyperlipidemia, and renal injury. Hypertension 19: I110–I115, 1992 [DOI] [PubMed] [Google Scholar]
- 33. Kiani MF, Pries AR, Hsu LL, Sarelius IH, Cokelet GR. Fluctuations in microvascular blood flow parameters caused by hemodynamic mechanisms. Am J Physiol Heart Circ Physiol 266: H1822–H1828, 1994 [DOI] [PubMed] [Google Scholar]
- 34. Lipowsky HH. Microvascular rheology and hemodynamics. Microcirculation 12: 5–15, 2005 [DOI] [PubMed] [Google Scholar]
- 35. Lombard JH, Frisbee JC, Greene AS, Hudetz AG, Roman RJ, Tonellato PJ. Microvascular flow and tissue PO2 in skeletal muscle of chronic reduced renal mass hypertensive rats. Am J Physiol Heart Circ Physiol 279: H2295–H2302, 2000 [DOI] [PubMed] [Google Scholar]
- 36. Mandelbrot BB. Fractal attractors, fractal (″chaotic′) evolutions. In: The Fractal Geometry of Nature. New York: W. H. Freeman and Company, 1983, p. 193–199 [Google Scholar]
- 37. Mathé D. Dyslipidemia and diabetes: animal models. Diabete Metab 21: 106–111, 1995 [PubMed] [Google Scholar]
- 38. Menolascina F, Siciliano V, di Bernardo D. Engineering and control of biological systems: a new way to tackle complex diseases FEBS Lett 586: 2122–2128, 2012 [DOI] [PubMed] [Google Scholar]
- 39. Meru AV, Mittra S, Thyagarajan B, Chugh A. Intermittent claudication: an overview. Atherosclerosis. 187: 221–237, 2006 [DOI] [PubMed] [Google Scholar]
- 40. Pamidimukkala J, Jandhyala BS. Evaluation of hemodynamics, vascular reactivity and baroreceptor compensation in the insulin resistance Zucker obese rats. Clin Exp Hypertens 18: 1089–1104, 1996 [DOI] [PubMed] [Google Scholar]
- 41. Park KW, Dai HB, Lowenstein E, Sellke FW. Effect of sevoflurane and desflurane on the myogenic constriction and flow-induced dilation in rat coronary arterioles. Anesthesiology 90: 1422–1427, 1999 [DOI] [PubMed] [Google Scholar]
- 42. Pries AR, Secomb TW, Gaehtgens P, Gross JF. Blood flow in microvascular networks. Experiments and simulation. Circ Res 67: 826–834, 1990 [DOI] [PubMed] [Google Scholar]
- 43. Pries AR, Ley K, Gaehtgens P. Generalization of the Fahraeus principle for microvessel networks. Am J Physiol Heart Circ Physiol 251: H1324–H1332, 1986 [DOI] [PubMed] [Google Scholar]
- 44. Ren J. Leptin and hyperleptinemia—from friend to foe for cardiovascular function. J Endocrinol 181: 1–10, 2004 [DOI] [PubMed] [Google Scholar]
- 45. Rioufol G, Finet G. Non-atherosclerotic mild anterior myocardial ischaemia. Arch Cardiovasc Dis 103: 135–136, 2010 [DOI] [PubMed] [Google Scholar]
- 46. Rollie′ S, Mangold M, Sundmacher K. Designing biological systems: systems engineering meets synthetic biology. Chem Engineer Sci 69: 1–29, 2012 [Google Scholar]
- 47. Schreihofer AM, Mandel DA, Mobley SC, Stepp DW. Impairment of sympathetic baroreceptor reflexes in obese Zucker rats. Am J Physiol Heart Circ Physiol 293: H2543–H2549, 2007 [DOI] [PubMed] [Google Scholar]
- 48. Seagard JL, Bosnjak ZJ, Hopp FA, Jr, Kotrly KJ, Ebert TJ, Kampine JP. Cardiovascular effects of general anesthesia. In: Effects of Anesthesia, Eds: Covino BR, Fozzard HA, Rehder K, Strichartz H. Baltimore, MD: Waverly Press, 1985, p. 149–170 [Google Scholar]
- 49. Segal SS. Regulation of blood flow in the microcirculation. Microcirculation 12: 33–45, 2005 [DOI] [PubMed] [Google Scholar]
- 50. Sprague RS, Ellsworth ML. Erythrocyte-derived ATP and perfusion distribution: role of intracellular and intercellular communication. Microcirculation 19: 430–439, 2012 [DOI] [PMC free article] [PubMed] [Google Scholar]
- 51. Sprague RS, Bowles EA, Achilleus D, Stephenson AH, Ellis CG, Ellsworth ML. A selective phosphodiesterase 3 inhibitor rescues low PO2-induced ATP release from erythrocytes of humans with type 2 diabetes: implication for vascular control. Am J Physiol Heart Circ Physiol 301: H2466–H2472, 2011 [DOI] [PMC free article] [PubMed] [Google Scholar]
- 52. Stainsby WN, Snyder B, Welch HG. A pictographic essay on blood and tissue oxygen transport. Med Sci Sports Exerc 20: 213–221, 1988 [DOI] [PubMed] [Google Scholar]
- 53. Tanofsky-Kraff M, Yanovski SZ. Eating disorder or disordered eating? Non-normative eating patterns in obese individuals. Obes Res 12: 1361–1366, 2004 [DOI] [PubMed] [Google Scholar]
- 54. Tigno XT, Hansen BC, Nawang S, Shamekh R, Albano AM. Vasomotion becomes less random as diabetes progresses in monkeys. Microcirculation 18: 429–439, 2011 [DOI] [PMC free article] [PubMed] [Google Scholar]
- 55. Tran CH, Vigmond EJ, Plane F, Welsh DG. Mechanistic basis of differential conduction in skeletal muscle arteries. J Physiol 587: 1301–1318, 2009 [DOI] [PMC free article] [PubMed] [Google Scholar]
- 56. Unger RH, Scherer PE. Gluttony, sloth and the metabolic syndrome: a roadmap to lipotoxicity. Trends Endocrinol Metab 21: 345–352, 2010 [DOI] [PMC free article] [PubMed] [Google Scholar]
- 57. van der Greef J, Hankemeier T, McBurney RN. Metabolomics-based systems biology and personalized medicine: moving towards n = 1 clinical trials? Pharmacogenomics 7: 1087–1094, 2006 [DOI] [PubMed] [Google Scholar]
- 58. Wagner CD, Nafz B, Persson PB. Chaos in blood pressure control. Cardiovasc Res 31: 380–387, 1996 [PubMed] [Google Scholar]
- 59. Wu F, Beard DA, Frisbee JC. Computational analyses of intravascular tracer washout reveal altered capillary-level flow distributions in obese Zucker rats. J Physiol 589: 4527–4543, 2011 [DOI] [PMC free article] [PubMed] [Google Scholar]