

Abstract
Hypoxia has been shown to rapidly increase triglycerides in mice by decreasing plasma lipoprotein clearance. However, the usual temperature of hypoxic exposure is below thermoneutrality for mice, which may increase thermogenesis and energy requirements, resulting in higher tissue lipid uptake. We hypothesize that decreased lipid clearance and ensuing hyperlipidemia are caused by hypoxic suppression of metabolism at cold temperatures and, therefore, would not occur at thermoneutrality. Twelve-week-old, male C57BL6/J mice were exposed to 6 h of 10% O2 at the usual temperature (22°C) or thermoneutrality (30°C). Acclimation to 22°C increased lipid uptake in the heart, lungs, and brown adipose tissue, resulting in lower plasma triglyceride and cholesterol levels. At this temperature, hypoxia attenuated lipid uptake in most tissues, thereby raising plasma triglycerides and LDL cholesterol. Thermoneutrality decreased tissue lipid uptake, and hypoxia did not cause a further reduction in lipid uptake in any organs. Consequently, hypoxia at thermoneutrality did not affect plasma triglyceride levels. Unexpectedly, plasma HDL cholesterol increased. The effect of hypoxia on white adipose tissue lipolysis was also modified by temperature. Independent of temperature, hypoxia increased heart rate and glucose and decreased activity, body temperature, and glucose sensitivity. Our study underscores the importance of ambient temperature for hypoxia research, especially in studies of lipid metabolism.
Keywords: hypoxia, metabolism, thermoregulation, lipids, altitude
acute hypoxia, as might be encountered in the setting of high altitude (2, 20, 74) or respiratory disorders such as obstructive sleep apnea (18, 63), is associated with elevated plasma triglycerides (TG). To date, the potential mechanisms by which hypoxia increases plasma lipids have not been studied in humans. However, rodents exposed to various forms of acute hypoxia (42, 46) develop hyperlipidemia, allowing for translational mechanistic studies. In mice, we showed recently that TG increase within 6 h of hypoxic exposure and that the magnitude of TG elevation correlated directly with the severity of hypoxia (36). Hypoxia decreased lipid uptake in brown adipose tissue (BAT) and white adipose tissue (WAT) (36) while reducing lipoprotein lipase (LPL) activity and the fatty acid transporters of these tissues. Furthermore, hypoxia lowered rates of hepatic VLDL secretion. Thus, we discovered that hypoxic hyperlipidemia in mice was caused by decreased tissue lipid uptake rather than increased hepatic secretion of lipoproteins.
In this study, we examine in greater depth the contribution of BAT to the development of hypoxic hyperlipidemia. Since BAT is the major site of thermogenesis in rodents (11), it is conceivable that hypoxic hyperlipidemia is dependent upon ambient temperature (Ta). Our previous study was conducted at a Ta of 22°C, so our findings could be explained by the fact that 1) BAT is highly active at 22°C (10), 2) hypoxia inactivates nonshivering thermogenesis in BAT (61), and 3) BAT rapidly catabolizes circulating TG in mice exposed to cold (3). BAT lipid uptake can be minimized by acclimatizing mice to a Ta that obviates their need for nonshivering thermogenesis [thermoneutral zone of 26–34°C (10)]. We hypothesized that lack of BAT activity would increase plasma lipids and that hypoxia under these circumstances would not further increase lipids. To test this hypothesis, we examined the effects of acute hypoxia on lipid metabolism at the usual laboratory temperature (22°C) or at thermoneutrality (30°C). We also examined whether Ta and hypoxia interact to influence other physiological parameters such as body temperature (Tb), heart rate, activity, and glucose tolerance.
MATERIALS AND METHODS
Ethical approval.
The study was approved by the Johns Hopkins University Animal Care and Use Committee and complied with the American Physiological Society Guidelines for Animal Studies.
Animals.
One-hundred eighty male C57BL/6J mice were purchased from The Jackson Laboratory (Bar Harbor, ME). Animals were procured at 6 wk of age and acclimated to experimental cages, five per cage, and fed ad libitum. Experiments were performed when mice reached 12–14 wk of age. Cages were placed in a temperature-regulated room at 22°C or in a neonatal incubator (Draeger 8000 IC) set to 30°C for thermoneutrality. The room lights were programmed to maintain a 12:12-h light-dark cycle, with lights on from 0900 to 2100.
Hypoxia exposures.
In all experiments, mice were simultaneously fasted and exposed to 6 h of sustained hypoxia at FiO2 = 0.10 beginning at 0800 and ending at 1400. We began hypoxia 1 h before the lights were turned on so that mice were likely to be feeding or recently sated at the onset of hypoxia. In preliminary experiments, this protocol minimized differences in baseline TG levels. A gas regulator system controlled the flow of nitrogen into customized Plexiglas cages, resulting in a stable hypoxia. To prevent accumulation of carbon dioxide and heat, cage lids were left partially open to allow mixing of gas with the surrounding environment. For all sample collections, injections, and surgical procedures, anesthesia was induced and maintained with 1–2% isoflurane administered by face mask. For time course experiments, mice were briefly removed from cages and anesthetized in a drop jar for ∼15 s, and a retroorbital blood sample was collected at 2-h intervals. After each sample collection, mice were quickly returned to hypoxia or control cages.
Telemetry and pulse oximetry.
Mice were anesthetized with isoflurane and implanted with transmitters from Data Sciences International (St. Paul, MN). For heart rate, PA-C10 telemeters were placed in the left carotid arteries of five mice terminating in the aortic arch. For temperature and activity, TA-F10 telemeters were surgically implanted in the periotoneal cavity of five separate mice. Signals were converted to analog and captured using PowerLabs 16/35 interfaced with LabChart Pro software from ADInstruments (Colorado Springs, CO). Activity was recorded as voltage spikes in response to single mouse movements; number of movements per 5-min interval was used as an estimate of locomotor activity. Mice were given >7 days of recovery prior to data collection. To maintain the grouping of mice as performed in other experiments without telemetry, we placed telemeters into 1 mouse/cage accompanied by four uninstrumented mice. Mouse oxygen saturation (SaO2) and breath rate were measured using a MouseOx neck cuff and StarrLink module from Starr Life Sciences (Pittsburgh, PA). To limit the discomfort of the neck cuff, recordings were obtained for 30–60 min of baseline, the first 60 min of hypoxia, and the first 30–60 min of recovery.
Intraperitoneal glucose tolerance test.
Following 6 h of air or hypoxia exposure at 1400, mice (n = 10/group) were injected with 2 g/kg glucose. Blood was collected from the tail in unanesthetized mice 0, 10, 20, 30, 60, 90, and 120 min after glucose injection. Blood glucose was tested with Accu-Chek Comfort Curve kits from Roche Diagnostics (Indianapolis, IN).
Lipid clearance, lipoprotein lipase, and hepatic lipase activity.
Plasma TG tissue uptake was assessed using bolus injection of Intralipid (Kabi Pharmacia, Clayton, NC), as described previously (28, 36). For lipoprotein lipase (LPL) activity, mice (n = 10/group) were injected with 200 U heparin/kg body wt, returned to cages for 5 min, and reanesthetized to obtain postheparin plasma (19). Tissue LPL activity assayed using an artificial [3H]triolein lipid emulsion; plasma LPL activity was distinguished from hepatic lipase activity by suppression with 1 M NaCl. A separate group of mice exposed in the same manner to 10 or 21% O2 was used for tissue LPL activity, without the mice undergoing heparin injection. LPL activity in heparin eluates from the lungs, heart, BAT, WAT, and soleus muscle, and hepatic lipase in heparin eluates from the liver were tested according to Nilsson-Ehle and Schotz (48), with minor modifications (24). One unit of LPL activity was defined as the release of 1 μmol of free fatty acids (FFA) in 1 h/g tissue.
Real-time PCR.
Total RNA was extracted from tissues using Trizol (Life Technologies, Rockville, MD), and cDNA was synthesized using AdvantageRT for PCR kit from Clontech (Palo Alto, CA). Real-time reverse transcriptase PCR (RT-PCR) was performed with primers from Invitrogen (Carlsbad, CA) and Taqman probes from Applied Biosystems (Foster City, CA). The results were quantified according to the 2−ΔΔCT method (40, 60).
Biochemical assays.
Cholesterol, TG, FFA, cholesterol, low-density lipoprotein cholesterol (LDL-C), and high-density lipoprotein cholesterol (LDL-C) levels were measured using commercially available kits from Wako Diagnostics (Richmond, VA).
Statistical analysis.
We performed two-way analysis of variance (ANOVA) using the variables of Ta (22 vs. 30°C) and hypoxia (FiO2 = 0.21 or 0.10) with Bonferroni Multiple Comparisons for post hoc comparisons. For intraperitoneal glucose tolerance test, we calculated the area under the curve using a trapezoidal rule, and the area under the curve was compared using two-way ANOVA. Statistics were calculated using GraphPad Prism (GraphPad Software, La Jolla, CA). For continuously measured variables (Tb, activity, and heart rate), the effects of time and their interaction with hypoxia or air were examined with mixed-effects linear regression models, using STATA software version 11.0 (STATA, College Station, TX). For all comparisons, a value of P < 0.05 was considered significant.
RESULTS
Effects of Ta and hypoxia on oximetry, respiratory rate, and core Tb.
SaO2 and respiratory rate are shown in Table 1. As expected, initial SaO2 was ∼98% in all groups, fell to ∼74% during hypoxia, and returned to baseline during recovery. Respiratory rate was lower at thermoneutrality but rose to the same level as mice exposed to hypoxia at 22°C. In terms of Tb, we observed influences of Ta, hypoxia, and time (Fig. 1A). Before hypoxia (0600–0800), Tb was at its peak in all groups, reflecting the nocturnal circadian rhythm of mice. During this period, Tb was higher in mice housed at the cooler Ta of 22°C (P < 0.01). From 0800 to 1400, Tb declined and fell significantly more during hypoxia (P < 0.01) regardless of Ta. From 1400 to 1600, Tb was at its lowest point in normoxic mice and did not differ with respect to Ta. Average Tb was not significantly different between any groups during this period, although Tb in mice recovering from hypoxia briefly exceeded that of the normoxic mice. Hence, mice at both Ta exhibited hypoxemia, hypothermia, and tachypnea during hypoxic exposure. Thermoneutrality accentuated hypoxia-induced tachypnea and diminished the fall in Tb from baseline during the dark phase (0600–0800).
Table 1.
Oximetry and respiratory rate
| Baseline |
Hypoxia or Air |
Recovery |
|||||
|---|---|---|---|---|---|---|---|
| FiO2 | 22°C | 30°C | 22°C | 30°C | 22°C | 30°C | |
| SaO2 | 0.21 | 97.7 ± 0.2 | 98.0 ± 0.2 | 97.8 ± 0.2 | 98.0 ± 0.3 | 98.8 ± 0.2 | 98.1 ± 0.2 |
| 0.10 | 98.2 ± 0.2 | 97.9 ± 0.2 | 73.3 ± 1.8* | 74.2 ± 2.4* | 98.0 ± 0.2 | 98.3 ± 0.2 | |
| Respiratory rate | 0.21 | 174 ± 6 | 144 ± 15† | 166 ± 5 | 146 ± 14† | 170 ± 5 | 145 ± 11† |
| 0.10 | 183 ± 7 | 148 ± 7† | 211 ± 14* | 205 ± 22* | 177 ± 8 | 129 ± 7† | |
Values are means ± SE.
SaO2, oxygen saturation.
P < 0.05 for air vs. hypoxia;
P < 0.05 for 22 vs. 30°C.
Fig. 1.

Body temperature (Tb; A) activity (B), and heart rate (C) of mice exposed to hypoxia at 22 or 30°C. Shaded region represents hypoxic exposure in the hypoxia group (dashed line) or air exposure in control mice (solid line). Right: aggregate mean of baseline (0600–0800), hypoxia/air (0800–1400), or recovery (1400–1600) periods. *P < 0.01 for effect of hypoxia; bracketed P values for significant effects of Ta are shown. Values are plotted as means ± SE.
Effects of Ta and hypoxia on activity.
Mice exposed to 22°C tended to group together, whereas those at thermoneutrality maintained a greater distance between the animals (Fig. 2), a well-known form of behavioral thermoregulation (66), although we did not quantify this behavior in the present study. Activity was highest from 0600 to 0800 in all groups and consistently higher in thermoneutral mice (Fig. 1B). From 0800 to 1400, activity declined in normoxic mice at both Ta but was consistently higher at thermoneutrality (P < 0.01). During this period, hypoxia suppressed activity at both Ta. From 1400 to 1600, activity recovered in hypoxic mice. In mice at 22°C, activity levels exceeded those of normoxic mice; at thermoneutrality, activity matched that of normoxic mice. Overall, thermoneutrality increased activity, whereas hypoxia suppressed activity.
Fig. 2.

Behavioral responses of mice exposed to hypoxia at 22 or 30°C. Representative photographs of mice housed n = 5/cage under each condition.
Effect of Ta and hypoxia on heart rate.
As shown in Fig. 1C, thermoneutrality significantly lowered heart rate ∼100 beats/min relative to mice at 22°C. During exposure to hypoxia, heart rate increased at both Ta, but the increase was more pronounced at thermoneutrality, especially in the first hour. The heart rate also varied with time as a function of Ta. At 22°C, there was a progressive, modest increase in heart rate in hypoxic mice. At 30°C, the heart rate in hypoxic mice declined over time. During recovery from hypoxia, heart rate returned to prehypoxia levels in mice at both Ta. Thus, thermoneutrality lowered overall heart rate, hypoxia increased heart rate, and the magnitude of tachycardia was more pronounced at thermoneutrality.
Effects of Ta and hypoxia on glucose and lipid profiles.
Glucose, glycerol, FFA, and lipid profiles (Fig. 3) were assessed immediately following hypoxia or air exposure. Relative to mice at 22°C, thermoneutral mice exhibited decreased glycerol and higher TG and cholesterol (P < 0.05). Hypoxia independently increased glucose (P < 0.05). In addition, we noted several striking Ta-hypoxia interactions. At 22°C, hypoxia increased TG, total cholesterol, and LDL cholesterol and decreased plasma FFA and glycerol. At thermoneutrality, hypoxia increased glycerol and did not affect FFA. Hypoxia had no effect on TG or total cholesterol but lowered LDL-C and unexpectedly increased HDL-C.
Fig. 3.

Glucose, glycerol, and free fatty acids (FFA) (A) and lipid profile exposed to hypoxia (B) at 22 or 30°C. Values for mice exposed to 21% O2 are shown in open bars, whereas values for mice exposed to 10% O2 are shown in filled bars. *P < 0.05 for effect of hypoxia; bracketed P value for significant effects of Ta is shown. Values are plotted as means ± SE.
Effects of Ta and hypoxia on glucose tolerance.
Acute hypoxia (43, 73) and low Ta (67) have separately been shown to cause glucose intolerance, so we examined the interaction of these variables on glucose tolerance in mice by intraperitoneal glucose tolerance test (Fig. 4). Thermoneutrality improved glucose tolerance, whereas acute hypoxia worsened glucose tolerance at both Ta (P < 0.01). Thus, cool Ta and hypoxia impaired glucose tolerance in an additive but noninteractive manner.
Fig. 4.
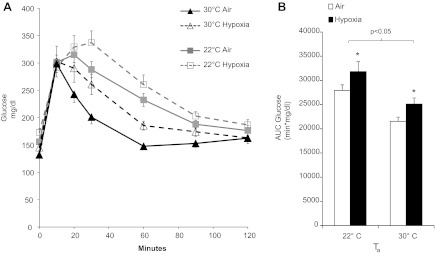
Glucose tolerance of mice exposed to hypoxia at 22 or 30°C. A: blood glucose level of mice after injection of 2 g/kg glucose ip. B: area under the curve (AUC) of glucose in each group of mice. Hypoxia independently impaired glucose tolerance (*P < 0.01) and lowered Ta (P < 0.05). Values are plotted as means ± SE.
Effects of Ta and hypoxia on lipid metabolism and hepatic VLDL secretion.
As shown in Fig. 5, hypoxia significantly delayed clearance of plasma TG at 22°C. At thermoneutrality, mice exhibited a significantly higher baseline TG, and the rate of decline was not affected by hypoxia. The rate of hepatic secretion of VLDL-TG was not affected by Ta but was decreased by hypoxia (P < 0.01; Fig. 6). Tissue uptake of [3H]oleate intralipid was greatest at 22°C in the lungs, heart, BAT, and skeletal muscle and was lowered by thermoneutrality (Fig. 7A). Hypoxia inhibited lipid uptake in liver, lung, heart, BAT, and WAT only at 22°C. To examine the role of LPL in these observations, we performed LPL and hepatic lipase (HL) activity assays on tissue homogenates, as shown in Fig. 7B. Thermoneutrality lowered heart and BAT LPL activity and increased WAT LPL activity. Hypoxia independently decreased LPL activity in WAT. Only at 22°C did hypoxia inhibit BAT LPL activity. Postheparin total lipase activity and LPL activity were lower in thermoneutral mice (Fig. 7C), and HL activity trended toward a decrease by hypoxia in 22°C mice (P = 0.14). Therefore, interacting effects of Ta and hypoxia on lipid uptake appear to be mediated through LPL in the BAT and through LPL-independent mechanisms in other tissues.
Fig. 5.
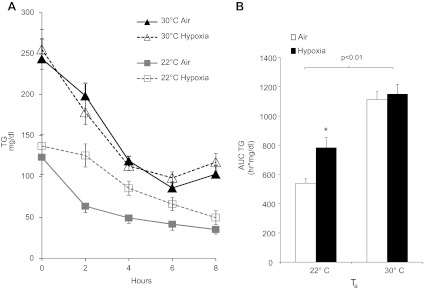
Triglyceride (TG) levels of mice exposed to hypoxia at 22 or 30°C. A: TG level of mice during progressive fasting. B: AUC of TG in each group of mice. Hypoxia prolonged lipemia at 22°C (*P < 0.01) but had no effect at 30°C. Overall, TG levels were higher at 30°C. Values are plotted as means ± SE.
Fig. 6.

Hepatic TG secretion in mice exposed to hypoxia at 22 or 30°C. Mice were fasted for 6 h under normoxia or hypoxia and injected with Triton WR-1339 to prevent TG hydrolysis. TG secretion rates were similar at both Ta under normoxic conditions, and hypoxia independently decreased hepatic TG secretion.
Fig. 7.

Tissue lipid uptake and lipoprotein lipase (LPL) activity of mice exposed to hypoxia at 22 or 30°C. A: radioactive [3H]oleate intralipid levels in tissues following air or hypoxia exposure. B: LPL activity in corresponding tissue homogenates. C: pre- and postheparin lipase activity. *P < 0.05 for effect of hypoxia; bracketed P values for significant effect of Ta are shown. BAT, brown adipose tissue; WAT, white adipose tissue; HL, hepatic lipase.
Effects of Ta and hypoxia on transcription of genes of lipid transport in adipose tissue.
Previously, we showed that hypoxia in mice at 22°C downregulated transcription of LPL, fatty acid transporter CD36, and the transcription factor peroxisome-proliferator-activated receptor-(PPARγ) in adipose tissues. Levels of posttranscriptional LPL regulators glycosylphosphatidylinositol-anchored high-density lipoprotein-binding protein-1 (GPIHBP1) and angiopoetin-like protein-4 (Angptl4) were not affected (36). Here, we reexamined the effects of hypoxia on adipose tissue gene expression at themoneutrality. In BAT, as might be anticipated from patterns of lipid uptake and LPL activity, thermoneutrality lowered transcription of LPL, CD36, and PPARγ (Fig. 8). Hypoxia inhibited LPL, CD36, and PPARγ transcription only at 22°C. In WAT, LPL, CD36, and PPARγ were inhibited by hypoxia regardless of Ta. Interestingly, transcription of GPIHBP1 and Angptl4 were inhibited only by hypoxia at thermoneutrality.
Fig. 8.

Effect of Ta and hypoxia on BAT (A) and WAT gene expression (B). *P < 0.05 for effect of hypoxia; bracketed P values for significant effect of Ta are shown. Values are plotted as means ± SE. PPARγ, peroxisome proliferator-activated receptor-γ; GPIHBP1, glycosylphosphatidylinositol-anchored high-density lipoprotein-binding protein-1; Angptl4, angiopoetin-like protein-4.
DISCUSSION
The central finding of this study was that hypoxia-induced changes in lipid metabolism depend highly upon Ta. Specifically, mice acclimated to 22°C had relatively low plasma TG and LDL-C levels that were increased by hypoxia, whereas mice acclimated to 30°C had relatively high plasma TG and LDL-C levels that were not further increased by hypoxia. Underlying these changes was the observation that cooler Ta stimulated lipid uptake in several tissues, and hypoxia attenuated this stimulation, especially in BAT. In the discussion below, we will elaborate upon the effects of temperature and hypoxia and address the limitations and clinical implications of this study.
Effects of ambient temperature.
For clothed humans, 22°C is a comfortable indoor temperature and falls within the human thermoneutral zone (41). For mice, the thermoneutral zone is 26–34°C (10). When mice are challenged with Ta outside of this range, maintenance of Tb requires large amounts of energy, given the large surface area/volume ratio of rodents (51, 62). Golozoubova et al. (29) showed that oxygen consumption (V̇o2) in mice increases by ∼50% at 22°C compared with thermoneutrality. An increase in V̇o2 of this magnitude occurs near 0°C in minimally clothed humans (34, 53). In many studies the metabolic, cardiovascular, and immunological differences between humans and mice, hitherto thought to reflect species differences, were eliminated by thermoneutrality (37).
The hypothalamus stimulates shivering and nonshivering thermogenesis, huddling, and other processes to defend Tb. In part, these responses are facilitated by increased outflow of the sympathetic nervous system (SNS) and the hypothalamic-pituitary axis (25, 68). This study reveals the integrated hypermetabolic response of mice to cold Ta in terms of both physiology and lipid metabolism. The physiological manifestations of elevated V̇o2 included a 20% faster respiratory rate, 32% faster heart rate, and 1°C warmer Tb. In addition, activity was suppressed, which may reflect the competing energy costs of thermoregulation. Glucose intolerance also occurred, which is a well-known consequence of SNS activation in rodents (67) and humans (16).
Elevated V̇o2 was also manifested in whole body lipid metabolism. Cold Ta stimulated WAT lipolysis, mobilizing FFA to meet the energy demands of other tissues. In fact, fatty acid uptake doubled in the heart and lungs and tripled in BAT, where expression of fatty acid transport genes was also markedly increased. In a more extreme example of this phenomenon, Barteldt et al. (3) showed that BAT lipid uptake increased 10-fold in mice at Ta = 4°C (compared with Ta = 22°), which rapidly reduced plasma lipids. Together with their study, it can be seen that Ta below thermoneutrality stimulates FFA mobilization and uptake by organs critical for oxygen delivery (heart, lungs) and maintenance of Tb (BAT). Furthermore, the contribution of BAT to lipid uptake increases greatly as Ta decreases. As we will discuss below, this hypermetabolic state predisposed mice to hyperlipidemia during hypoxia.
Effect of hypoxia on lipid metabolism at 22°C.
At 22°C, hypoxia inhibited lipid uptake in all tissues other than skeletal muscle, causing a rapid elevation of plasma TG and LDL-C. This parallels the manner in which hypoxia prevents the augmented V̇o2 of cold (7, 32). An equivalent degree of hypoxia lowered lipid uptake at 22 but not at 30°C. This fact argues against insufficient oxygen for aerobic metabolism (47) and suggests a regulated decrease in lipid uptake at the cooler Ta. Most likely, hypoxia inhibits hypothalamic control of Tb, which mediates a systemic decrease in V̇o2 (26). Thereafter, a combination of end-organ and systemic effectors decreased lipid flux in various tissues. End-organ pathways are exemplified by BAT, where lipid uptake fell in concert with LPL activity and the transcription of CD36 and PPARγ. Hypoxia inhibits PPARγ in adipose tissue (50, 69), which controls the expression of LPL and CD36 (70). Alternatively, decreases in fatty acid transport gene expression in BAT may follow the lowering of plasma FFA (55). In some tissues, such as the lungs, hypoxia lowered lipid uptake without affecting LPL activity. In such cases, blood flow, hormonal signaling, or fatty acid transport may have been responsible for decreasing tissue lipid uptake.
Hypoxia inhibited WAT lipolysis at 22°C. Hypoxic inhibition of cold-stimulated lipolysis has been reported by others, but mechanisms are not known (4, 5). Possibly, blunted adrenoreceptor sensitivity (15), accumulations of adenosine and lactate (22), or reductions in blood flow to WAT caused by hypoxia (39) and SNS stimulation (23, 58) are responsible for reduced efflux of FFA from WAT. Since hypoxia stimulates the SNS, which activates WAT lipases, local WAT factors must have prevailed over sympathetic stimulation. In our previous study, hypoxia stimulated WAT lipolysis even at 22°C (36). Differences in the age of mice (8 vs. 12 wk), circadian factors (lights were turned on simultaneously with the onset of hypoxia), and less rigorous control over Ta in the prior study might account for differences.
Effects of hypoxia on lipid metabolism at 30°C.
Seminal experiments demonstrated that hypoxia suppresses V̇o2 in small mammals in a Ta-dependent manner, with thermoneutrality markedly attenuating or abolishing this response (27, 32). Since humans exhibit a stable or elevated V̇o2 during acute hypoxia (8, 33, 56, 57), thermoneutrality in effect “humanizes” the murine response. Indeed, lipid uptake in tissues was already low and not further reduced by hypoxia at 30°C. In addition, we observed several unanticipated changes in plasma lipids and cholesterol. First, hypoxia lowered plasma LDL-C. This most likely resulted from a fall in hepatic VLDL secretion without the suppression of lipid uptake that occurred at 22°C. Second, hypoxia increased plasma HDL-C. In humans, Ferezou et al. (21) showed that ascent to 4,300 m decreased postprandial lipemia and increased HDL-C. In another study, a simulated ascent to 12,000 ft. for 8.5 h increased HDL-C (14). Although the mechanisms and cardiovascular implications of HDL-C elevation by hypoxia are not clear, thermoneutral Ta will be a prerequisite for further studies in mice. Third, hypoxia increased lipid uptake by the heart without a detectable increase in LPL activity. Hypoxia has been shown to induce translocation of CD36 to the membrane of myocardiocytes (12) that would foster LPL-independent FFA uptake. Alternatively, higher levels of tracer could reflect lower myocardial β-oxidation. In either case, the opposite effect of hypoxia at 22 and 30°C reveals competing systemic and end-organ factors for lipid uptake by the heart. Given the importance of substrate metabolism for efficient myocardial function (38, 71), cardiovascular studies in mouse models of hypoxia must consider the effects of Ta. Finally, hypoxia stimulated WAT lipolysis at 30°C, similar to the effect of acute hypoxia in humans (35, 49, 56). Perhaps the relative vagal tone (65) of the mice at thermoneutrality predisposes them to greater SNS stimulation by hypoxia. Despite the mobilization of FFA, hepatic VLDL secretion was not increased, perhaps because of concurrent ketone oxidation (44, 75) or catecholamine-mediated suppression of lipoprotein secretion (6, 13).
Overall, changes in lipid metabolism between mice and humans during acute hypoxia are similar when each species is studied in its respective thermoneutral zone. Some human studies show that hypobaric hypoxia increases TG and decreases HDL-C, but in volunteers exposed for days (2) or weeks (59) to high altitude and after overnight fasting. These more subacute changes have yet to be studied in rodents at thermoneutrality.
Temperature-independent effects of hypoxia.
Many effects of hypoxia occurred to a similar extent at 22 and 30°C, and therefore, we can exonerate their involvement in hyperlipidemia at 22°C. These effects included hyperventilation, hyperglycemia, tachycardia, glucose intolerance, reduced WAT LPL activity and lipid transport capacity, and reduced hepatic TG secretion. Many of these effects stem from arterial chemoreceptor and stimulation of the SNS (1, 49, 52, 54, 64). In terms of heart rate, some studies report that hypoxia causes bradycardia, particularly below thermoneutrality (7, 9). In this study, mice slept much of the light phase, lowering their heart rate, which may have been a precondition for relative tachycardia during hypoxia. Hypoxia caused hypothermia at both 22 and 30°C (30, 45), but by different mechanisms, as revealed by patterns of lipid uptake. At 22°C, hypoxia principally inhibited BAT nonshivering thermogenesis. At 30°C, BAT lipid uptake was unaffected by hypoxia, suggesting that hypothermia resulted from greater heat dissipation (31, 72). This is an important distinction, because it shows that decreased Tb per se does not cause hyperlipidemia.
Limitations.
Several caveats should be acknowledged when interpreting our findings. First, we did not measure V̇o2 in this study. However, many studies describe elevated V̇o2 at 22°C (17, 29), and separate studies demonstrate suppression of V̇o2 by hypoxia (26). Second, we did not directly assess cholesterol transport. It is reasonable to assume that plasma LDL-C levels should be negatively related to rates of circulating lipoprotein hydrolysis and positively with hepatic VLDL secretion. However, experiments specifically examining cholesterol transport are warranted, especially for HDL-C. Third, experiments were performed in group-housed mice during the light phase, when they tended to be asleep. Effects of Ta were probably mitigated by these conditions, and certain parameters such as heart rate may have been highly dependent upon sleep-wake state. Fourth, we did not examine other tissues such as the brain, other types of muscle, or various adipose tissue depots. Such tissues may exhibit differing patterns of lipid uptake. Finally, we studied mice that were recently fed at the start of hypoxia and did not deliver oral or IV boluses of lipid. More comprehensive tests of lipid clearance were performed in our recent study (36). However, the postabsorptive state was not studied. Muratsubaki et al. (46) showed that sated but not fasted rats developed hypertriglyceridemia during acute hypoxia (although the Ta of the experiments was not specified).
Conclusion.
Ta is known to alter the metabolic impact of hypoxia in rodents. In this study, effects of hypoxia on TG and cholesterol metabolism at 22°C were eliminated or reversed by thermoneutrality. Figure 9 is a schematic relating changes in plasma lipids to the competing influences of Ta and hypoxia in various tissues. We conclude that Ta must be carefully considered in the design and interpretation of experiments that involve hypoxia in mice.
Fig. 9.

Interactions of temperature and hypoxia on lipid transport in tissues. Acclimation to cold (22°C) lowers plasma lipids via increased uptake of fatty acids in multiple tissues (effect A). Hypoxia inhibits the hypermetabolic effects of cold (effect C), leading accumulations in plasma TG and LDL cholesterol. Thermoneutrality removes the influence of cold, which increases plasma lipids. Hypoxia at thermoneutrality (effect B) does not increase TG but lowers LDL cholesterol, likely through its inhibitory effect on hepatic VLDL secretion. In WAT, hypoxia can stimulate or inhibit lipolysis, depending on the net impact of effects A, B, and C.
GRANTS
This work was supported by Eudowood Baurenschmidt Grant No. 80026999, Johns Hopkins Clinician Scientist Award No. 80028014, and National Heart, Lung, and Blood Institute Grants 1-K08-HL-109475-01A1 and R01-HL-080105.
DISCLOSURES
No conflicts of interest, financial or otherwise, are declared by the authors.
REFERENCES
- 1.Alvarez-Buylla R, de Alvarez-Buylla ER. Carotid sinus receptors participate in glucose homeostasis. Respir Physiol 72: 347–359, 1988 [DOI] [PubMed] [Google Scholar]
- 2.Barnholt KE, Hoffman AR, Rock PB, Muza SR, Fulco CS, Braun B, Holloway L, Mazzeo RS, Cymerman A, Friedlander AL. Endocrine responses to acute and chronic high-altitude exposure (4,300 meters): modulating effects of caloric restriction. Am J Physiol Endocrinol Metab 290: E1078–E1088, 2006 [DOI] [PubMed] [Google Scholar]
- 3.Bartelt A, Bruns OT, Reimer R, Hohenberg H, Ittrich H, Peldschus K, Kaul MG, Tromsdorf UI, Weller H, Waurisch C, Eychmuller A, Gordts PL, Rinninger F, Bruegelmann K, Freund B, Nielsen P, Merkel M, Heeren J. Brown adipose tissue activity controls triglyceride clearance. Nat Med 17: 200–205, 2011 [DOI] [PubMed] [Google Scholar]
- 4.Baum D. Inhibition of lipolysis by hypoxia in puppies. Proc Soc Exp Biol Med 125: 1190–1194, 1967 [DOI] [PubMed] [Google Scholar]
- 5.Baum D. The inhibition of norepinephrine-stimulated lipolysis by acute hypoxia. J Pharmacol Exp Ther 169: 87–94, 1969 [PubMed] [Google Scholar]
- 6.Brindle NP, Ontko JA. Alpha-adrenergic suppression of very-low-density-lipoprotein triacylglycerol secretion by isolated rat hepatocytes. Biochem J 250: 363–368, 1988 [DOI] [PMC free article] [PubMed] [Google Scholar]
- 7.Bullard RW, Meyer FR. Relationship of the hypoxic heart rate response to ambient temperature. J Appl Physiol 21: 999–1003, 1966 [DOI] [PubMed] [Google Scholar]
- 8.Butterfield GE, Gates J, Fleming S, Brooks GA, Sutton JR, Reeves JT. Increased energy intake minimizes weight loss in men at high altitude. J Appl Physiol 72: 1741–1748, 1992 [DOI] [PubMed] [Google Scholar]
- 9.Campen MJ, Tagaito Y, Li J, Balbir A, Tankersley CG, Smith P, Schwartz A, O'Donnell CP. Phenotypic variation in cardiovascular responses to acute hypoxic and hypercapnic exposure in mice. Physiol Genomics 20: 15–20, 2004 [DOI] [PubMed] [Google Scholar]
- 10.Cannon B, Nedergaard J. Nonshivering thermogenesis and its adequate measurement in metabolic studies. J Exp Biol 214: 242–253, 2011 [DOI] [PubMed] [Google Scholar]
- 11.Cannon C, Nedergaard J. Nonshivering thermogenesis and its adequate measurement in metabolic studies. J Exp Biol 214: 242–253, 2010 [DOI] [PubMed] [Google Scholar]
- 12.Chabowski A, Gorski J, Calles-Escandon J, Tandon NN, Bonen A. Hypoxia-induced fatty acid transporter translocation increases fatty acid transport and contributes to lipid accumulation in the heart. FEBS Lett 580: 3617–3623, 2006 [DOI] [PubMed] [Google Scholar]
- 13.Chait A, Brunzell JD, Johnson DG, Benson JW, Werner P, Palmer JP, Albers JJ, Ensinck JW, Bierman EL. Reduction of plasma triglyceride concentration by acute stress in man. Metabolism 28: 553–561, 1979 [DOI] [PubMed] [Google Scholar]
- 14.Coste O, Van Beers P, Touitou Y. Impact of hypobaric hypoxia in pressurized cabins of simulated long-distance flights on the 24 h patterns of biological variables, fatigue, and clinical status. Chronobiol Int 24: 1139–1157, 2007 [DOI] [PubMed] [Google Scholar]
- 15.de Glisezinski I, Crampes F, Harant I, Havlik P, Gardette B, Jammes Y, Souberbielle JC, Richalet JP, Rivière D. Decrease of subcutaneous adipose tissue lipolysis after exposure to hypoxia during a simulated ascent of Mt Everest. Pflugers Arch 439: 134–140, 1999 [DOI] [PubMed] [Google Scholar]
- 16.Deibert DC, Defronzo RA. Epinephrine-induced insulin resistance in man. J Clin Invest 65: 717–721, 1980 [DOI] [PMC free article] [PubMed] [Google Scholar]
- 17.DeRuisseau LR, Parsons AD, Overton JM. Adaptive thermogenesis is intact in B6 and A/J mice studied at thermoneutrality. Metabolism 53: 1417–1423, 2004 [DOI] [PubMed] [Google Scholar]
- 18.Drager LF, Jun J, Polotsky VY. Obstructive sleep apnea and dyslipidemia: implications for atherosclerosis. Curr Opin Endocrinol Diabetes Obes 17: 161–165, 2010 [DOI] [PMC free article] [PubMed] [Google Scholar]
- 19.Drager LF, Li J, Shin MK, Reinke C, Aggarwal NR, Jun JC, Bevans-Fonti S, Sztalryd C, O'Byrne SM, Kroupa O, Olivecrona G, Blaner WS, Polotsky VY. Intermittent hypoxia inhibits clearance of triglyceride-rich lipoproteins and inactivates adipose lipoprotein lipase in a mouse model of sleep apnoea. Eur Heart J 33: 783–790, 2011 [DOI] [PMC free article] [PubMed] [Google Scholar]
- 20.Farias JG, Osorio J, Soto G, Brito J, Siques P, Reyes JG. Sustained acclimatization in Chilean mine workers subjected to chronic intermittent hypoxia. High Alt Med Biol 7: 302–306, 2006 [DOI] [PubMed] [Google Scholar]
- 21.Ferezou J, Richalet JP, Serougne C, Coste T, Wirquin E, Mathe D. Reduction of postprandial lipemia after acute exposure to high altitude hypoxia. Int J Sports Med 14: 78–85, 1993 [DOI] [PubMed] [Google Scholar]
- 22.Frayn KN. Fat as a fuel: emerging understanding of the adipose tissue-skeletal muscle axis. Acta Physiol (Oxf) 199: 509–518, 2010 [DOI] [PubMed] [Google Scholar]
- 23.Fredholm BB, Karlsson J. Metabolic effects of prolonged sympathetic nerve stimulation in canine subcutaneous adipose tissue. Acta Physiol Scand 80: 567–576, 1970 [DOI] [PubMed] [Google Scholar]
- 24.Fried SK, Kral JG. Sex differences in regional distribution of fat cell size and lipoprotein lipase activity in morbidly obese patients. Int J Obes 11: 129–140, 1987 [PubMed] [Google Scholar]
- 25.Garofalo MA, Kettelhut IC, Roselino JE, Migliorini RH. Effect of acute cold exposure on norepinephrine turnover rates in rat white adipose tissue. J Auton Nerv Syst 60: 206–208, 1996 [DOI] [PubMed] [Google Scholar]
- 26.Gautier H. Interactions among metabolic rate, hypoxia, and control of breathing. J Appl Physiol 81: 521–527, 1996 [DOI] [PubMed] [Google Scholar]
- 27.Giesbrecht GG, Fewell JE, Megirian D, Brant R, Remmers JE. Hypoxia similarly impairs metabolic responses to cutaneous and core cold stimuli in conscious rats. J Appl Physiol 77: 726–730, 1994 [DOI] [PubMed] [Google Scholar]
- 28.Goldberg IJ, Eckel RH, Abumrad NA. Regulation of fatty acid uptake into tissues: lipoprotein lipase- and CD36-mediated pathways. J Lipid Res 50 Suppl: S86–S90, 2009 [DOI] [PMC free article] [PubMed] [Google Scholar]
- 29.Golozoubova V, Gullberg H, Matthias A, Cannon B, Vennstrom B, Nedergaard J. Depressed thermogenesis but competent brown adipose tissue recruitment in mice devoid of all hormone-binding thyroid hormone receptors. Mol Endocrinol 18: 384–401, 2004 [DOI] [PubMed] [Google Scholar]
- 30.Gordon CJ, Fogelson L. Comparative effects of hypoxia on behavioral thermoregulation in rats, hamsters, and mice. Am J Physiol Regul Integr Comp Physiol 260: R120–R125, 1991 [DOI] [PubMed] [Google Scholar]
- 31.Gordon CJ. The role of behavioral thermoregulation as a thermoeffector during prolonged hypoxia in the rat. J Thermal Biol 22: 315–324, 1997 [Google Scholar]
- 32.Hill JR. The oxygen consumption of new-born and adult mammals. Its dependence on the oxygen tension in the inspired air and on the environmental temperature. J Physiol 149: 346–373, 1959 [DOI] [PMC free article] [PubMed] [Google Scholar]
- 33.Hughes RL, Clode M, Edwards RH, Goodwin TJ, Jones NL. Effect of inspired O2 on cardiopulmonary and metabolic responses to exercise in man. J Appl Physiol 24: 336–347, 1968 [DOI] [PubMed] [Google Scholar]
- 34.Iampietro PF, Vaughan JA, Goldman RF, Kreider MB, Massucci F, Bass DE. Heat production from shivering. J Appl Physiol 15: 632–634, 1960 [DOI] [PubMed] [Google Scholar]
- 35.Jun JC, Drager LF, Najjar SS, Gottlieb SS, Brown CD, Smith PL, Schwartz AR, Polotsky VY. Effects of sleep apnea on nocturnal free fatty acids in subjects with heart failure. Sleep 34: 1207–1213, 2011 [DOI] [PMC free article] [PubMed] [Google Scholar]
- 36.Jun JC, Shin MK, Yao Q, Bevans-Fonti S, Poole J, Drager LF, Polotsky VY. Acute hypoxia induces hypertriglyceridemia by decreasing plasma triglyceride clearance in mice. Am J Physiol Endocrinol Metab 303: E377–E388, 2012 [DOI] [PMC free article] [PubMed] [Google Scholar]
- 37.Karp CL. Unstressing intemperate models: how cold stress undermines mouse modeling. J Exp Med 209: 1069–1074, 2012 [DOI] [PMC free article] [PubMed] [Google Scholar]
- 38.Kedem J, Levinger IM, Baum M, Rogel S. Heart rate and myocardial substrate preference during normal and hypoxic perfusion of the heart in vivo. Arch Int Physiol Biochim 83: 53–62, 1975 [DOI] [PubMed] [Google Scholar]
- 39.Kuwahira I, Gonzalez NC, Heisler N, Piiper J. Changes in regional blood flow distribution and oxygen supply during hypoxia in conscious rats. J Appl Physiol 74: 211–214, 1993 [DOI] [PubMed] [Google Scholar]
- 40.Livak KJ, Schmittgen TD. Analysis of relative gene expression data using real-time quantitative PCR and the 2[−Delta Delta C(T)] Method. Methods 25: 402–408, 2001 [DOI] [PubMed] [Google Scholar]
- 41.Lodhi IJ, Semenkovich CF. Why we should put clothes on mice. Cell Metab 9: 111–112, 2009 [DOI] [PubMed] [Google Scholar]
- 42.Louhija A. Hypertriglyceridemia in rats at simulated high altitudes. Experientia 25: 248–249, 1969 [DOI] [PubMed] [Google Scholar]
- 43.Louis M, Punjabi NM. Effects of acute intermittent hypoxia on glucose metabolism in awake healthy volunteers. J Appl Physiol 106: 1538–1544, 2009 [DOI] [PMC free article] [PubMed] [Google Scholar]
- 44.McGarry JD, Meier JM, Foster DW. The effects of starvation and refeeding on carbohydrate and lipid metabolism in vivo and in the perfused rat liver. The relationship between fatty acid oxidation and esterification in the regulation of ketogenesis. J Biol Chem 248: 270–278, 1973 [PubMed] [Google Scholar]
- 45.Mortola JP. Implications of hypoxic hypometabolism during mammalian ontogenesis. Respir Physiol Neurobiol 141: 345–356, 2004 [DOI] [PubMed] [Google Scholar]
- 46.Muratsubaki H, Enomoto K, Ichijoh Y, Yamamoto Y. Hypertriglyceridemia associated with decreased post-heparin plasma hepatic triglyceride lipase activity in hypoxic rats. Arch Physiol Biochem 111: 449–454, 2003 [DOI] [PubMed] [Google Scholar]
- 47.Newman D, Naimark A. Palmitate-14C uptake by rat lung effect of altered gas tensions. Am J Physiol 214: 305–312, 1968 [DOI] [PubMed] [Google Scholar]
- 48.Nilsson-Ehle P, Schotz MC. A stable, radioactive substrate emulsion for assay of lipoprotein lipase. J Lipid Res 17: 536–541, 1976 [PubMed] [Google Scholar]
- 49.Peltonen GL, Scalzo RL, Schweder MM, Larson DG, Luckasen GJ, Irwin D, Hamilton KL, Schroeder T, Bell C. Sympathetic inhibition attenuates hypoxia induced insulin resistance in healthy adult humans. J Physiol 590: 2801–2809, 2012 [DOI] [PMC free article] [PubMed] [Google Scholar]
- 50.Pino E, Wang H, McDonald ME, Qiang L, Farmer SR. Roles for peroxisome proliferator-activated receptor gamma (PPARgamma) and PPARgamma coactivators 1alpha and 1beta in regulating response of white and brown adipocytes to hypoxia. J Biol Chem 287: 18351–18358, 2012 [DOI] [PMC free article] [PubMed] [Google Scholar]
- 51.Porter WP, Kearney M. Size, shape, and the thermal niche of endotherms. Proc Natl Acad Sci USA 106: 19666–19672, 2009 [DOI] [PMC free article] [PubMed] [Google Scholar]
- 52.Prabhakar NR, Peng YJ. Peripheral chemoreceptors in health and disease. J Appl Physiol 96: 359–366, 2004 [DOI] [PubMed] [Google Scholar]
- 53.Reitman ML. Metabolic lessons from genetically lean mice. Annu Rev Nutr 22: 459–482, 2002 [DOI] [PubMed] [Google Scholar]
- 54.Ricart-Jane D, Cejudo-Martin P, Peinado-Onsurbe J, Lopez-Tejero MD, Llobera M. Changes in lipoprotein lipase modulate tissue energy supply during stress. J Appl Physiol 99: 1343–1351, 2005 [DOI] [PubMed] [Google Scholar]
- 55.Richard D, Picard F. Brown fat biology and thermogenesis. Front Biosci 16: 1233–1260, 2011 [DOI] [PubMed] [Google Scholar]
- 56.Roberts AC, Butterfield GE, Cymerman A, Reeves JT, Wolfel EE, Brooks GA. Acclimatization to 4,300-m altitude decreases reliance on fat as a substrate. J Appl Physiol 81: 1762–1771, 1996 [DOI] [PubMed] [Google Scholar]
- 57.Roberts AC, Reeves JT, Butterfield GE, Mazzeo RS, Sutton JR, Wolfel EE, Brooks GA. Altitude and β-blockade augment glucose utilization during submaximal exercise. J Appl Physiol 80: 605–615, 1996 [DOI] [PubMed] [Google Scholar]
- 58.Rosell S. Release of free fatty acids from subcutaneous adipose tissue in dogs following sympathetic nerve stimulation. Acta Physiol Scand 67: 343–351, 1966 [DOI] [PubMed] [Google Scholar]
- 59.Sant'Anna GM, Mortola JP. Thermal and respiratory control in young rats exposed to cold during postnatal development. Comp Biochem Physiol A Mol Integr Physiol 134: 449–459, 2003 [DOI] [PubMed] [Google Scholar]
- 60.Schmittgen TD, Livak KJ. Analyzing real-time PCR data by the comparative C(T) method. Nat Protoc 3: 1101–1108, 2008 [DOI] [PubMed] [Google Scholar]
- 61.Schnakenberg DD, Hoffman RA. Hypoxic inactivation of cold-induced brown fat thermogenesis. Experientia 28: 1172–1173, 1972 [DOI] [PubMed] [Google Scholar]
- 62.Scholander PF, Hock R, Walters V, Johnson F, Irving L. Heat regulation in some arctic and tropical mammals and birds. Biol Bull 99: 237–258, 1950 [DOI] [PubMed] [Google Scholar]
- 63.Sharma SK, Agrawal S, Damodaran D, Sreenivas V, Kadhiravan T, Lakshmy R, Jagia P, Kumar A. CPAP for the metabolic syndrome in patients with obstructive sleep apnea. N Engl J Med 365: 2277–2286, 2011 [DOI] [PubMed] [Google Scholar]
- 64.Stickney JC, Northup DW, Van Liere EJ. Blood sugar and dextrose tolerance during anoxia in the dog. Am J Physiol 154: 423–427, 1948 [DOI] [PubMed] [Google Scholar]
- 65.Swoap SJ, Li C, Wess J, Parsons AD, Williams TD, Overton JM. Vagal tone dominates autonomic control of mouse heart rate at thermoneutrality. Am J Physiol Heart Circ Physiol 294: H1581–H1588, 2008 [DOI] [PubMed] [Google Scholar]
- 66.Terrien J, Perret M, Aujard F. Behavioral thermoregulation in mammals: a review. Front Biosci 16: 1428–1444, 2011 [DOI] [PubMed] [Google Scholar]
- 67.Uchida K, Shiuchi T, Inada H, Minokoshi Y, Tominaga M. Metabolic adaptation of mice in a cool environment. Pflugers Arch 459: 765–774, 2010 [DOI] [PubMed] [Google Scholar]
- 68.Van TA, Scott NR, Hillman PE. The hypothalamus and thermoregulation: a review. Poult Sci 58: 1633–1639, 1979 [DOI] [PubMed] [Google Scholar]
- 69.Wang B, Wood IS, Trayhurn P. Hypoxia induces leptin gene expression and secretion in human preadipocytes: differential effects of hypoxia on adipokine expression by preadipocytes. J Endocrinol 198: 127–134, 2008 [DOI] [PubMed] [Google Scholar]
- 70.Way JM, Harrington WW, Brown KK, Gottschalk WK, Sundseth SS, Mansfield TA, Ramachandran RK, Willson TM, Kliewer SA. Comprehensive messenger ribonucleic acid profiling reveals that peroxisome proliferator-activated receptor gamma activation has coordinate effects on gene expression in multiple insulin-sensitive tissues. Endocrinology 142: 1269–1277, 2001 [DOI] [PubMed] [Google Scholar]
- 71.Wisneski JA, Gertz EW, Neese RA, Mayr M. Myocardial metabolism of free fatty acids. Studies with 14C-labeled substrates in humans. J Clin Invest 79: 359–366, 1987 [DOI] [PMC free article] [PubMed] [Google Scholar]
- 72.Wood SC. Interactions between hypoxia and hypothermia. Annu Rev Physiol 53: 71–85, 1991 [DOI] [PubMed] [Google Scholar]
- 73.Yokoe T, Alonso LC, Romano LC, Rosa TC, O'Doherty RM, Garcia-Ocana A, Minoguchi K, O'Donnell CP. Intermittent hypoxia reverses the diurnal glucose rhythm and causes pancreatic beta-cell replication in mice. J Physiol 586: 899–911, 2008 [DOI] [PMC free article] [PubMed] [Google Scholar]
- 74.Young PM, Rose MS, Sutton JR, Green HJ, Cymerman A, Houston CS. Operation Everest II: plasma lipid and hormonal responses during a simulated ascent of Mt. Everest. J Appl Physiol 66: 1430–1435, 1989 [DOI] [PubMed] [Google Scholar]
- 75.Zwemer CF, Song MY, Carello KA, D'Alecy LG. Strain differences in response to acute hypoxia: CD-1 versus C57BL/6J mice. J Appl Physiol 102: 286–293, 2007 [DOI] [PubMed] [Google Scholar]