Abstract
In the inner medulla, radial organization of nephrons and blood vessels around collecting duct (CD) clusters leads to two lateral interstitial regions and preferential intersegmental fluid and solute flows. As the descending (DTLs) and ascending thin limbs (ATLs) pass through these regions, their transepithelial fluid and solute flows are influenced by variable transepithelial solute gradients and structure-to-structure interactions. The goal of this study was to quantify structure-to-structure interactions, so as to better understand compartmentation and flows of transepithelial water, NaCl, and urea and generation of the axial osmotic gradient. To accomplish this, we determined lateral distances of AQP1-positive and AQP1-negative DTLs and ATLs from their nearest CDs, so as to gauge interactions with intercluster and intracluster lateral regions and interactions with interstitial nodal spaces (INSs). DTLs express reduced AQP1 and low transepithelial water permeability along their deepest segments. Deep AQP1-null segments, prebend segments, and ATLs lie equally near to CDs. Prebend segments and ATLs abut CDs and INSs throughout much of their descent and ascent, respectively; however, the distal 30% of ATLs of the longest loops lie distant from CDs as they approach the outer medullary boundary and have minimal interaction with INSs. These relationships occur regardless of loop length. Finally, we show that ascending vasa recta separate intercluster AQP1-positive DTLs from descending vasa recta, thereby minimizing dilution of gradients that drive solute secretion. We hypothesize that DTLs and ATLs enter and exit CD clusters in an orchestrated fashion that is important for generation of the corticopapillary solute gradient by minimizing NaCl and urea loss.
Keywords: aquaporin, concentrating mechanism, urea transport, tubule permeability, renal anatomy
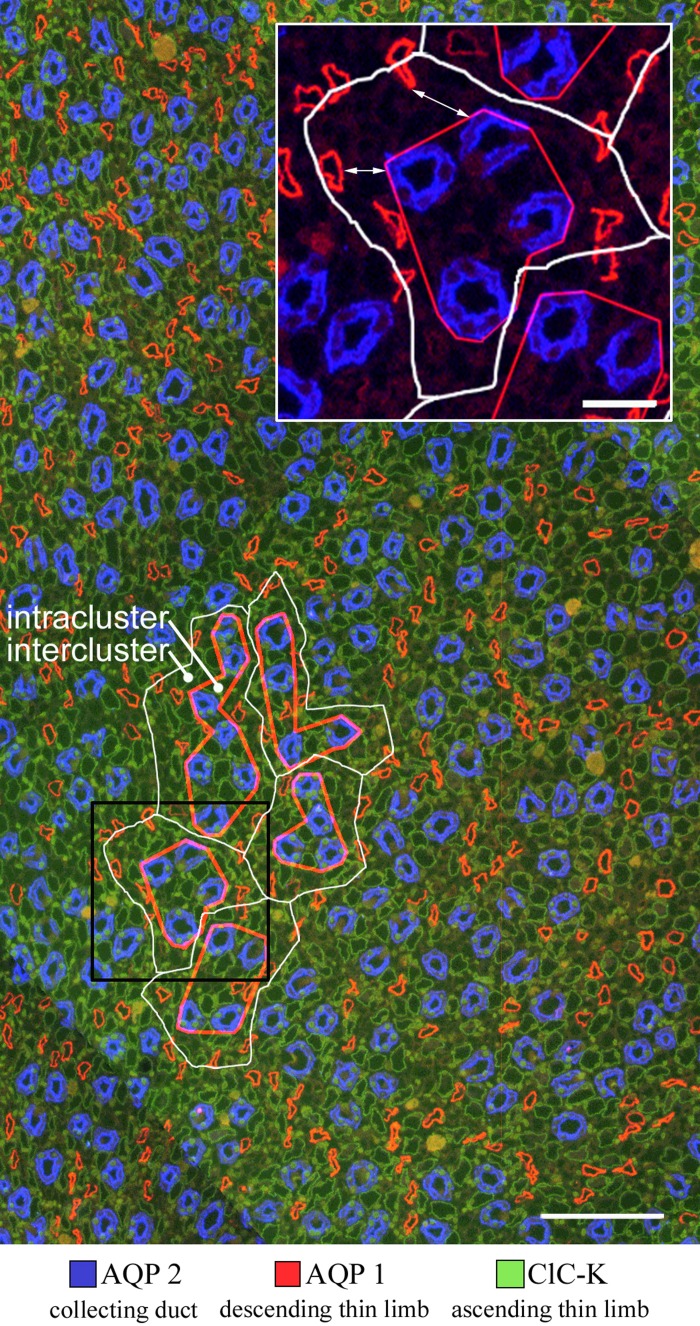
from the outer medullary-inner medullary (OM-IM) boundary to deep within the inner medulla (a length of ∼3.0–3.5 mm in rat kidneys), the dominating organizing structural elements for the arrangement of the thin limbs of Henle's loops and of the vasa recta are primary clusters of collecting ducts (CDs) (27, 28, 30). This organization produces two clearly distinct lateral regions, the intracluster and the intercluster regions (Fig. 1). The intracluster region includes the space occupied by CDs of each cluster and the intercluster region includes the space that separates CDs of adjacent primary clusters. AQP1-positive segments of descending thin limbs (DTLs) and UT-B-expressing descending vasa recta (DVR) lie almost entirely in the intercluster region. Ascending thin limbs (ATLs) and ascending vasa recta (AVR) are distributed almost uniformly throughout both the intracluster and intercluster regions (27, 28). The axial positioning of the AQP1-negative segment of the DTL, relative to the other tubular structures, has not been investigated in detail; however, since nearly all prebends abut CDs (25), the AQP1-negative DTLs must be repositioned from intercluster to intracluster region at some point along their length. In a similar fashion, some proportion of ATLs reposition from intracluster to intercluster region in their ascent (25).
Fig. 1.
Immunolocalization of AQP2, AQP1, and ClC-K in transverse section from rat inner medulla, located ∼400 μm below the outer medulla. Five primary clusters (outlined by white lines) make up a single secondary collecting duct (CD) cluster. Intercluster boundaries (white lines) are determined by Euclidean distance map technique; intracluster boundaries (red lines) are polygons drawn by eye. The combined area of the intercluster regions of the five primary clusters is 0.0235 mm2 and the combined area of the intracluster regions is 0.0169 mm2 (8). Black box outlines area shown in inset. Inset: arrow indicates nearest-neighbor distance between AQP1-positive descending thin limb (DTL) and CD. Scale bars, 100 μm; inset, 25 μm. Figure modified from Ref. 30.
ATLs and prebend segments lie in close association with CDs and AVR to form compartments called interstitial nodal spaces (INSs) (27). INSs lie primarily in the intracluster region and appear well suited to facilitate mixing of solute reabsorbed from ATLs or prebend segments (primarily NaCl) with solute reabsorbed from CDs (primarily urea) within a confined space (29). Reabsorption of urea and NaCl would raise the osmolality within the INS, thereby driving water reabsorption from CDs. The AVR are well positioned to serve as a conduit that carries reabsorbed water out of the inner medulla.
Our colleagues and we have hypothesized that thin limbs of Henle and blood vessels partition NaCl, urea, and water into and out of the INSs in a manner dependent on their transepithelial or transendothelial permeability characteristics, as well as their overall architecture (13, 14, 29). Therefore, the type of tubule segments that interact with the INS would further promote or constrain inner medullary countercurrent systems. In this study, we investigated quantitatively the relationship of the inner medullary thin limbs to the INSs, thereby providing insight into their potential contribution to solute mixing and the inner medullary urine-concentrating mechanism. Our aim was to determine the axial levels at which AQP1-negative DTLs and ATLs approach and move away from INSs, so as to more clearly understand the structures that form the INSs and the consequent fluid and solute partitioning.
METHODS
Animals.
Young male Munich-Wistar rats (average weight: 90 g) were purchased from Harlan Sprague Dawley (Indianapolis, IN). The animals were anesthetized with CO2. All experiments were conducted in accordance with the Guide for the Care and Use of Laboratory Animals (Washington, DC: National Academy Press, 1996) and approved by the Institutional Animal Care and Use Committee.
Tissue preparation.
Four kidneys from four male Munich-Wistar rats were prepared for immunocytochemistry by retrograde perfusion through the aorta with PBS (pH 7.4) for 5 min, followed by periodate-lysine-paraformaldehyde (0.01 M, 0.075 M, 2%) (22) in PBS (pH 7.4) for 5 min before removal from the animal. The whole medulla was dissected free, then immersed in a fixative for 3 h at 4°C, washed in PBS, dehydrated through an ethanol series, and embedded in Spurr's epoxy resin (Ted Pella). The OM-IM boundary was identified in all kidneys on the basis of structural criteria (i.e., presence or absence of thick ascending limbs) (12). In one kidney, serial 1-μm-thick transverse sections were cut beginning near the OM-IM boundary and continuing 3,000 μm in a papillary direction. Every fifth section was placed onto a glass microscope slide for immunohistochemistry (4 sections/slide). In three additional kidneys, at 1,000 μm below the OM-IM boundary, two serial 1-μm thick transverse sections were cut and were labeled for immunohistochemistry.
Immunohistochemistry.
Kidneys were prepared for immunohistochemistry as described previously. Two sets of serial, transverse sections were prepared for each kidney: one set labeled for nephrons and CDs, and one set labeled for vasa recta and CDs. In the first set, nephrons and CDs were labeled by indirect immunohistochemistry by using affinity-purified polyclonal or monoclonal mouse antibodies against the COOH-terminal of the human water channel AQP1 (diluted 1:100, raised in mouse, provided by Abcam no. 9566, or in chicken, provided by Dan Stamer, Duke University); the rat kidney-specific chloride channel ClC-K (diluted 1:200, raised in rabbit, Alomone no. ACL-004); the human water channel AQP2 (diluted 1:100, raised in goat, Santa Cruz no. SC-9882); and either a bovine monoclonal antibody raised against purified αβ-crystallin (diluted 1:50, raised in mouse, Stressgen no. SPA-222) or fluorescein-labeled wheat germ agglutinin (Vector Laboratories no. FL-1021). AQP1 is generally expressed in cells of DTLs, and AQP2 is generally expressed in the principal cells of CDs. Therefore, AQP1 and AQP2 antibodies can serve as markers for DTLs and CDs, respectively. The ClC-K antibody used in these studies binds to epitopes of both ClC-K1 and ClC-K2; however, there is no evidence that ClC-K2 is expressed in the inner medullary thin limbs. Therefore, in the inner medulla this antibody serves to identify ClC-K1. Because ClC-K1 is expressed only in ATLs in the inner medulla (29, 32), this antibody serves as a marker for these tubules. αB-Crystallin is expressed in DTLs, ATLs, and CDs, and wheat germ agglutinin labels all tubules and vessels. Therefore, the latter two probes serve as common markers for tubular and vascular structures.
In the second set of sections, DVR and AVR were labeled by indirect immunohistochemistry using affinity-purified polyclonal antibodies against rat urea transporter UT-B (diluted 1:200, raised in rabbit, provided by Jeff Sands and Janet Klein, Emory University) and rat PV-1, a plasmalemmal vesicle protein (diluted 1:500, raised in chicken, provided by Radu Stan, Dartmouth College). PV-1 is a component of the fenestral diaphragm and its physiological function is presently poorly understood. In the rat inner medulla, the AVR are fenestrated and believed to have diaphragms; therefore PV-1 antibodies serve as a marker for AVR. Some DVR express UT-B and AQP1; these AQP1-positive DVR can be distinguished from DTLs by their relatively thin endothelia and by their relatively small diameter compared with DTLs. CDs were labeled for AQP2 as described above. Image overlays showing both blood vessels and nephrons together were obtained from two sections offset from each other by no more than 5 μm.
Before antibody application, Spurr resin was etched by applying to each slide a solution consisting of 5 g NaOH, 5 ml 100% ethanol, and 5 ml propylene oxide for 3 min (21) followed by washing with 100% ethanol and distilled water. Sections were then treated with 0.2% Triton X-100 in PBS (PBS-0.2% Triton) for 2 min and 1% SDS in PBS for 5 min. They were then washed with PBS-0.2% Triton 3 × 5 min. Next they were treated with a blocking solution consisting of 5% BSA, 1% normal donkey serum, and 0.2% Triton diluted in PBS. Primary antibodies diluted in the blocking solution were then applied simultaneously overnight at 4°C followed by three 5-min washes with PBS-Triton.
Secondary antibodies produced in donkey and conjugated to FITC, TRITC, CY5, or DAPI (Jackson ImmunoResearch, diluted 1:200 or 1:100 in PBS-Triton) were applied simultaneously for 2 h at room temperature ending with three 5-min washes with PBS-Triton. Sections were mounted with Dako fluorescent mounting medium (Carpinteria, CA) and were viewed with epifluorescence microscopy via ×10 or ×20 objectives.
Image analysis.
Serial images were obtained by capturing AQP1, AQP2, ClC-K1, αB-crystallin, FITC-wheat germ agglutinin, UT-B, or PV-1 indirect immunofluorescence from each tissue section. Quantitative analyses were carried out on the images by use of Photoshop (Adobe) and the Image Processing Toolkit (Reindeer Graphics) and Amira visualization software (Visage Imaging).
Quantitative analyses consisted of measuring the lateral distance between each loop of Henle and its nearest CD. For four kidneys, the distance between each AQP1-positive DTL and each AQP1-negative DTL and its nearest CD neighbor was measured for a single section from 1,000 μm below the OM-IM boundary. For a single secondary CD cluster from one kidney, the distance between each segment of the thin limb of Henle and its nearest CD neighbor was measured for every section (600 sections for a total of 3,000 μm) beginning at the OM-IM boundary and continuing in a papillary direction.
The volume shrinkage factor for ethanol dehydration of rat medullary tissue has been reported to be ∼20% (1) and the linear shrinkage factor has been reported to be ∼20 to 25% (6). Thus the linear distances that we report would underestimate the distances measured for fresh tissue by a maximum of ∼20–25%.
Statistical analyses.
Data combined from three or more samples are reported as means and SE (N = number of replicates). The statistical significance of differences between means for each category of two data sets was determined with two-sample t-test (P < 0.05) and significance of differences between means for multiple data sets was determined with ANOVA and Duncan's post hoc test (P < 0.05).
RESULTS
Compartmentation of thin limbs of loops of Henle in the outer zone of the inner medulla.
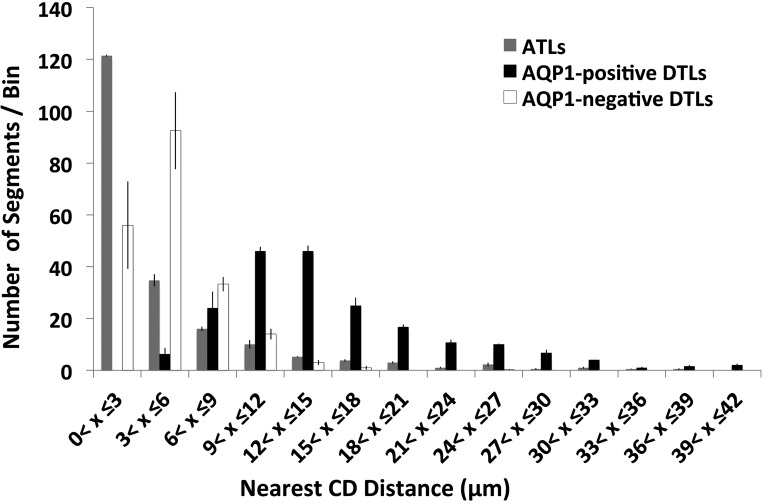
To quantify the distribution of DTLs and ATLs in the intercluster and intracluster regions, and their proximity to INSs, the distance from the basal membrane of each DTL or ATL to the basal membrane of the nearest CD was measured in transverse tissue sections. Distances were measured for 200 AQP1-positive DTLs, 200 AQP1-negative DTLs, and 200 ATL/prebends from the inner medullas of four kidneys, from four different animals, in an area of about ∼1 mm2, at 1,000 μm below the OM-IM boundary. A depiction of nearest CD distance for AQP1-positive DTLs is shown in Fig. 1 (inset). ClC-K1-positive segments of the terminal DTL (prebend segment) were included with ATLs as these are indistinguishable from each other. Distances were allocated into bins to more clearly show the lateral distribution (Fig. 2). About 95% of AQP1-positive DTLs lie at a distance greater than 6 μm from their nearest CDs (mean of 15.3 ± 0.9 μm for 200 segments ± SE), whereas ∼75% of AQP1-negative DTLs lie less than 6 μm from their nearest CD (4.5 ± 0.3 μm). About 75% of ATL/prebends lie less than 6 μm from their nearest CD (4.4 ± 0.3 μm). The mean distance of the AQP1-positive DTLs from the nearest CD (15.3 μm) is significantly greater than the distances of AQP1-negative or ATL/prebend (4.5 μm and 4.4 μm) (P < 0.05; ANOVA), whereas the latter two distances are not significantly different from each other. We have previously shown that prebend and equivalent length postbend segments of the ATL abut CDs along their entire lengths (25).
Fig. 2.
Average number of AQP1-positive DTLs, AQP1-negative DTLs, and ascending thin limbs (ATLs) grouped according to their nearest-neighbor CD distance (means ± SE, n = 4 kidneys, from 4 animals). The numbers of segments were grouped into bins that each span 3 μm. Nearest-neighbor CD distances for 200 of each segment, from each kidney, were measured on a transverse tissue section located ∼1,000 μm below the outer medullary-inner medullary (OM-IM) boundary. The number of ATLs per bin declines exponentially with respect to nearest CD distance (y = 73.3e−1E−03x; R2 = 0.94). See results for additional details.
Interestingly, the number density of ATLs, and to some extent the number density of AQP1-negative DTLs, declines with increasing distance from the CD cluster at a near exponential rate (compare histograms in Fig. 2). This relationship can be explained as follows. Loops of Henle form “bends” at all levels along the corticopapillary axis, and the total loop population of the rat medulla declines in number at progressively deeper depths. This decline in loop number approximates that of an exponential “loop decay rate” (9, 17, 30). As noted, we have previously shown that all loop bends abut CDs within CD clusters (25). As we show below, the AQP1-negative descending and ascending segment of each loop lie progressively closer to CDs at progressively lower axial levels. Therefore, at any axial level, an exponential relationship, at least roughly comparable to the loop decay rate, might also be predicted to occur between the number density of loop segments and their distance from the CD cluster for the total population of loops.
In contrast, the number density of AQP1-positive DTLs is distributed almost normally around a mean of ∼12 μm (Fig. 2). Therefore, each AQP1-positive DTL lies within the intercluster region, its distance from the CD cluster being proportional to its loop length.
Compartmentation of reconstructed thin limbs of loops of Henle along their entire inner medullary lengths.
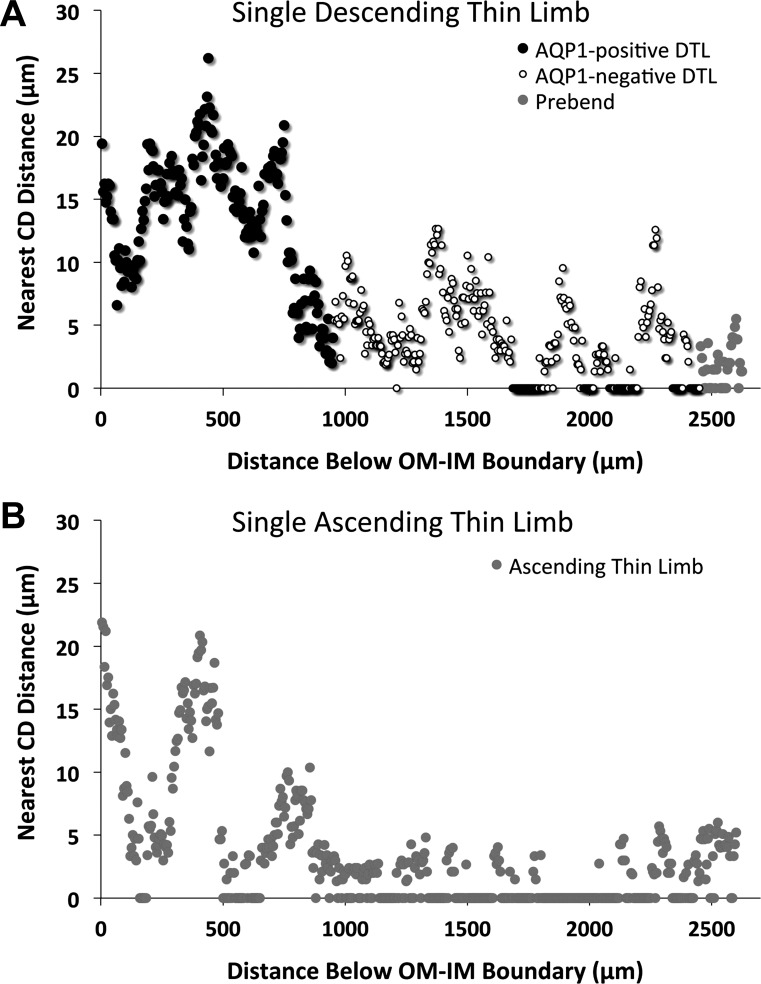
We then analyzed all of the loops of Henle expressing inner medullary AQP1 that were associated with one secondary CD cluster from one kidney. This analysis included loops that formed their bends at least 1,200 μm but no more than 3,500 μm below the OM-IM boundary. Inclusion within the CD cluster was determined by Euclidean distance mapping (30) (Fig. 1). Nearest-neighbor CD distances were determined for each DTL and its corresponding ATL (N = 42) in serial transverse sections at 5-μm intervals along the entire inner medullary axial length of each loop. One example that illustrates results from a single loop of Henle is shown in Fig. 3. The AQP1-positive segment of the DTL lies furthest away from the CDs (19.41 μm) at the OM-IM boundary and approaches CDs as it descends (Fig. 3A). This loop expresses no detectable AQP1 at levels deeper than 955 μm below the outer medulla, and at this point the AQP1-negative segment lies closer to the CDs (5.37 μm) than does most of the AQP1-positive segment. The loop increasingly contacts CDs toward its terminus and at the prebend segment. The ascending segment of this loop (Fig. 3B) makes contact with CDs for most of its length as it ascends, but it moves away from the CDs as it nears the OM-IM boundary.
Fig. 3.
Nearest-neighbor CD distances for descending and ascending segments of a single loop of Henle, as they descend and ascend the corticopapillary axis. A: the AQP1-positive DTL lies distant from the CDs during the initial descent from 0 to ∼700 μm and thereafter approaches the CDs, the AQP1-negative DTL begins contacting CDs toward its terminus (below ∼1,700 μm), and the prebend lies close to or in contact with CDs for most of its descent. B: the ATL makes contact with CDs for most of its ascent between 1,000 and 2,500 μm but moves away from CDs as it nears the OM-IM boundary.
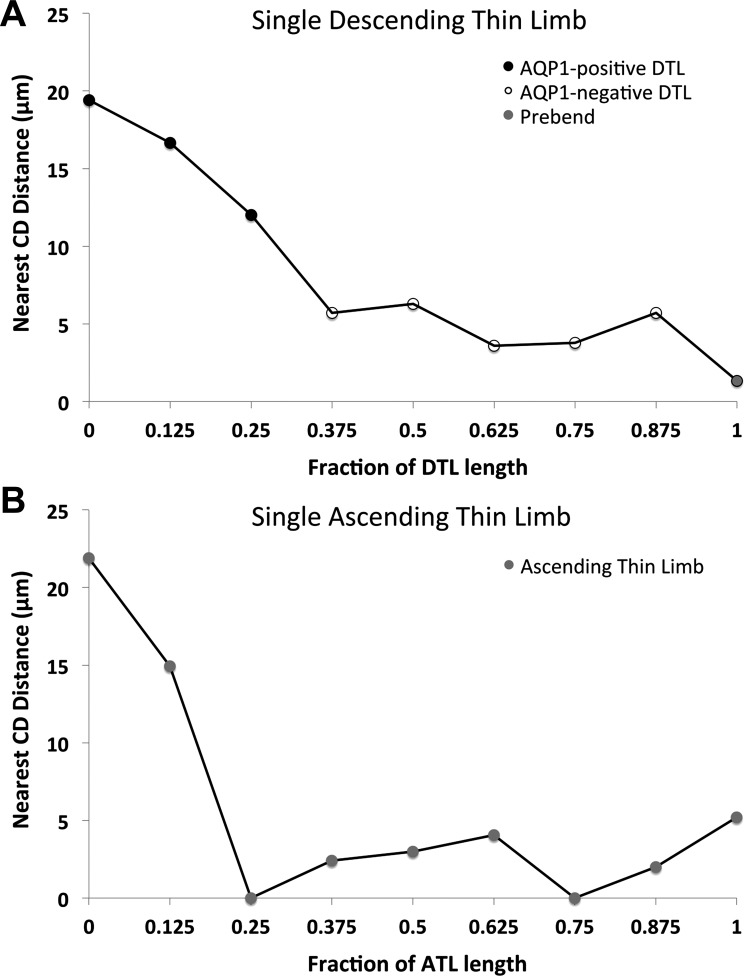
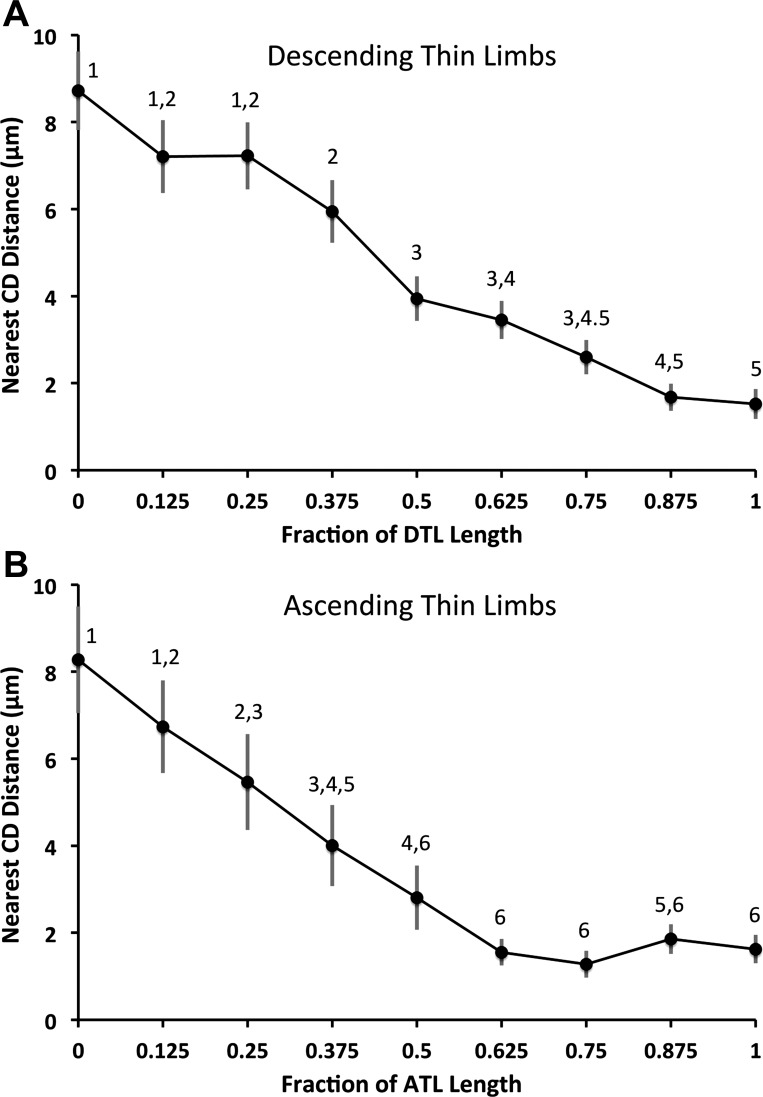
Because the 42 loops of Henle analyzed were of varying lengths, and to assess the average points along the corticopapillary axis at which DTLs enter and ATLs exit the intracluster region, DTL and ATL lengths were fractionated into eight proportional segment lengths for comparison. Each segment is equivalent to 12.5% of each DTL or ATL total length. The loop displayed in Fig. 3 is shown in Fig. 4 with its length fractionated and the corresponding nearest CD distance for each interval. The patterns of loop proximity to CDs for nonfractionated loops are similar to the patterns seen for fractionated loops. The nearest CD distances at each of the nine fractional points are shown for all 42 loops of Henle studied in Fig. 5. At the OM-IM boundary, the DTLs lie at a mean of 8.7 μm from the nearest CD, and at the loop terminus, they lie at a mean of 1.5 μm away from the nearest CD. ATLs lie at a mean of 1.6 μm away from the nearest CD as they begin to ascend and at a mean of 8.3 μm from the nearest CD at the OM-IM boundary.
Fig. 4.
Nearest-neighbor CD distances for descending and ascending segments of a single loop of Henle (same loop shown in Fig. 3) at fractionated lengths along the corticopapillary axis. A: the DTL lies farthest away from the CDs at the OM-IM boundary and it nearly contacts CDs at its terminus (the prebend). B: the ATL lies near CDs for most of its length upon ascent but moves away from CDs as it nears the OM-IM boundary.
Fig. 5.
Nearest-neighbor CD distances for descending and ascending segments of loops of Henle from a single secondary CD cluster determined at fractionated axial lengths (means ± SE; N = 42 loops). A: DTLs are farthest away from CDs at the OM-IM boundary, where they lie in the intercluster region, and gradually approach CDs at deeper levels. B: ATLs ascend in relatively close contact with CDs for ∼38% of their length immediately after the bend (the fraction lying between 0.625 to 1 on the abscissa) before moving away from CDs. Points labeled with common numerals are not significantly different from each other.
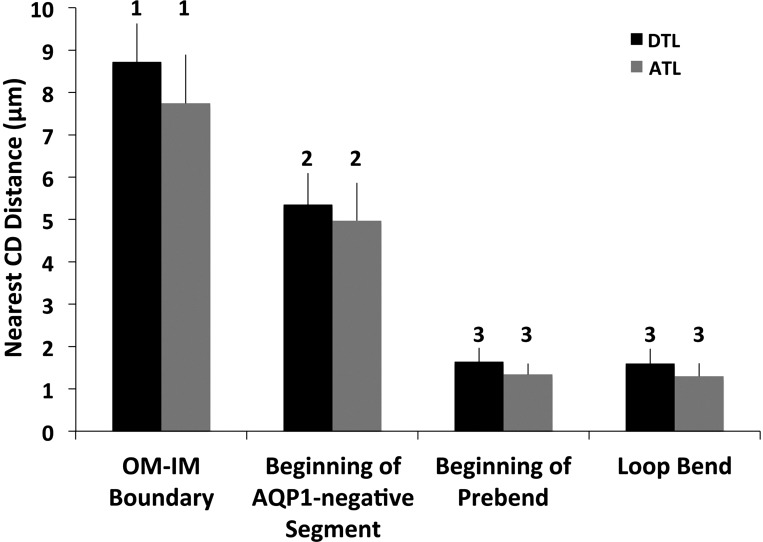
Another summary displaying the relationships of all loops of the single secondary CD cluster is shown in Fig. 6. This figure shows the nearest-neighbor CD distances for each defined descending segment (AQP1-positive segment beginning at the OM-IM boundary, beginning of the AQP1-negative segment, beginning of the prebend segment, and the loop bend), and for the equivalent intervals of the corresponding ATLs. At the OM-IM boundary, the AQP1-positive segments of the DTLs lie at a mean of 8.7 μm away from their nearest CD, lying in the intercluster region. At the beginning of their AQP1-negative segments they were within a mean of ∼5 μm from their nearest CD, and at the beginning of the prebend segment and at the loop bend they were at a mean of less than 1 μm from their nearest CD. For this particular CD cluster, the ATLs lie, on average, at a closer or equal distance to the nearest CD, compared with the DTL segments at each of the four levels shown. They were only ∼7.5 μm from the nearest CD at the OM-IM boundary.
Fig. 6.
Nearest-neighbor CD distances for descending segments of loops of Henle from a single secondary CD cluster (same loops shown in Fig. 5; means ± SE; N = 42 loops). The nearest-neighbor CD distances were determined for the AQP1-positive segment at the OM-IM boundary, at the beginning of the AQP1-negative segment, at the beginning of the prebend segment, and at the loop bend. The nearest CD distances for ATLs at equivalent levels were also determined. Points labeled with common numerals are not significantly different from each other.
Solute secretion in the intercluster region.
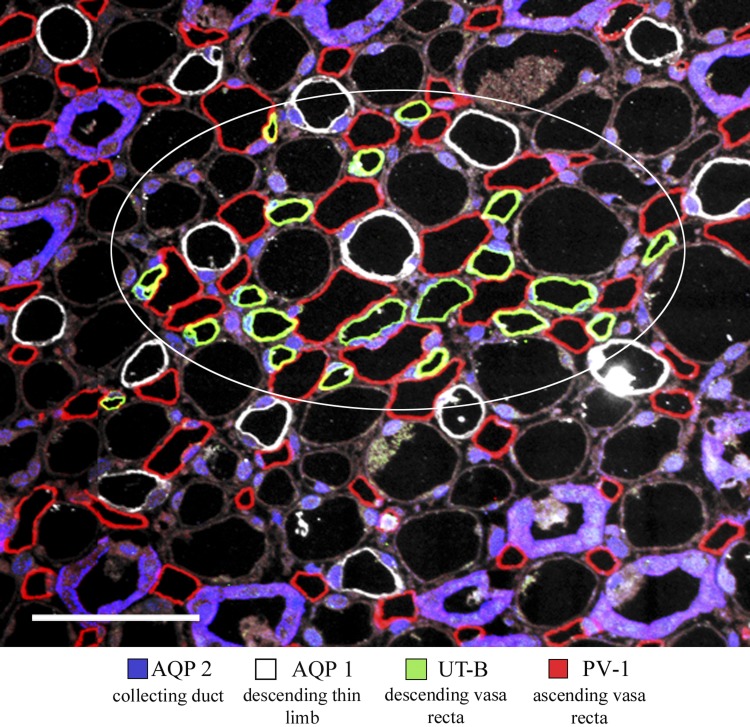
Parallel arrangements of AVR and DVR that are juxtaposed within vascular bundles support countercurrent exchange in the intercluster region (29, 33). This process involves urea and NaCl secretion into DVR (19, 23, 24). Fluid reabsorbed by AQP1-expressing DTLs and DVR potentially dilutes the interstitial fluid of the intercluster region, thereby reducing the driving force for solute secretion into DVR. However, the AVR are juxtaposed with descending segments in a manner that likely minimizes dilution of the intercluster interstitium. Within the intercluster region, at least one AVR intervenes between each DTL and any neighboring DVR, thereby minimizing abutments between the two structures (Fig. 7). To quantify the interactions between these segments, we measured the length of circumferential abutment between each DTL and any abutting DVR or AVR, across an area of 0.08 μm2 at a depth of ∼500 μm below the outer medulla, for the inner medulla from each of three kidneys. The length of abutment between each AQP1-positive DTL and AVR (along their circumference) was 13.1 ± 0.8 μm (mean ± SE), whereas there was virtually no abutment between each AQP1-positive DTL and DVR (0.7 ± 0.5 μm, mean ± SE; significantly different from DTL-to-AVR abutments, P < 0.05).
Fig. 7.
Immunolocalization of AQP2, AQP1, UT-B, and PV-1 in transverse section from rat inner medulla, located ∼250 μm below the outer medulla. A single vascular bundle (enclosed by white circle) and associated DTLs lie in the intercluster region. Ascending vasa recta (AVR) nearly always lie between AQP1-positive DTLs and UT-B-positive descending vasa recta (DVR). Scale bar 50 μm.
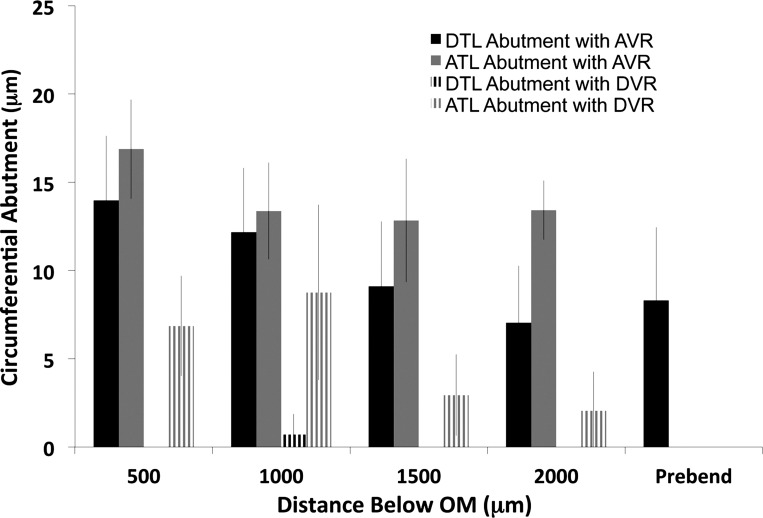
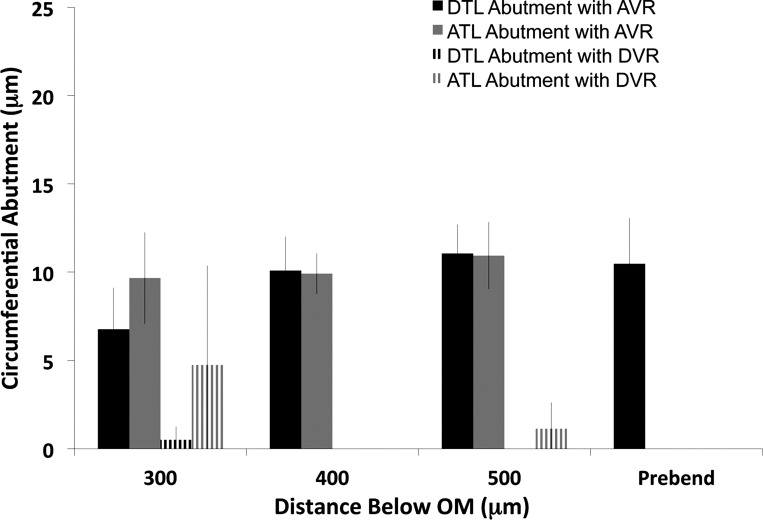
For a single medulla, we traced six loops that formed their bends at a mean depth of 2,600 μm below the outer medulla (Fig. 8, longer loops) and four loops that formed their bends at a mean depth of 675 μm below the outer medulla (Fig. 9, shorter loops) and measured the same abutments at regular intervals. For these ten loops, the DTL abutment with AVR was very high, whereas the DTL abutment with DVR was very low, consistent with the sectional analysis of three kidneys at 500 μm below the outer medulla (see above).
Fig. 8.
Lengths of inner medullary loop of Henle circumferential abutment with DVR or AVR. Segments included DTLs, ATLs, and prebend segments from loops forming bends at ∼2,000 μm below the outer medulla. Circumferential abutment lengths were measured at 500-μm intervals below the outer medulla (OM). Absence of a column signifies no abutment. Values are mean ± SE, N = 6 loops from a single inner medulla. DTL abutments with DVR are essentially zero and significantly less than all DTL abutments with AVR. ATL abutments with DVR are significantly higher than DTL abutments with DVR at 500 and 1,000 μm below the outer medulla, but not at 1,500 and 2,000 μm below the outer medulla.
Fig. 9.
Lengths of inner medullary loop of Henle circumferential abutment with DVR or AVR. Segments included DTLs, ATLs, and prebend segments from loops forming bends at ∼500 μm below the outer medulla. Circumferential abutment lengths were measured at 500-μm intervals below the outer medulla. Absence of a column signifies no abutment. Values are means ± SE, N = 4 loops from a single inner medulla. DTL abutments with DVR are essentially zero and significantly less than all DTL abutments with AVR. ATL abutments with DVR are not significantly different from DTL abutments with DVR at all levels.
Estimation of effective permeabilities for Na and urea.
On the basis of the morphometric data presented in this study, we estimated effective permeabilities (Peff) for Na and urea between the intracluster and intercluster regions, and between two structures that lie in the same or different regions. Effective permeability between two structures was calculated as 1/Peff = 1/P1 + 1/P2 + 1/P3, where subscripted P values represent permeabilities of the two structures and the interstitial compartment. Tubular transmural permeability values (Table 1) were taken from Layton et al. (14, 16). For Peff calculations, diffusivities in water are reduced by a factor of five owing to interstitial viscosity (15). Path lengths between two points in the transverse dimension are shown in Table 2. The path length between the two regions was taken as the mean maximum distance between an AQP1-positive DTL and its nearest CD (15.3 μm), as reported above.
Table 1.
Parameter values
| PNa, 10−5 cm/s | Purea, 10−5 cm/s | Diffusivity, 10−5 cm2/s | |
|---|---|---|---|
| DTL+ | 0 | 13 | |
| DTL− | 0 | 180 | |
| ATL | 80 | 190 | |
| CD | 1 | 35 | |
| DVR | 76 | 360 | |
| AVR | 750 | 690 | |
| Na | 0.3 | ||
| Urea | 0.276 |
Values from Refs. 13 and 16. For effective permeability (Peff) calculations, diffusivity values are reduced by fivefold (from the correct values of 1.5 for Na and 1.38 for urea) due to interstitial viscosity (15). PNa, Na permeability; Purea, urea permeability; DTL+, AQP1-positive descending thin limbs (DTL); DTL−, AQP1-negative DTL; ATL, ascending thin limb; CD, collecting duct; DVR, descending vasa recta; AVR, ascending vasa recta.
Table 2.
Path length between structures
| Structure 1 | Structure 2 | μm |
|---|---|---|
| CD | DTL+inter | 15.3 |
| CD | DTL−inter | 15.3 |
| CD | DTL−intra | 4.5 |
| CD | AVRinter | 15.3 |
| CD* | AVRintra | 0.5 |
| CD | ATLinter | 15.3 |
| CD | ATLintra | 4.4 |
| ATLintra | AVRinter | 15.3 |
| ATLintra | AVRintra | 0.5 |
| DTL+ | AVRintra | 15.3 |
| DVR | AVRintra | 15.3 |
| DTL−inter | AVRintra | 15.3 |
| DTL−intra | AVRintra | 0.5 |
Mean path length at 1 mm below the outer medulla.
From Ref. 27. intra, Intracluster; inter, intercluster.
Passive solute fluxes between two compartments depend largely on solute concentrations in the various compartments, and these depend at least in part on luminal fluid and solute flow rates; nonetheless, the Peff estimates (Table 3) provide potentially useful indexes of the variability and relative degree of solute flows that could occur between compartments. The Peff estimates suggest that there is a slight preferential flow of urea from the CD into the “nearbend” intracluster ATLs relative to flow into more distal intercluster ATLs (16% difference). As a result of the large difference in transepithelial urea permeabilities between AQP1-positive and AQP1-negative DTL, the Peff for urea between CD and intercluster AQP1-negative DTL is markedly greater than the Peff between CD and AQP1-positive DTL (180% difference). This permeability difference will increase slightly as the AQP1-negative DTL continues to descend and gradually approach the CDs. Overall, the highest Peff for urea exists between AVR and AQP1-negative DTLs, regardless of whether either structure lies in the intercluster or intracluster region. Na reabsorbed from the intracluster ATL flows preferentially into the intracluster AVR, relative to the intercluster AVR (35% difference). Na permeabilities between other compartments are nearly equal, indicating that little or no preferential flows arise on the basis of permeability characteristics.
Table 3.
Peff between regions and structures
| Effective Permeability, 10−5 cm/s |
|||
|---|---|---|---|
| Structure 1 | Structure 2 | PNa | Purea |
| DTL+ | AVRinter | — | 12.76 |
| DTL+ | AVRintra | — | 11.92 |
| DTL−inter | AVRinter | — | 142.76 |
| DTL−inter | AVRintra | — | 79.69 |
| DTL−intra | AVRintra | — | 139.16 |
| CD | AVRinter | 0.99 | 28.12 |
| CD | AVRintra | 1.00 | 33.11 |
| CD | ATLinter | 0.98 | 25.39 |
| CD | ATLintra | 0.99 | 29.41 |
| CD | DTL+inter | — | 9.01 |
| CD | DTL−inter | — | 25.21 |
| CD | DTL−intra | — | 27.97 |
| ATLintra | AVRinter | 52.82 | — |
| ATLintra | AVRintra | 71.43 | — |
| CD | DVRinter | 0.98 | 27.11 |
| Rintra | Rinter | 196.08 | 180.39 |
R, region.
DISCUSSION
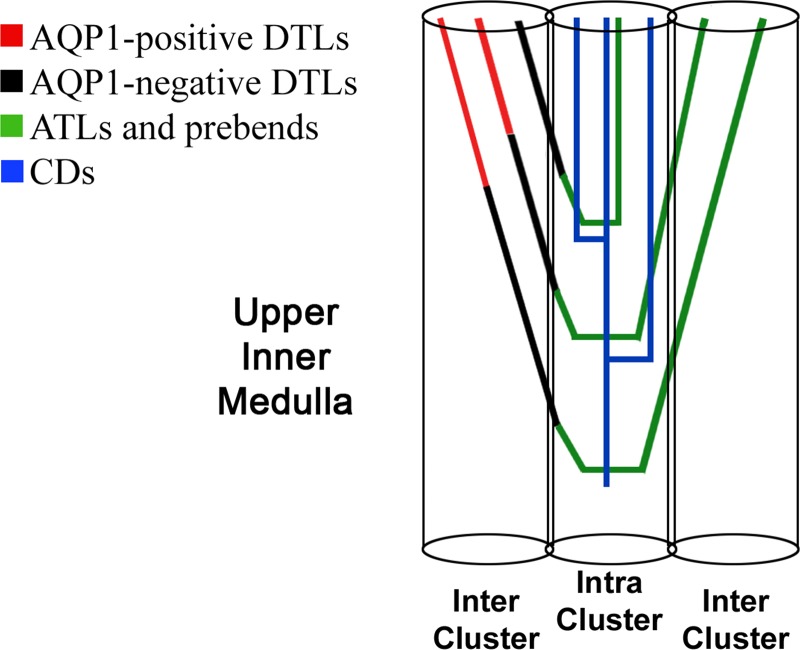
The inner medullary loop of Henle follows clearly defined pathways in its descent and ascent along the corticopapillary axis (Fig. 10). Inner medullary AQP1-positive DTLs lie predominantly in the intercluster region, where they have minimal interactions with CDs and interstitial nodal spaces. This architecture is depicted in Fig. 1 and described quantitatively in Fig. 2 (shown for a level 1,000 μm below the outer medulla). As shown in Fig. 5, nearest CD distance measurements for reconstructed DTLs indicate that, regardless of loop length, and throughout their descent, the AQP1-negative DTL segments become progressively more closely associated with the intracluster region, and, therefore, also with the interstitial nodal spaces. This relationship becomes statistically significant near the midpoint of the total DTL axial length (AQP1-positive plus AQP1-negative segments). The number density of CDs remains relatively unchanged with depth through the first 3 mm of the rat inner medulla, whereas the number density of loops of Henle declines by ∼20–30% (9). Therefore, the lateral movement of AQP1-negative DTLs toward the CDs is not due simply to the well-known narrowing of the papilla. These results support previous qualitative estimates that the DTLs of loops with shallow bends lie closer to CDs than do the DTLs of loops with deep bends (28).
Fig. 10.
Schematic organization of loops of Henle and CDs in the upper inner medulla of rat kidney. DTLs lie in the intercluster region for most of their length and enter the intracluster region at a short proximal distance above the prebend segment. ATLs lie in the intracluster region for the innermost 50% of their length, with equal numbers of ATLs lying in the intracluster and intercluster regions for the outermost 50% of their length.
Fluid reabsorption from and solute secretion into the AQP1- and UT-B-positive DVR in the outer inner medulla are considered to concentrate luminal solutes and reduce the fluid load delivered to the deep inner medulla. Although the positioning of AQP1-positive DTLs outside the intracluster region minimizes the potential impact of their reabsorbed fluid on solute mixing within the INSs, it could be detrimental to fluid and solute flows into or out of DVR within the intercluster region. Here again, as with the intracluster region, the urine-concentrating mechanism is aided by AVR architecture. As can be seen in Fig. 7, at least one fenestrated, highly water-permeable AVR generally is positioned between each AQP1-positive DTL and its nearby DVR within the intercluster region. These AVR can be distinguished from interconnecting capillaries by the fact that they typically do not abut CDs (33). Fluid reabsorbed from DTLs may tend to be selectively routed into AVR. Functional studies have shown net fluid reabsorption from DVR occurs in the axial descent (34), yet overall fluid outflows from the inner medulla via AVR exceed fluid inflows via DVR, in support of mass balance; thus this architecture would have an effect consistent with functional studies.
Our previous studies have indicated that ATLs are not randomly distributed laterally across the inner medulla (28, 30) and our present results indicate that they tend to be more densely distributed in the intracluster region (shown in Fig. 2 at a level 1,000 μm below the outer medulla). Distance measurements of reconstructed ATLs associated with a single secondary CD cluster indicate, that, as they ascend, the ATLs remain within the intracluster region for most of their length. However, the most distal ascending segments of some loops remain in the intracluster region whereas others move into the intercluster region. Apparently, a greater fractional ascending segment of those loops with the deepest bends moves into the intercluster region, whereas a greater fractional ascending segment of shorter loops tends to remain within the intracluster region.
A recent mathematical model has suggested that interstitial urea concentrations of intracluster INSs could significantly exceed urea concentrations of the intercluster region (16). This model provides a hypothetical framework for evaluating loop architecture with reference to urea and water fluxes. The AQP1-negative DTLs of rat and chinchilla are relatively water impermeable (3, 4); however, previous studies in hamster and rat have shown that tubular fluid osmolality continues to increase as the DTL descends (5, 7, 18, 20). Near the bend, tubular fluid and interstitial fluid osmolality are nearly equivalent. Thus solutes must be secreted into the AQP1-negative segment of DTLs as they approach the nodal spaces. Urea entering the DTL lumen could be derived from several medullary urea-recycling pathways, pathways that include both DVR and CDs (10) and perhaps ATLs (29). Significant but less urea secretion occurs into the AQP1-positive DTL segment, where transepithelial urea permeabilities are lower than those of the AQP1-negative DTL (Dantzler WH, Evans KK, and Pannabecker TL, unpublished observations) (2). We hypothesize that three-dimensional architecture plays a role in this process, since at any transverse level a given structure in the intercluster region is distant from a CD, whereas a structure in the intracluster region is near a CD. When the DTL lies in close proximity to a CD (as occurs for the intracluster region), urea secretion into the DTL will be favored, as this region likely provides a more favorable peritubular-to-lumen concentration gradient.
The ATL of rat and chinchilla has very high transepithelial urea permeability; therefore, the magnitude of NaCl reabsorption in excess of urea secretion (11, 31) could potentially be limited if the ATLs were to border interstitial nodal spaces for too long a distance (16). This could markedly diminish the urine-concentrating mechanism. In their ascent, ATLs of some loops leave the intracluster region and move laterally toward the intercluster region. A low ATL transepithelial urea permeability would minimize urea reabsorption, leading to excessive urea outflow from the medulla that would be detrimental to the urine-concentrating mechanism. In contrast, a high ATL transepithelial urea permeability would be beneficial to the urine-concentrating mechanism, since it will allow urea reabsorption. Countercurrent urea flows between ATLs and DTLs or DVR would minimize urea loss from the inner medulla. Reabsorption would be maximized and loss of urea would be minimized if a substantial portion of the ATL resides in a region of low urea concentration, i.e., in the intercluster region, a region distant from CDs (Fig. 10). Since ATLs are almost completely impermeable to water, urea reabsorption would dilute luminal fluid, thereby contributing to net water outflow from the inner medulla.
In summary, we hypothesize that loops enter and exit clusters so as to maximize overall interactions of DTLs, prebends, and ATLs with vessels and CDs associated with interstitial nodal spaces, thereby optimizing fluid and urea reabsorption from CDs (Fig. 10). A lateral separation of descending and ascending segments of each loop of Henle is depicted in Fig. 10 to emphasize loop passages through both intercluster and intracluster regions. This is true for some loops; however, descending and ascending segments of other loops may abut each other within the same regions as they pass along the corticopapillary axis (26). The morphometric data presented in this study enable us to estimate the Peff associated with loop of Henle, CD, and AVR structure-to-structure Na and urea flows of the “outer inner medulla,” thereby providing potential insights into preferential solute flows in the transverse dimension. The impact of the Peff will be more thoroughly assessed with a comprehensive mathematical simulation of medullary fluid and solute flows.
GRANTS
This study was supported by National Institutes of Health Grant DK-083338.
DISCLOSURES
No conflicts of interest, financial or otherwise, are declared by the author(s).
AUTHOR CONTRIBUTIONS
Author contributions: K.Y.W. and B.J.S. performed experiments; K.Y.W., B.J.S., and T.L.P. analyzed data; K.Y.W. and T.L.P. interpreted results of experiments; K.Y.W., B.J.S., and T.L.P. prepared figures; K.Y.W. drafted manuscript; W.H.D. and T.L.P. conception and design of research; W.H.D. and T.L.P. edited and revised manuscript; T.L.P. approved final version of manuscript.
REFERENCES
- 1. Bankir L, Fischer C, Fischer S, Jukkala K, Specht HC, Kriz W. Adaptation of the rat kidney to altered water intake and urine concentration. Pflügers Arch 412: 42–53, 1988 [DOI] [PubMed] [Google Scholar]
- 2. Chou CL, Knepper MA. In vitro perfusion of chinchilla thin limb segments: urea and NaCl permeabilities. Am J Physiol Renal Fluid Electrolyte Physiol 264: F337–F343, 1993 [DOI] [PubMed] [Google Scholar]
- 3. Chou CL, Knepper MA. In vitro perfusion of chinchilla thin limb segments: segmentation and osmotic water permeability. Am J Physiol Renal Fluid Electrolyte Physiol 263: F417–F426, 1992 [DOI] [PubMed] [Google Scholar]
- 4. Dantzler WH, Evans KK, Pannabecker TL. Osmotic water permeabilities in specific segments of rat inner medullary thin limbs of Henle's loops. FASEB J 23: 970.973, 2009 [Google Scholar]
- 5. Gottschalk CW, Mylle M. Micropuncture study of the mammalian urinary concentrating mechanism: evidence for the countercurrent hypothesis. Am J Physiol 196: 927–936, 1959 [DOI] [PubMed] [Google Scholar]
- 6. Han JS, Thompson KA, Chou CL, Knepper MA. Experimental tests of three-dimensional model of urinary concentrating mechanism. J Am Soc Nephrol 2: 1677–1688, 1992 [DOI] [PubMed] [Google Scholar]
- 7. Johnston PA, Battilana CA, Lacy FB, Jamison RL. Evidence for a concentration gradient favoring outward movement of sodium from the thin loop of Henle. J Clin Invest 59: 234–240, 1977 [DOI] [PMC free article] [PubMed] [Google Scholar]
- 8. Kim J, Pannabecker TL. Two-compartment model of inner medullary vasculature supports dual modes of vasopressin-regulated inner medullary blood flow. Am J Physiol Renal Physiol 299: F273–F279, 2010 [DOI] [PMC free article] [PubMed] [Google Scholar]
- 9. Knepper MA, Danielson RA, Saidel GM, Post RS. Quantitative analysis of renal medullary anatomy in rats and rabbits. Kidney Int 12: 313–323, 1977 [DOI] [PubMed] [Google Scholar]
- 10. Knepper MA, Roch-Ramel F. Pathways of urea transport in the mammalian kidney. Kidney Int 31: 629–633, 1987 [DOI] [PubMed] [Google Scholar]
- 11. Kokko JP, Rector FC. Countercurrent multiplication system without active transport in inner medulla. Kidney Int 2: 214–223, 1972 [DOI] [PubMed] [Google Scholar]
- 12. Kriz W, Bankir L. A standard nomenclature for structures of the kidney. Am J Physiol Renal Fluid Electrolyte Physiol 254: F1–F8, 1988 [Google Scholar]
- 13. Layton AT, Dantzler WH, Pannabecker TL. Urine concentrating mechanism: impact of vascular and tubular architecture and a proposed descending limb urea-Na+ cotransporter. Am J Physiol Renal Physiol 302: F591–F605, 2012 [DOI] [PMC free article] [PubMed] [Google Scholar]
- 14. Layton AT, Gilbert RL, Pannabecker TL. Isolated interstitial nodal spaces may facilitate preferential solute and fluid mixing in the rat renal inner medulla. Am J Physiol Renal Physiol 302: F830–F839, 2012 [DOI] [PMC free article] [PubMed] [Google Scholar]
- 15. Layton AT, Layton HE. A region-based mathematical model of the urine concentrating mechanism in the rat outer medulla. I. Formulation and base-case results. Am J Physiol Renal Physiol 289: F1346–F1366, 2005 [DOI] [PubMed] [Google Scholar]
- 16. Layton AT, Pannabecker TL, Dantzler WH, Layton HE. Functional implications of the three-dimensional architecture of the rat renal inner medulla. Am J Physiol Renal Physiol 298: F973–F987, 2010 [DOI] [PMC free article] [PubMed] [Google Scholar]
- 17. Layton HE. Distribution of Henle's loops may enhance urine concentrating capability. Biophys J 49: 1033–1040, 1986 [DOI] [PMC free article] [PubMed] [Google Scholar]
- 18. Marsh DJ, Azen SP. Mechanism of NaCl reabsorption by hamster thin ascending limbs of Henle's loop. Am J Physiol 228: 71–79, 1975 [DOI] [PubMed] [Google Scholar]
- 19. Marsh DJ, Segel LA. Analysis of countercurrent diffusion exchange in blood vessels of the renal medulla. Am J Physiol 221: 817–828, 1971 [DOI] [PubMed] [Google Scholar]
- 20. Marsh DJ, Solomon S. Analysis of electrolyte movement in thin Henle's loops of hamster papilla. Am J Physiol 208: 1119–1128, 1965 [DOI] [PubMed] [Google Scholar]
- 21. Maxwell MH. Two rapid and simple methods used for the removal of resins from 1.0 μm thick epoxy sections. J Microsc 112: 253–255, 1977 [DOI] [PubMed] [Google Scholar]
- 22. McLean IW, Nakane PK. Periodate-lysine-paraformaldehyde fixative: a new fixative for immunoelectron microscopy. J Histochem Cytochem 22: 1077–1083, 1974 [DOI] [PubMed] [Google Scholar]
- 23. Pallone TL, Turner MR, Edwards A, Jamison RL. Countercurrent exchange in the renal medulla. Am J Physiol Regul Integr Comp Physiol 284: R1153–R1175, 2003 [DOI] [PubMed] [Google Scholar]
- 24. Pallone TL, Work J, Myers RL, Jamison RL. Transport of sodium and urea in outer medullary descending vasa recta. J Clin Invest 93: 212–222, 1994 [DOI] [PMC free article] [PubMed] [Google Scholar]
- 25. Pannabecker TL. Loop of Henle interaction with interstitial nodal spaces in the renal inner medulla. Am J Physiol Renal Physiol 295: F1744–F1751, 2008 [DOI] [PMC free article] [PubMed] [Google Scholar]
- 26. Pannabecker TL, Abbott DE, Dantzler WH. Three-dimensional functional reconstruction of inner medullary thin limbs of Henle's loop. Am J Physiol Renal Physiol 286: F38–F45, 2004 [DOI] [PubMed] [Google Scholar]
- 27. Pannabecker TL, Dantzler WH. Three-dimensional architecture of inner medullary vasa recta. Am J Physiol Renal Physiol 290: F1355–F1366, 2006 [DOI] [PubMed] [Google Scholar]
- 28. Pannabecker TL, Dantzler WH. Three-dimensional lateral and vertical relationships of inner medullary loops of Henle and collecting ducts. Am J Physiol Renal Physiol 287: F767–F774, 2004 [DOI] [PubMed] [Google Scholar]
- 29. Pannabecker TL, Dantzler WH, Layton HE, Layton AT. Role of three-dimensional architecture in the urine concentrating mechanism of the rat renal inner medulla. Am J Physiol Renal Physiol 295: F1271–F1285, 2008 [DOI] [PMC free article] [PubMed] [Google Scholar]
- 30. Pannabecker TL, Henderson C, Dantzler WH. Quantitative analysis of functional reconstructions reveals lateral and axial zonation in the renal inner medulla. Am J Physiol Renal Physiol 294: F1306–F1314, 2008 [DOI] [PubMed] [Google Scholar]
- 31. Stephenson JL. Concentration of urine in a central core model of the renal counterflow system. Kidney Int 2: 85–94, 1972 [DOI] [PubMed] [Google Scholar]
- 32. Uchida S, Sasaki S, Furakawa T, Hiraoka M, Imai T, Hirata Y, Marumo F. Molecular cloning of a chloride channel that is regulated by dehydration and expressed predominantly in the kidney medulla. J Biol Chem 268: 3821–3824, 1993 [PubMed] [Google Scholar]
- 33. Yuan J, Pannabecker TL. Architecture of inner medullary descending and ascending vasa recta: pathways for countercurrent exchange. Am J Physiol Renal Physiol 299: F265–F272, 2010 [DOI] [PMC free article] [PubMed] [Google Scholar]
- 34. Zimmerhackl B, Robertson CR, Jamison RL. Fluid uptake in the renal papilla by vasa recta estimated by two methods simultaneously. Am J Physiol Renal Fluid Electrolyte Physiol 248: F347–F353, 1985 [DOI] [PubMed] [Google Scholar]


