

Abstract
To elucidate the role of the insulin receptor (IR) in collecting duct (CD), we bred mice with IR selectively deleted from CD principal cells using an aquaporin-2 promoter to drive Cre-recombinase expression. Young, adult male knockout (KO) mice had altered plasma and electrolyte homeostasis under high- (HS) and low-sodium (LS) diets, relative to wild-type (WT) littermates. One week of LS feeding led to a significant reduction in urine potassium (K+) and sodium (Na+) excretion in KO, and a reduction in the ratio of Na+ to chloride (Cl−) in plasma, relative to WT. HS diet (1 wk) increased plasma K+ and reduced urine Na+ to Cl− ratio in the KO. Furthermore, KO mice had a significantly (P = 0.025) blunted natriuretic response to benzamil, an epithelial sodium channel (ENaC) antagonist. Western blotting of cortex homogenates revealed modestly, but significantly (∼15%), lower band density for the β-subunit of ENaC in the KO vs. WT mice, with no differences for the α- or γ-subunits. Moreover, blood pressure (BP), measured by radiotelemetry, was significantly lower in KO vs. WT mice under basal conditions (mmHg): 112 ± 5 (WT), 104 ± 2 (KO), P = 0.023. Chronic insulin infusion reduced heart rate in the WT, but not in the KO, and modestly reduced BP in the WT only. Overall, these results support a fundamental role for insulin through its classic receptor in the modulation of electrolyte homeostasis and BP.
Keywords: sodium, hypertension, principal cell, metabolic syndrome, benzamil
hyperinsulinemia is a common metabolic state associated with insulin (receptor) resistance of primarily metabolic tissues (43). Increases in pancreatic insulin release compensate for inefficient glucose clearance. Insulin resistance, at the receptor level, is not fully understood, but may involve aberrant postreceptor signaling or an overall change in the number of functional receptors due to various factors associated with the metabolic syndrome (48). Insulin receptor (IR) resistance is associated with increased blood pressure (BP); however, a mechanistic link between the two has not been well established (2, 3, 5, 8, 9, 26–28, 35). Insulin's effects on BP appear to be very situation sensitive. Insulin infusion has been shown by ourselves (50) and others (10, 29) to increase BP significantly in the Sprague-Dawley rat. However, in mongrel dogs there appears to be a need for co-elevation of glucose along with insulin (33). One hypothesis is that high circulating insulin, to compensate for metabolic tissue resistance, could lead to increased sodium retention at the level of the kidney (12). It is not clear whether the kidney undergoes the same pattern of “insulin resistance” as other tissues more actively involved in metabolism, such as skeletal muscle and liver.
The effect of insulin directly on sodium transport and reabsorption is controversial. Some studies report that insulin is directly antinatriuretic and increases sodium uptake at a variety of sites along the renal tubule, including the collecting duct (CD) and/or distal tubule (16, 20). Other studies do not show this effect. One study reported that epidermal growth factor, but not insulin or insulin-like growth factor, was antinatriuretic using patch clamp of rabbit cortical collecting tubule (58). Another study showed that in the hyperinsulinemic-euglycemic clamp model, if you controlled potassium, insulin was not antinatriuretic (44). Nonetheless, hyperinsulinemia potentially could increase inappropriate sodium retention at the level of the CD if circulating levels are high enough.
Some studies show that insulin activates specific sodium transporters and channels, including the epithelial sodium channel, ENaC (6, 7, 41, 47, 56, 60, 61). We have shown increased CD apical localization of ENaC subunits in both mice and rats treated with insulin both acutely and chronically (50, 56). We've also shown that insulin results in antinatriuresis in mice, which was inhibitable by the ENaC antagonist, benzamil (56). However, another recent study (23) did not show activation of ENaC by physiological levels of insulin in the split-open rat cortical collecting duct tubule, but that Na-K-ATPase and K+ channels were activated. This might provide a driving force for increased sodium reabsorption in this tubule segment.
IR are also coupled to intracellular signaling linked to nitric oxide (NO) generation via phosphorylation of Akt (a serine-threonine kinase, also known as protein kinase B) and endothelial nitric oxide synthase (eNOS). These pathways might protect against rises in BP at the level of the kidney when circulating levels of insulin are high. In support of this, recently we showed that knockout of the IR from portions of the renal tubule including primarily the thick ascending limb (TAL) through the CD by use of a Ksp-cadherin promoter-targeted Cre-recombinase resulted in mice with impaired ability to excrete a NaCl load, 50% reduced urinary NO excretion, and elevated BP (57). This was somewhat surprising given our understanding of the role of insulin in the distal tubule to be antinatriuretic. Therefore, in the present study, we tested whether a knockout targeted specifically to the CD principal cell would result in a similar phenotype and how it affected specifically ENaC. To do this, we crossed our floxed IR mice with mice harboring Cre-recombinase driven by an aquaporin-2 (AQP2) promoter. We examined the role of the renal IR in CD on in vivo sodium handling, ENaC regulation, and BP in these mice. We also assessed the regulation of the thiazide-sensitive Na-Cl cotransporter (NCC) in these mice as an example of a distal but non-CD-expressed protein. Recently NCC phosphorylation was shown to be increased by insulin (49).
METHODS
Experimental animals.
The animal protocols describing the procedures and breeding of mice in this communication were approved by the Institutional Animal Care and Use Committee (IACUC) of Georgetown University. Wild-type (WT) mice were generated by initially crossing male mice homozygous for floxed insulin receptor (IR) (11, 57) with female mice heterozygous for a transgene in which Cre-recombinase was 3′ to an aquaporin-2 promoter sequence, as previously described (40). This transgene has been shown to target Cre-recombinase expression to the CD principal cells and cells in the reproductive tract (1, 40, 54). In a second cross, females doubly heterozygous for AQP2-Cre and floxed IR were mated again to homozygous IR-floxed males. In this cross, approximately one-fourth of the offspring were homozygous for floxed IR and heterozygous for AQP2-Cre and considered “KO”. For subsequent generations, and for greater efficiency, KO females were mated to homozygous floxed IR males so that ∼50% of the offspring were “WT” (homozygous for floxed IR, and negative for Cre) and 50% were “KO” (homozygous for floxed IR and heterozygous for Cre). These mice are on a mixed genetic background primarily 129/sv, but including C57Bl/6 and CBA (36, 46). Although both male and female mice were studied, data reported are from male mice only for two main reasons: 1) knockout efficiency (difference in mRNA expression for IR between KO and WT) was lower in the females; and 2) female responses were different from male for many of the analyses, which added variability when comparing KO to WT. To test the cellular localization of active Cre-recombinase, KO females were also crossed with male mice homozygous for a transgene of the LacZ gene with a DNA stop sequence flanked by loxP sites (The Jackson Laboratory, Bar Harbor, ME; catalog no. 002073 B6;129-Gtrosa26tm1Sor, Soriano Line). Removal of the stop sequence by Cre recombinase allows for expression of β-galactosidase, which results in a blue color when substrate for the enzyme is available.
Genotyping and general characterization.
Mice were ear-tagged and tail-snipped at weaning. DNA was prepared from the tail for genotyping by lysing overnight (55°C) with Viagen DirectPCR Lysis Reagent (Viagen Biotech, Los Angeles, CA) with added proteinase K (0.0002 g/ml). In the morning, the temperature was raised to 85°C to denature proteinase K and end the reaction. Lysed samples were stored at −20°C prior to PCR. Mice were genotyped for the AQP2-Cre transgene using standard PCR and the following primer set as previously described (1): forward 5′-CCT CTG CAG GAA CTG GTG CTG-3′; reverse 5′-GCG AAC ATC TTC AGG TTC TGC GG-3′. Blood glucose was determined from tail blood from semifasted (4 h) mice using a handheld glucometer (Truetest, True2go meter, NIPRO Diagnostics, Ft. Launderdale, FL). Mice were periodically housed in metabolic cages in order to perform natriuretic tests (described below) and collect urine for nitrates plus nitrites (UNOx) excretion.
In order to characterize the KO, some mice (∼4 mo old) were weighed and then anesthetized with pentobarbital sodium or ketamine/xylazine combination. After obtaining a sufficient plane of anesthesia, a laparotomy was performed and blood was drawn from the heart. Next, the right kidney was clamped, removed, weighed, and dissected into cortex (CTX), inner stripe of the outer medulla (ISOM), and inner medulla (IM) by use of sharp scissors and a razor blade. These regions were frozen for RT-PCR analyses (see below) or prepared fresh for Western blotting (see below). The left kidney was perfusion fixed via the heart (4% paraformaldehyde) for immunohistochemistry to assess expression of Cre-recombinase and IR. Details of the perfusion have been described previously (17).
Natriuretic tests and urine assays.
In subsets of 3- to 4-mo-old male mice (n = 5–7 mice/group), the antinatriuretic effect of insulin was assessed. Mice were injected intraperitoneally with either 1) 600 μl sterile water (vehicle); 2) insulin (Humulin-R, Eli Lily, Indianapolis, IN) at 0.5 U/kg·body wt in 600 μl 10% d-glucose (metabolizable); 3) 10% d-glucose in 600 μl water; or 4) 10% l-glucose (nonmetabolizable) in 600 μl water. Mice were placed in metabolic cages (Hatteras Instruments, Cary NC), and urine was collected for 4 h. Drinking water, but no food, was supplied during this 4-h period. Second, the natriuretic responses to benzamil (BNZ, Sigma) and hydrochlorothiazide (HCTZ, Sigma) given intraperitoneally on separate occasions at 1.4 (BNZ) and 12 (HCTZ) mg/kg·body wt were used as indexes of relative ENaC and NCC activity, respectively (22, 38). After the injections, urine was collected for 4 h, as above. Urinary sodium, potassium, and chloride were measured by an ion-selective electrode system (EL-ISE Electrolyte System, Beckman Instruments, Brea, CA). In addition, a 24-h urine collection was obtained to measure basal urine volume and UNOx.
Effects of high- or low-sodium diets.
WT and KO male mice were fed either high- (4% NaCl, TD.92034, Harlan-Teklad, Indianapolis, IN) or low-Na+ (0.01–0.02% Na+, 0.06–0.07% Cl−, TD.90228, Harlan) diets for 1 wk (n = 4–7/genotype/diet). Twenty-four hour urine was collected on the 5th to 6th day, and mice were euthanized on the 7th day for collection of plasma. Urine and plasma Na+, K+, and Cl− levels were analyzed.
Blood pressure and heart rate responses to chronic insulin infusion.
Male WT and KO mice (n = 6–8/group) at approximately 4–5 mo of age were anesthetized with ketamine plus xylazine and instrumented with radiotelemetry transmitters (Data Sciences, St. Paul, MN). After a 1-wk recovery, basal BP and heart rate were recorded for 2 days taking recordings every 10 min for 10 s. On the next day, mice were reanesthetized with isoflurane (3% flowing in O2) and subcutaneously implanted with osmotic minipumps (Alzet model 1007D; Durect, Cupertino, CA) preloaded with insulin (Humulin-R, Eli Lilly, Indianapolis, IN). Insulin was delivered at a rate of 50 U·kg·body wt−1·day−1 for 7 additional days. BP and heart rate were recorded continuously. Mice had ad libitum access to 20% glucose drinking water and 0.5% NaCl chow during the infusion.
Quantitative real-time RT-PCR.
To determine IR expression, regions of the kidney were either homogenized with a saw-tooth generator or sonicated in Trizol (Invitrogen, Carlsbad, CA), and traces of genomic DNA were removed. Clean RNA samples were processed by iScript cDNA Synthesis Kit (Bio-Rad, Hercules, CA) to obtain cDNA samples. cDNAs for target genes were quantified by real-time amplifications in a StepOnePlus Real-Time PCR system (Applied Biosystems, Foster City, CA). SYBR Green (Quanta Biosciences, Gaithersburg, MD) was used for detection. IR primers used were forward 5′-GTG CTG CTC ATG TCC TAA GA-3′ and reverse 5′-AAT GGT CTG TGC TCT TCG TG-3′. Expression of IR was computed relative to the expression levels of the housekeeping transcript 18S rRNA. Relative quantitation for IR was calculated after determination of the difference between CT of the IR gene and that of 18S rRNA in KO (ΔCT1 = CTIR − CT18S) and WT mice (ΔCT0 = CTIR − CT18S) using the 2−ΔΔCT formula, where ΔΔCT = ΔCT1 − ΔCT0.
Immunohistochemistry.
The left kidney was prepared for immunohistochemistry for either immunofluorescence or immunoperoxidase-based localization studies. In general, bisected kidneys were processed to paraffin, and 5-μm sections were cut. For Cre-recombinase staining, heat-induced target retrieval was performed using citrate buffer pH 6 (DakoCytomation, Carpinteria, CA) to unmask antigenic sites. Endogenous peroxidase activity was removed by incubation with 3% H2O2 for 10 min. Tissues were incubated with the primary antibody (1:2,000), overnight at 4°C. The primary antibody was polyclonal rabbit (PRB-106C, Covance, Emeryville, CA). The secondary antibody was biotinylated goat anti-rabbit antibody (BA-1,000, Vector Labs, Burlingame, CA). 3–3′-Diaminobenzidine tetrachloride dihydrate (DAB) was applied for 2–4 min. A positive reaction for Cre-recombinase was identified as a dark brown nuclear stain. Pictures were taken with a Photometrics Cool Snap camera (Scanalytics, Fairfax, VA) mounted to a Nikon Eclipse E600 microscope.
For immunofluorescence of IR, 5-μm sections were prepared from mice as previously described (59). Heat-induced target retrieval was performed at pH 8.0. A triple-antibody incubation approach was used to achieve additional amplification of the signal as follows: 1) rabbit anti-IR-β (Santa Cruz Biotechnology, Santa Cruz, CA, sc-711) at 7 μg/ml overnight; 2) goat anti-rabbit Alexa 488 at 1:100 for 2 h; and 3) donkey anti-goat Alexa 488 at 1:32 for 2 h. The 2nd and 3rd antibodies were custom prepared by coupling Alexa 488 to highly cross-absorbed goat anti-rabbit (Rockland Immunochemicals, Gilbertsville, PA) and donkey anti-goat (Jackson ImmunoResearch, West Grove, PA) using the custom coupling kit from Molecular Probes (Invitrogen). Imaging was accomplished on a Zeiss LSM 410 confocal microscope.
β-Galactosidase reporter assay.
To determine regions of the kidney with active Cre-recombinase, LacZ/AQP2-Cre doubly heterozygous mice were perfused transcardially with 1X phosphate-buffered saline (PBS) until clear of blood, followed by 20 ml of 2% glutaraldehyde. The kidneys were then removed and bisected transversely exposing the medulla and the cortex. The bisected sections were immediately stained for the product of β-galactosidase at 37°C for 1 h using a B-Gal staining kit (Mirus 2600). The sections were then photographed using a Zeiss dissecting scope and a Canon A590 camera with a fitted objective at 1.2× and 5× magnification.
Western blotting.
CTX, ISOM, and IM tissue samples were processed separately, and Western blotting was performed as previously described (50). Briefly, samples were prepared by homogenizing the tissues in a buffer containing protease inhibitors. After determining the protein concentrations, the homogenates were solubilized in Laemmli sample buffer. Quality of tissue sample preparation was assessed by staining loading gels with Coomassie-blue (Gelcode Blue, Pierce Endogen, Rockford, IL), and then examining the sharpness of the bands. To assess the alterations in the protein abundances IR-β, ENaC subunits, and NCC, semiquantitative immunoblotting was performed. For immunoblotting, 10–30 μg of protein from each sample was loaded into individual lanes of minigels of 7, 10, or 12% polyacrylamide (precast, Bio-Rad). Blots were probed with our own rabbit peptide-derived polyclonal antibodies against NCC and the three subunits of ENaC (α-, β-, and γ-), as previously described (51). We used a commercial rabbit polyclonal antibody against the β-subunit of IR (sc-711, Santa Cruz). Loading accuracy was evaluated by probing the lower portion of the nitrocellulose membranes with β-Actin monoclonal antibody (Sigma Chemical, St. Louis, MO) or GAPDH polyclonal (Sigma).
Statistical analysis.
Quantitative data are expressed as means ± SE. Differences between KO and WT mice were determined by unpaired t-test. P values < 0.05 were considered significant. Data were evaluated by Sigma Stat (Chicago, IL).
RESULTS
Characterization of the IR knockout.
Mice were sorted into genotypes (KO or WT) based on the presence (KO) or absence (WT) of a band at ∼680 kb using standard PCR of tail DNA (Fig. 1A). WT mice were homozygous for floxed IR, but did not carry the transgene, AQP2-Cre recombinase. Approximately 50% of mice were found to be of each genotype. Expression of Cre-recombinase was assessed in the mice by immunoperoxidase labeling and found to be in the nucleus of the collecting ducts in the KO (Fig. 1B), but not in the WT mice (Fig. 1C). We also crossed KO females with male mice homozygous for a LacZ reporter gene flanked by loxP sites. This was done in order to obtain visual confirmation of the activity of the Cre-recombinase to cleave loxP sites specifically in the collecting duct. Treatment of the kidney with β-galactosidase substrate revealed increased blue color in the inner medulla, extending into the outer medulla and cortex, of the KO mice indicating active Cre-recombinase activity in collecting ducts (CD), as would be expected for an AQP2-promoter-driven Cre-recombinase (Fig. 1D). No blue color was seen in kidneys harvested from littermates containing the reporter construct but negative for AQP2-Cre-recombinase (Fig. 1E).
Fig. 1.

Cre-recombinase transgene identification, expression, and activity. A: genotyping of tail DNA revealed a band at 680 kb in mice heterozygous for Cre-recombinase driven by the AQP2-promoter. Wild-type (WT) mice had no band. Immunoperoxidase-based labeling of Cre-recombinase in the nucleus of the collecting duct principal cells in knockout (KO) mice (B) was absent in WT mice (C) (image magnification, 100×). D: β-galactosidase activity resulted in a purple precipitant in LacZ reporter/AQP2-Cre double heterozygotes illustrating activity of Cre-recombinase to cleave lox P sites in collecting ducts. E: the purple precipitant was absent in littermates that did not inherit AQP2-Cre, but were heterozygous for LacZ reporter.
Quantitative RT-PCR was used to assess IR mRNA expression in CTX, inner stripe of the outer medulla (ISOM), and inner medulla (IM) from KO and WT mice (Fig. 2A). IR mRNA expression was significantly lower in the KO animals in CTX, ISOM, and IM. Western blotting of regional homogenates from CTX and ISOM did not show any significant differences in band density for the β-subunit of IR by Western blotting (not shown). However, inner medullary IR-β was significantly reduced in band density (by about 40% on average) in the KO mice (Fig. 2B, P < 0.05, unpaired t-test). Furthermore, immunofluorescence of kidney IM showed reduced immunofluorescence for IR-β in collecting duct of KO vs. WT mice (Fig. 2C), confirming blotting results.
Fig. 2.

Insulin receptor (IR) mRNA and protein expression. A: quantitative RT-PCR for IR (normalized to 18S) in cortex (CTX), inner stripe of the outer medulla (ISOM), and inner medulla (IM) in WT and KO mice. B: Western blot and densitometry summary (normalized to β-actin) of inner medullary homogenate from WT and KO mice (n = 6/genotype). C: immunofluorescence of IR-β in cross-sections of inner medulla (5 μm) in WT (left, labeled “A”) and KO mice (right, labeled “B”); magnification 1,000×. *Significant difference between genotypes by unpaired t-test, P < 0.05.
General physiology and electrolyte homeostasis.
There were no significant differences in body weight, kidney weight, blood glucose, or UNOx due to genotype under normal NaCl diet (Table 1). However, when treated for 1 wk with low-sodium (LS) or high-sodium (HS) diets, we found some genotype differences in electrolyte homeostasis (Fig. 3). While no significant differences between genotypes for urine volume were observed (ml·24 h−1·25 g body wt−1: 0.85 ± 0.11, 0.68 ± 0.12, 1.8 ± 0.3, 2.7 ± 0.5 in WT-LS, KO-LS, WT-HS, and KO-HS, respectively), we found significantly reduced 24-h urine Na+ and K+ excretion in the KO mice under LS diet (Fig. 3A). Plasma K+ was significantly higher in the KO mice under HS diet (Fig. 3B). The Na+ to K+ ratio was lower in the KO mice in urine under LS diet, and in plasma under HS diet (Fig. 3C). Na+ to Cl− ratio was lower in the KO mice in urine under LS and HS diet, and in plasma under LS diet (Fig. 3D). In addition, 1 wk of LS diet resulted in a significant difference in weight change between the two genotypes (−0.36 ± 0.22 vs. +0.79 ± 0.30 g in WT and KO, respectively, P = 0.015), suggesting better tolerance of the LS diet in the KO, at least short-term. However, the opposite was seen with the HS diet where the KO lost weight (+1.14 ± 0.30 vs. −0.16 ± 0.36 g, in WT and KO, respectively, P = 0.025).
Table 1.
Basal physiological parameters
| Genotype |
|||
|---|---|---|---|
| Parameter | WT | KO | P Value |
| Body weight, g | 31.6 ± 0.8 | 30.6 ± 0.9 | 0.35 |
| Kidney weight, g/30 g body wt | 0.20 ± 0.008 | 0.20 ± 0.005 | 0.98 |
| Blood glucose, mg/dl | 112 ± 7 | 119 ± 5 | 0.23 |
| Urine volume, ml·day−1·30 g body wt−1 | 2.21 ± 0.33 | 2.45 ± 0.22 | 0.56 |
| Urine NOx, μmol·day−1·30 g body wt−1 | 56.9 ± 9.3 | 79.4 ± 16.0 | 0.16 |
Values are means ± SE; n = 9–16/group. WT, wild-type; KO, knockout; NOx, nitrates plus nitrites.
Fig. 3.
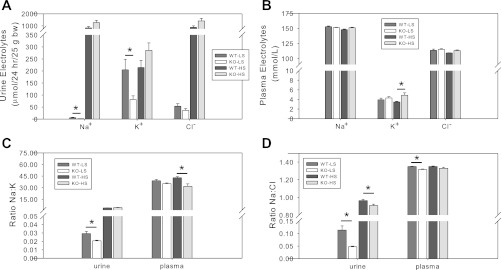
Effects of high-sodium (HS) and low-sodium (LS) diets. KO and WT mice (n = 4–7/genotype/treatment) were fed LS or HS diet for 1 wk, after which urine was collected in metabolic cages for 24 h and mice were euthanized for blood collection. A: 24-h absolute urine excretion of Na+, K+, and Cl− under LS and HS diets. B: plasma electrolyte concentrations under LS and HS diets. C: ratio of Na+ to K+ in urine and plasma. D: ratio of Na+ to Cl− in urine and plasma. *Significant difference between genotypes by unpaired t-test, P < 0.05.
Natriuretic tests and ENaC activity.
Insulin has been shown to be antinatriuretic in a variety of species (15, 19, 25). To test whether knockout of the collecting duct principal cell insulin receptor would affect insulin's natriferic actions, we conducted several tests. In Fig. 4A, we show the absolute natriuretic response in a 4-h collection of urine in response to treatment of the mice with 600 μl of solution as indicated. Water alone led to a brisk natriuresis in both genotypes of mice. Administration of any of the three hypertonic solutions, i.e., l-glucose (nonmetabolizable), d-glucose (metabolizable), or d-glucose plus insulin, intraperitoneally, led to a fall in Na+ excretion in both the KO and the WT, likely as the result of NaCl moving into the peritoneum at least transiently. However, a significant difference between genotypes was observed only for the insulin plus d-glucose treatment in which UNa+ was lower in the WT.
Fig. 4.

Antinatriuretic response to insulin. A: WT and KO mice (n = 5/group) were treated with 600 μl water, insulin (I) + d-glucose (Glc), d-Glc alone, or l-Glc alone, and urine was collected in metabolic cages for 4 h and measured for Na+, K+, and Cl−. All mice received each treatment, and treatments were separated by at least 3 days. B: Na+-to-K+ ratio in urine. C: Na+-to-Cl− ratio in urine. *Significant difference between genotypes by unpaired t-test, P < 0.05.
Because we were concerned that the other hypertonic solutions also resulted in absolute antinatriuresis, we evaluated the ratio of Na+ to the other major electrolytes in the urine from these samples (Fig. 4, B and C). While the absolute excretion of Na+, Cl−, and K+ were all at least marginally reduced by hypertonic solutions (not shown), compared with plain water, the ratio of their excretion varied. For example, we found that while the Na+ to K+ ratio was reduced in urine by all of the hypertonic solutions, there were no differences between genotypes (Fig. 4B). In contrast, the urine Na+ to Cl− ratio was not markedly affected by tonicity, but it was significantly lower in the insulin + d-glucose treated WT mice, compared with similarly treated KO. Overall, these results support greater insulin-mediated antinatriuresis in the WT.
We next tested the response to an ENaC antagonist, benzamil (BNZ, Fig. 5A). BNZ alone resulted in a significantly greater natriuresis in the WT mice suggesting greater activity of ENaC even without administration of insulin. For KO mice, however, BNZ eliminated antinatriuresis. K+ excretion was not significantly altered between the genotypes in this test. In Fig. 5B, we show similar results using the antagonist to the thiazide-sensitive Na-Cl cotransporter (NCC) hydrochlorothiazide (HCTZ), which is not expressed in CD. There was no effect of the KO on the natriuretic or kaliuretic responses to HCTZ. Insulin along with HCTZ resulted in a significant antinatriuresis in the WT but not the KO mice compared with HCTZ alone.
Fig. 5.

Benzamil and hydrochlorothiazide responsivity. A and B: urine Na+ and K+ in response to benzamil (BNZ, 1.4 mg/kg body wt in 600 μl sterile water) and BNZ plus insulin (administered after 30 min in 600 μl 10% dextrose) (A); or hydrochlorothiazide (HCTZ, 7.5 mg/kg body wt in 600 μl sterile water) and HCTZ plus insulin (administered after 30 min in 600 μl 10% dextrose) (B). *Significant difference between genotypes by unpaired t-test, P < 0.05.
ENaC subunit and NCC protein.
We next tested whether the decreased activity of ENaC in the KO mice corresponded to differences in whole cell ENaC subunit protein levels. Representative Western blots of kidney cortex homogenates from mice under basal conditions are shown in Fig. 6A. A data summary is provided in Fig. 6B. Western blotting revealed no significant differences in density of the 90-kDa band between groups for α-ENaC; however, band density for β-ENaC was modestly, but significantly reduced in the KO mice (∼15% reduced). γ-ENaC on Western blots runs as a major band at ∼85 kDa and a lower smudgy band region, possibly due to activating cleavage, at ∼70 kDa. No significant differences between groups were found for either band, although there was a trend for the 70-kDa band to be reduced in the KO mice (P = 0.082). This band is increased with aldosterone infusion or low-NaCl diets and likely indicates a more activated state of this subunit (34). NCC was run on a 7.5% gel, which produces a broad glycosylated band at 165 kDa and a second band (probably an immature form of the protein) at less than 120 kDa, as previously shown with an antibody against the same peptide sequence as our own (21). No differences were found between genotypes for this protein.
Fig. 6.

Protein levels of the epithelial sodium channel (ENaC) subunits and Na-Cl cotransporter (NCC). A: representative immunoblots of whole cortex homogenates probed with antibodies against α-, β-, and γ-ENaC, NCC, and β-actin. Equal amount of protein was loaded in each lane. The lower portion of each blot was probed with β-actin antibody to assess loading for that particular blot (not shown). B: band density summary (n = 6 mice/group for ENaC, n = 4/group for NCC) normalized to β-actin. *Significant difference between genotypes by unpaired t-test, P < 0.05.
Blood pressure.
Blood pressure and heart rate were recorded by radiotelemetry in the basal state (with standard 0.5% NaCl diet); followed by insulin infusion for 7 days (Fig. 7). Unpaired t-test revealed that KO mice had significantly lower MAP in the basal period, i.e., days −1 and −2 (preinfusion). Bar graph summary of select days is shown in Fig. 7B. Chronic insulin infusion did not markedly affect MAP in either genotype as we have previously observed (unpublished); however, there was a strong trend (P = 0.081) for insulin infusion to result in a significant difference between KO and WT in delta MAP from baseline at day 6 (Fig. 7B). This trend was for MAP to fall in WT, but not in KO mice.
Fig. 7.

Blood pressure with chronic insulin infusion. A: mean arterial blood pressure (MAP) by radiotelemetry in WT (dark circles) and KO (white circles) mice (n = 8 mice/group) in a basal period and in response to chronic insulin infusion (50 U·kg body wt−1·day−1) by osmotic minipump. B: delta MAP from baseline (day −1). *Significant (P < 0.05) difference between WT and KO by unpaired t-test.
Heart rate.
Absolute heart rate is shown in Fig. 8A in the basal period and after 1 and 6 days of insulin infusion. Insulin resulted in a significant difference in HR in the WT between day −1 and day 6 (indicated by a τ). This fall was blunted in the KO, and the difference was not significant (P = 0.28). Likewise the change in heart rate from basal readings (Fig. 8B) approached significance when comparing WT to KO mice (P = 0.057).
Fig. 8.

Heart rate (HR) with chronic insulin infusion. A: absolute HR in the mice (n = 8 mice/group) on day −1, +1, and +6 (post-insulin infusion). B: delta HR from baseline (day −1, and day +6). τSignificant (P < 0.05) difference between day −1 and day 6 for WT mice, by unpaired t-test.
DISCUSSION
Insulin's actions in metabolic tissues such as the liver and skeletal muscle are widely known and largely involve energy homeostasis (14, 32). These effects are primarily mediated through the classic insulin receptor, IR (14). Nevertheless, insulin can also bind to insulin-like growth factor receptors (IGF-R), and insulin-receptor-like-receptor in kidney (4, 13, 39), albeit with significantly reduced affinity (53). Some of the actions of insulin to increase sodium uptake into cells, including in the collecting duct (CD) principal cell, has been attributed to insulin acting at these other receptors (24, 52). Therefore, our main aim in this study was to gauge the impact of knocking out the classic IR selectively from the principal cells of the CD, cells that express aquaporin-2, by use of promoter-driven targeting. These cells are also the major site of expression of the epithelial sodium channel (ENaC), responsible for fine-tuning of sodium balance in the distal tubule. Our current studies showed that knocking out IR from CD principal cells did not have a major impact on the comprehensive phenotype of the mice. Mice were of similar size and kidneys appeared normal; however there were some significant changes in electrolyte homeostasis, as well as a reduction in both the antinatriuretic response to insulin, and the natriuretic response to benzamil, an ENaC antagonist. These mice also had 5- to 10-mmHg lower blood pressure (BP) in the basal state in the absence of insulin infusion. When insulin was infused into WT and KO mice, BP fell slightly in the WT mice, and attenuated genotype differences. This fall in BP in the WT mice was accompanied by a fall in HR, which was not significant in the KO mice. We will discuss these findings in greater detail in the remainder of discussion.
Our measures of urine and plasma electrolytes (Na+, K+, Cl−) in mice fed either low- or high-Na+ diets revealed slight, but significant, differences in homeostasis. Surprisingly, under the LS diet, KO mice seemed to conserve limited Na+ to a greater extent than the WT, as evident by no weight loss and reduced urine absolute Na+ excretion, Na+-to-K+, and Na+-to-Cl− ratios compared with the WT mice. Why the KO mice actually appeared to do better is not known. Interestingly the plasma Na+-to-Cl− ratio was also lower in the KO mice under the LS diet, while plasma K+ tended to run a little higher. Potential causes might include reduced extracellular fluid volume/and or glomerular filtration rate in the KO, as well as possibly impaired acid-base regulation (18). Future studies are required to fully elucidate the phenotype.
In contrast, on the HS diet, the KO mice did not seem to fare as well as the WT. The KO mice lost weight and had elevated plasma K+. Moreover, similar to LS diet, KO mice had reduced Na+-to-Cl− ratio in the urine. The separation of the regulation of Na+ from Cl− is intriguing and may indicate alterations in the anion gap due to impaired CD function. While Na+ is reabsorbed via ENaC on the CD principal cells, Cl− is reabsorbed via the intercalated cells (42). In the case of this particular KO, intercalated cells would have IR. It is unclear whether this plays a role in the altered Na+-to-Cl− ratio in both urine and plasma in these mice.
We next assessed the antinatriuretic response to insulin in these mice. Insulin caused a 40–80% reduction in urine sodium in both genotypes in the 4 h following insulin, compared with vehicle (water) administration (Fig. 4A). This was in agreement with what we have previously observed in WT mice (56). However, it is important to point out a limitation in this particular approach (intraperitoneal administration) in that all hypertonic solutions were antinatriuretic, likely by redistributing fluid into the peritoneum. This approach also showed that the more nonmetabolizable a substance was, the more antinatriuretic it was, with l-glucose being the strongest, followed by d-glucose without insulin, then by d-glucose with insulin. In the 4 h following the administration, some but not all of the fluid may have dissipated from the peritoneum, without metabolizable d-glucose plus insulin, likely entering cells and the blood stream more rapidly. However, only in the insulin plus glucose treatment did we find a significant difference between genotypes.
Overall, our data support differences in ENaC activity as a putative mechanism for this difference, because the natriuretic response to benzamil (BNZ) was also significantly blunted in the KO mice (Fig. 5A). All-in-all, this suggests that a reduction in IR expression in the CD might result in a chronic remodeling of the CD with less capacity to activate ENaC. Our data do not support large changes in the overall lower protein levels of ENaC subunits in these mice; however β-ENaC abundance was slightly, but significantly lower. The physiological impact of this reduction is not clear. Because ENaC is thought to be primarily regulated by insulin via phosphorylation cascades, this is not surprising. However, it is possible that chronic destimulation of these pathways might have affected overall abundance via control of either synthetic or degradative events.
We also tested the effects of the ENaC and NCC antagonists in the KO and WT mice. WT mice had a fall of about 50% in urine sodium when pretreated with BNZ. This might result from incomplete blockade of insulin's actions on ENaC by BNZ, or from insulin working at another cellular site to affect antinatriuresis. Insulin co-stimulation along with BNZ also led to a slight reduction in the natriuresis in the KO mice, but the effect was not as dramatic, at least compared with their own baseline.
The reduction in basal activity of ENaC may have accounted for the modestly reduced BP in the KO vs. WT mice. However, it is also possible that it is another collecting duct principal cell factor, e.g., reduced Na-K-ATPase activity, that affects baseline BP in these mice (23). It is reasonable to predict that insulin acts as a tonic facilitator of sodium reabsorption via ENaC, especially after meals, to allow for efficient retrieval of filtered sodium. This might lead to a modest, and likely transient, expansion of extracellular fluid volume and rise in BP. It is noteworthy that dieting to elicit weight loss is often accompanied by a fall in BP. A meta-analysis by Mulrow and colleagues (37) demonstrated that dieting to induce weight loss resulted in on average a 3–9% loss in body weight and a 3-mmHg fall in BP in human subjects. Moreover, chronic insulin replacement to type I diabetic dogs was recently shown to attenuate natriuresis (33). Future studies will be needed to determine whether changes in BP are amplified by a low-NaCl diet.
If insulin activates ENaC, and ENaC activity is associated with a rise in BP, then why does not BP increase with insulin infusion at least in the WT animals? In fact, over the course of the week, we actually found a slight fall in BP primarily in the WT animals. It seems for insulin to elevate BP additional factors must coexist that prevent compensation for putative sodium retention. One of these factors might be the ability to efficiently produce nitric oxide (NO). IR signaling is linked to the activation of nitric oxide synthase (NOS), especially the eNOS isoform, via phosphorylation (30). We have demonstrated that acute administration of insulin to mice leads to increased urinary excretion of nitrates plus nitrites (UNOx) (57). Moreover, we showed a correlation between BP change and eNOS protein levels in two model systems. Chronic insulin infusion (1 mo) to mice led to a fourfold increase in endothelial nitric oxide synthase expression (eNOS), but no rise in BP (55). However, Sprague-Dawley rats infused for 28 days with insulin had a significant decrease in eNOS protein levels and increased BP (50). Additional studies will need to be performed to determine whether there is a definitive cause-and-effect relationship between NO-generating ability and BP in response to insulin.
In the current report, UNOx was measured in 24-h urine collections under basal conditions, and found to be borderline (P = 0.16) increased in the KO mice. This also correlates with their reduced BP. The cellular source of the NO is not clear, but both CD and thick ascending limb (TAL) are likely candidates. In contrast, our studies conducted in another line of renal tubule IR KO mice in which the IR was deleted using a Ksp-cadherin promoter showed significantly reduced 24-h UNOx excretion and a reduction in acute, insulin-stimulated UNOx (57). In those mice, IR was deleted from a larger portion of the renal tubule including partial deletion in the proximal tubule, the TAL through the distal tubule. Apparently deleting IR from the CD-principal cell alone does not cause the same phenotype with regard to NO homeostasis, nor the elevation in BP seen in the Ksp-cadherin IR KO mice (57).
We examined the regulation of the thiazide-sensitive Na-Cl cotransporter (NCC) to determine whether another post-macula densa apical sodium entry port, which has been reported to be upregulated by insulin (49), was differentially affected in these mice. Furthermore, NCC is potently upregulated in activity and abundance by the renin-angiotensin-aldosterone system (RAAS) (31, 45). It is not implausible that volume contraction in the KO mice, if severe enough, would upregulate NCC as a compensatory mechanism. We did not find good evidence to suggest any difference in NCC regulation between the genotypes.
Therefore, overall these studies suggest a role for insulin through the classic IR in the regulation of ENaC activity, and sodium homeostasis in the basal state. We suggest this may have a homeostatic role in the efficient retrieval of ingested sodium from the filtrate after meals, for example. In our KO mice, BP was slightly, but significantly lower in the KO mice and not affected by insulin infusion. This suggests that this modest reduction in ENaC activity may be associated with slight volume contraction; however, additional studies would be needed to determine cause-and-effect of these relationships. Furthermore, the fact that insulin infusion did not raise BP in the WT mice also supports the view that insulin, even if it activates ENaC, does not result in marked hypertension on its own. The balance between vasodilatory actions and sodium retaining actions of insulin likely are important especially in healthy lean subjects, such as our young mice.
GRANTS
This work was supported by National Institute of Diabetes and Digestive and Kidney Diseases Grant R01-DK-082507 (C. M. Ecelbarger) and an Established Investigator Award from the American Heart Association (C. M. Ecelbarger).
DISCLOSURES
No conflicts of interest, financial or otherwise, are declared by the author(s).
AUTHOR CONTRIBUTIONS
Author contributions: L.L., R.M.G., S. Tsukerman, S. Tiwari, and C.M.E. performed experiments; L.L., R.M.G., S. Tsukerman, and C.M.E. analyzed data; L.L., D.E.K., J.B.W., S. Tiwari, and C.M.E. interpreted results of experiments; L.L. and C.M.E. drafted manuscript; L.L., R.M.G., D.E.K., J.B.W., S. Tiwari, and C.M.E. edited and revised manuscript; L.L., R.M.G., S. Tsukerman, D.E.K., J.B.W., S. Tiwari, and C.M.E. approved final version of manuscript; J.B.W. and C.M.E. prepared figures; S. Tiwari and C.M.E. conception and design of research.
ACKNOWLEDGMENTS
We thank Vidya Nair, M.D., Tiana Woods, Karishma Sitapara, and Arjun Rash for technical assistance with various portions of these studies.
Parts of this work have been presented in preliminary form at the 44st Annual Meeting of the American Society of Nephrology, November 2011, Philadelphia, PA, and appeared as printed abstracts in the proceedings of that meeting (Li et al., 2011).
REFERENCES
- 1. Ahn D, Ge Y, Stricklett PK, Gill P, Taylor D, Hughes AK, Yanagisawa M, Miller L, Nelson RD, Kohan DE. Collecting duct-specific knockout of endothelin-1 causes hypertension and sodium retention. J Clin Invest 114: 504–511, 2004 [DOI] [PMC free article] [PubMed] [Google Scholar]
- 2. Anderson EA, Balon TW, Hoffman RP, Sinkey CA, Mark AL. Insulin increases sympathetic activity but not blood pressure in borderline hypertensive humans. Hypertension 19: 621–627, 1992 [DOI] [PubMed] [Google Scholar]
- 3. Anderson EA, Hoffman RP, Balon TW, Sinkey CA, Mark AL. Hyperinsulinemia produces both sympathetic neural activation and vasodilation in normal humans. J Clin Invest 87: 2246–2252, 1991 [DOI] [PMC free article] [PubMed] [Google Scholar]
- 4. Bates CM, Merenmies JM, Kelly-Spratt KS, Parada LF. Insulin receptor-related receptor expression in non-A intercalated cells in the kidney. Kidney Int 52: 674–681, 1997 [DOI] [PubMed] [Google Scholar]
- 5. Bigazzi R, Bianchi S, Batini V, Guzzo D, Campese VM. Metabolic risk factors and markers of cardiovascular and renal damage in overweight subjects. Am J Hypertens 19: 426–431, 2006 [DOI] [PubMed] [Google Scholar]
- 6. Blazer-Yost BL, Esterman MA, Vlahos CJ. Insulin-stimulated trafficking of ENaC in renal cells requires PI 3-kinase activity. Am J Physiol Cell Physiol 284: C1645–C1653, 2003 [DOI] [PubMed] [Google Scholar]
- 7. Blazer-Yost BL, Liu X, Helman SI. Hormonal regulation of ENaCs: insulin and aldosterone. Am J Physiol Cell Physiol 274: C1373–C1379, 1998 [DOI] [PubMed] [Google Scholar]
- 8. Brands MW, Hall JE, Van Vliet BN, Alonso-Galicia M, Herrera GA, Zappe D. Obesity and hypertension: roles of hyperinsulinemia, sympathetic nervous system and intrarenal mechanisms. J Nutr 125: 1725S–1731S, 1995 [DOI] [PubMed] [Google Scholar]
- 9. Brands MW, Harrison DL, Keen HL, Gardner A, Shek EW, Hall JE. Insulin-induced hypertension in rats depends on an intact renin-angiotensin system. Hypertension 29: 1014–1019, 1997 [DOI] [PubMed] [Google Scholar]
- 10. Brands MW, Hildebrandt DA, Mizelle HL, Hall JE. Sustained hyperinsulinemia increases arterial pressure in conscious rats. Am J Physiol Regul Integr Comp Physiol 260: R764–R768, 1991 [DOI] [PubMed] [Google Scholar]
- 11. Bruning JC, Michael MD, Winnay JN, Hayashi T, Horsch D, Accili D, Goodyear LJ, Kahn CR. A muscle-specific insulin receptor knockout exhibits features of the metabolic syndrome of NIDDM without altering glucose tolerance. Mol Cell 2: 559–569, 1998 [DOI] [PubMed] [Google Scholar]
- 12. Catena C, Cavarape A, Novello M, Giacchetti G, Sechi LA. Insulin receptors and renal sodium handling in hypertensive fructose-fed rats. Kidney Int 64: 2163–2171, 2003 [DOI] [PubMed] [Google Scholar]
- 13. Chin E, Bondy C. Insulin-like growth factor system gene expression in the human kidney. J Clin Endocrinol Metab 75: 962–968, 1992 [DOI] [PubMed] [Google Scholar]
- 14. Cusin I, Rohner-Jeanrenaud F, Terrettaz J, Jeanrenaud B. Hyperinsulinemia and its impact on obesity and insulin resistance. Int J Obes Relat Metab Disord 16, Suppl 4: S1–S11, 1992 [PubMed] [Google Scholar]
- 15. DeFronzo RA. The effect of insulin on renal sodium metabolism. A review with clinical implications. Diabetologia 21: 165–171, 1981 [DOI] [PubMed] [Google Scholar]
- 16. DeFronzo RA, Cooke CR, Andres R, Faloona GR, Davis PJ. The effect of insulin on renal handling of sodium, potassium, calcium, and phosphate in man. J Clin Invest 55: 845–855, 1975 [DOI] [PMC free article] [PubMed] [Google Scholar]
- 17. Ecelbarger CA, Kim GH, Knepper MA, Liu J, Tate M, Welling PA, Wade JB. Regulation of potassium channel Kir 1.1 (ROMK) abundance in the thick ascending limb of Henle's loop. J Am Soc Nephrol 12: 10–18, 2001 [DOI] [PubMed] [Google Scholar]
- 18. Eladari D, Chambrey R, Peti-Peterdi J. A new look at electrolyte transport in the distal tubule. Annu Rev Physiol 74: 325–349, 2012 [DOI] [PMC free article] [PubMed] [Google Scholar]
- 19. Feraille E, Marsy S, Cheval L, Barlet-Bas C, Khadouri C, Favre H, Doucet A. Sites of antinatriuretic action of insulin along rat nephron. Am J Physiol Renal Fluid Electrolyte Physiol 263: F175–F179, 1992 [DOI] [PubMed] [Google Scholar]
- 20. Feraille E, Rousselot M, Rajerison R, Favre H. Effect of insulin on Na+,K+-ATPase in rat collecting duct. J Physiol 488: 171–180, 1995 [DOI] [PMC free article] [PubMed] [Google Scholar]
- 21. Fernandez-Llama P, Jimenez W, Bosch-Marce M, Arroyo V, Nielsen S, Knepper MA. Dysregulation of renal aquaporins and Na-Cl cotransporter in CCl4-induced cirrhosis. Kidney Int 58: 216–228, 2000 [DOI] [PubMed] [Google Scholar]
- 22. Firth JD, Ledingham JG. Effect of natriuretic agents, vasoactive agents and of the inhibition of metabolism on sodium handling in the isolated perfused kidney of the nephrotic rat. Clin Sci (Lond) 79: 559–574, 1990 [DOI] [PubMed] [Google Scholar]
- 23. Frindt G, Palmer LG. Effects of insulin on Na and K transporters in the rat CCD. Am J Physiol Renal Physiol 302: F1227–F1233, 2012 [DOI] [PMC free article] [PubMed] [Google Scholar]
- 24. Gonzalez-Rodriguez E, Gaeggeler HP, Rossier BC. IGF-1 vs. insulin: respective roles in modulating sodium transport via the PI-3 kinase/Sgk1 pathway in a cortical collecting duct cell line. Kidney Int 71: 116–125, 2007 [DOI] [PubMed] [Google Scholar]
- 25. Gupta AK, Clark RV, Kirchner KA. Effects of insulin on renal sodium excretion. Hypertension 19: I78–182, 1992 [DOI] [PubMed] [Google Scholar]
- 26. Hall JE, Brands MW, Henegar JR. Mechanisms of hypertension and kidney disease in obesity. Ann NY Acad Sci 892: 91–107, 1999 [DOI] [PubMed] [Google Scholar]
- 27. Hall JE, Brands MW, Mizelle HL, Gaillard CA, Hildebrandt DA. Chronic intrarenal hyperinsulinemia does not cause hypertension. Am J Physiol Renal Fluid Electrolyte Physiol 260: F663–F669, 1991 [DOI] [PubMed] [Google Scholar]
- 28. Hall JE, Coleman TG, Mizelle HL. Does chronic hyperinsulinemia cause hypertension? Am J Hypertens 2: 171–173, 1989 [DOI] [PubMed] [Google Scholar]
- 29. Juan CC, Fang VS, Kwok CF, Perng JC, Chou YC, Ho LT. Exogenous hyperinsulinemia causes insulin resistance, hyperendothelinemia, and subsequent hypertension in rats. Metabolism 48: 465–471, 1999 [DOI] [PubMed] [Google Scholar]
- 30. Kahn NN, Acharya K, Bhattacharya S, Acharya R, Mazumder S, Bauman WA, Sinha AK. Nitric oxide: the “second messenger” of insulin. IUBMB Life 49: 441–450, 2000 [DOI] [PubMed] [Google Scholar]
- 31. Kim GH, Masilamani S, Turner R, Mitchell C, Wade JB, Knepper MA. The thiazide-sensitive Na-Cl cotransporter is an aldosterone-induced protein. Proc Natl Acad Sci USA 95: 14552–14557, 1998 [DOI] [PMC free article] [PubMed] [Google Scholar]
- 32. Landsberg L. Hyperinsulinemia: possible role in obesity-induced hypertension. Hypertension 19: I61–I66, 1992 [DOI] [PubMed] [Google Scholar]
- 33. Manhiani MM, Cormican MT, Brands MW. Chronic sodium-retaining action of insulin in diabetic dogs. Am J Physiol Renal Physiol 300: F957–F965, 2011 [DOI] [PMC free article] [PubMed] [Google Scholar]
- 34. Masilamani S, Kim GH, Mitchell C, Wade JB, Knepper MA. Aldosterone-mediated regulation of ENaC alpha, beta, and gamma subunit proteins in rat kidney. J Clin Invest 104: R19–R23, 1999 [DOI] [PMC free article] [PubMed] [Google Scholar]
- 35. Meehan WP, Buchanan TA, Hsueh W. Chronic insulin administration elevates blood pressure in rats. Hypertension 23: 1012–1017, 1994 [DOI] [PubMed] [Google Scholar]
- 36. Michael MD, Kulkarni RN, Postic C, Previs SF, Shulman GI, Magnuson MA, Kahn CR. Loss of insulin signaling in hepatocytes leads to severe insulin resistance and progressive hepatic dysfunction. Mol Cell 6: 87–97, 2000 [PubMed] [Google Scholar]
- 37. Mulrow CD, Chiquette E, Angel L, Cornell J, Summerbell C, Anagnostelis B, Grimm R, Jr, Brand MB. Dieting to reduce body weight for controlling hypertension in adults. Nurs Times 97: 42, 2001 [PubMed] [Google Scholar]
- 38. Na KY, Oh YK, Han JS, Joo KW, Lee JS, Earm JH, Knepper MA, Kim GH. Upregulation of Na+ transporter abundances in response to chronic thiazide or loop diuretic treatment in rats. Am J Physiol Renal Physiol 284: F133–F143, 2003 [DOI] [PubMed] [Google Scholar]
- 39. Nakamura R, Emmanouel DS, Katz AI. Insulin binding sites in various segments of the rabbit nephron. J Clin Invest 72: 388–392, 1983 [DOI] [PMC free article] [PubMed] [Google Scholar]
- 40. Nelson RD, Stricklett P, Gustafson C, Stevens A, Ausiello D, Brown D, Kohan DE. Expression of an AQP2 Cre recombinase transgene in kidney and male reproductive system of transgenic mice. Am J Physiol Cell Physiol 275: C216–C226, 1998 [DOI] [PubMed] [Google Scholar]
- 41. Pearce D. The role of SGK1 in hormone-regulated sodium transport. Trends Endocrinol Metab 12: 341–347, 2001 [DOI] [PubMed] [Google Scholar]
- 42. Pech V, Thumova M, Kim YH, Agazatian D, Hummler E, Rossier BC, Weinstein AM, Nanami M, Wall SM. ENaC inhibition stimulates Cl- secretion in the mouse cortical collecting duct through an NKCC1-dependent mechanism. Am J Physiol Renal Physiol 303: F45–F55, 2012 [DOI] [PMC free article] [PubMed] [Google Scholar]
- 43. Quinones-Galvan A, Ferrannini E. Renal effects of insulin in man. J Nephrol 10: 188–191, 1997 [PubMed] [Google Scholar]
- 44. Rossetti L, Klein-Robbenhaar G, Giebisch G, Smith D, DeFronzo R. Effect of insulin on renal potassium metabolism. Am J Physiol Renal Fluid Electrolyte Physiol 252: F60–F64, 1987 [DOI] [PubMed] [Google Scholar]
- 45. Sandberg MB, Riquier AD, Pihakaski-Maunsbach K, McDonough AA, Maunsbach AB. ANG II provokes acute trafficking of distal tubule Na+-Cl− cotransporter to apical membrane. Am J Physiol Renal Physiol 293: F662–F669, 2007 [DOI] [PubMed] [Google Scholar]
- 46. Shao X, Somlo S, Igarashi P. Epithelial-specific Cre/lox recombination in the developing kidney and genitourinary tract. J Am Soc Nephrol 13: 1837–1846, 2002 [DOI] [PubMed] [Google Scholar]
- 47. Shimkets RA, Lifton R, Canessa CM. In vivo phosphorylation of the epithelial sodium channel. Proc Natl Acad Sci USA 95: 3301–3305, 1998 [DOI] [PMC free article] [PubMed] [Google Scholar]
- 48. Siddle K. Signalling by insulin and IGF receptors: supporting acts and new players. J Mol Endocrinol 47: R1–R10, 2011 [DOI] [PubMed] [Google Scholar]
- 49. Sohara E, Rai T, Yang SS, Ohta A, Naito S, Chiga M, Nomura N, Lin SH, Vandewalle A, Ohta E, Sasaki S, Uchida S. Acute insulin stimulation induces phosphorylation of the Na-Cl cotransporter in cultured distal mpkDCT cells and mouse kidney. PLoS One 6: e24277, 2011 [DOI] [PMC free article] [PubMed] [Google Scholar]
- 50. Song J, Hu X, Riazi S, Tiwari S, Wade JB, Ecelbarger CA. Regulation of blood pressure, the epithelial sodium channel (ENaC), and other key renal sodium transporters by chronic insulin infusion in rats. Am J Physiol Renal Physiol 290: F1055–F1064, 2006 [DOI] [PubMed] [Google Scholar]
- 51. Song J, Hu X, Shi M, Knepper MA, Ecelbarger CA. Effects of dietary fat, NaCl, and fructose on renal sodium and water transporter abundances and systemic blood pressure. Am J Physiol Renal Physiol 287: F1204–F1212, 2004 [DOI] [PubMed] [Google Scholar]
- 52. Staruschenko A, Pochynyuk O, Vandewalle A, Bugaj V, Stockand JD. Acute regulation of the epithelial Na+ channel by phosphatidylinositide 3-OH kinase signaling in native collecting duct principal cells. J Am Soc Nephrol 18: 1652–1661, 2007 [DOI] [PubMed] [Google Scholar]
- 53. Steele-Perkins G, Turner J, Edman JC, Hari J, Pierce SB, Stover C, Rutter WJ, Roth RA. Expression and characterization of a functional human insulin-like growth factor I receptor. J Biol Chem 263: 11486–11492, 1988 [PubMed] [Google Scholar]
- 54. Stricklett PK, Nelson RD, Kohan DE. Targeting collecting tubules using the aquaporin-2 promoter. Exp Nephrol 7: 67–74, 1999 [DOI] [PubMed] [Google Scholar]
- 55. Tiwari S, Listhrop R, Ecelbarger CA. Increased blood pressure and Na-K-2Cl cotransporter (NKCC2) abundance in response to chronic insulin infusion in mice lacking the insulin receptor in the thick ascending limb through collecting duct (Abstract). J Am Soc Nephrol 18: 118(A), 2007 [Google Scholar]
- 56. Tiwari S, Nordquist L, Halagappa VK, Ecelbarger CA. Trafficking of ENaC subunits in response to acute insulin in mouse kidney. Am J Physiol Renal Physiol 293: F178–F185, 2007 [DOI] [PubMed] [Google Scholar]
- 57. Tiwari S, Sharma N, Gill PS, Igarashi P, Kahn CR, Wade JB, Ecelbarger CM. Impaired sodium excretion and increased blood pressure in mice with targeted deletion of renal epithelial insulin receptor. Proc Natl Acad Sci USA 105: 6469–6474, 2008 [DOI] [PMC free article] [PubMed] [Google Scholar]
- 58. Vehaskari VM, Hering-Smith KS, Moskowitz DW, Weiner ID, Hamm LL. Effect of epidermal growth factor on sodium transport in the cortical collecting tubule. Am J Physiol Renal Fluid Electrolyte Physiol 256: F803–F809, 1989 [DOI] [PubMed] [Google Scholar]
- 59. Wade JB, Fang L, Coleman RA, Liu J, Grimm PR, Wang T, Welling PA. Differential regulation of ROMK (Kir1.1) in distal nephron segments by dietary potassium. Am J Physiol Renal Physiol 300: F1385–F1393, 2011 [DOI] [PMC free article] [PubMed] [Google Scholar]
- 60. Weisz OA, Wang JM, Edinger RS, Johnson JP. Non-coordinate regulation of endogenous epithelial sodium channel (ENaC) subunit expression at the apical membrane of A6 cells in response to various transporting conditions. J Biol Chem 275: 39886–39893, 2000 [DOI] [PubMed] [Google Scholar]
- 61. Zhang YH, Alvarez de la Rosa D, Canessa CM, Hayslett JP. Insulin-induced phosphorylation of ENaC correlates with increased sodium channel function in A6 cells. Am J Physiol Cell Physiol 288: C141–C147, 2005 [DOI] [PubMed] [Google Scholar]