

Abstract
Background
The impact of anti-vector immunity on the elicitation of insert-specific immune responses is important to understand in vaccine development. HVTN 055 was a 150 person phase I randomized, controlled HIV vaccine trial of recombinant modified vaccinia Ankara (rMVA) and fowlpox (rFPV) with matched HIV-1 inserts which demonstrated increased CD8+ T-cell immune responses in the heterologous vaccine group. The controls used in this study were the empty vectors (MVA and FPV).
Methods
Anti-MVA and anti-vaccinia neutralizing antibodies (NAbs) were measured and compared with cellular and humoral HIV-1-specific immune responses.
Results
Elicitation of anti-vector responses increased with increasing dose of MVA and up to 2 administrations. Further inoculations of MVA (up to 5) did not increase the magnitude of the anti-MVA response but did delay the anti-vector NAb titre decay. There was no evidence that the insert impaired the anti-vector response, nor that anti-vector immunity attenuated the insert-specific responses.
Conclusion
Two doses of MVA may be ideal for the elicitation of orthopoxvirus immune responses with further doses maintaining increased titres against the vector. We found no evidence that eliciting HIV insert- or MVA vector-specific immune responses interfered with elicitation of immune responses to the other.
Trial Registration
http://www.clinicaltrials.gov/ Identifier: NCT00083603
Keywords: Immunogenicity, Dose, MVA, Fowlpoxvirus, HIV vaccine, Prime-boost
INTRODUCTION
Recombinant poxvirus vectors are leading candidates for HIV-1 vaccines due to their safety, immunogenicity, genetic stability, and tolerance of large inserts [1]. However, anti-vector immune responses develop following immunization, potentially limiting responses to the immunogen. Heterologous prime-boosting may circumvent immune responses directed against the initial vector, thus allowing boosting of immune responses to the insert [2, 3].
In HVTN 055, a recombinant modified vaccinia Ankara (rMVA) vector and a recombinant fowlpoxvirus (rFPV) vector were constructed with matching HIV-1-derived inserts (rMVA-HIV and rFPV-HIV) and different prime-boost regimens were compared [4]. The heterologous regimens of two rMVA-HIV injections followed by three rFPV-HIV injections (rMVA-HIV(2)/rFPV-HIV(3)) led to higher frequencies of HIV-1-specific CD8+ T cells compared with a homologous regimen of five injections of rMVA-HIV (rMVA-HIV(5)) [4]. In contrast, gp120-specific antibodies were induced in two-thirds of the rMVA-HIV(5) group, but less than 22% of the recipients who received rMVA-HIV(2)/rFPV-HIV(3) [4]. This study utilized unique control vaccines, namely non-recombinant empty MVA and FPV vectors rather than a placebo, which allows for an assessment of the impact of vector and insert responses on each other. In our prior work [5, 6], peak anti-MVA neutralizing antibody (NAb) responses blunted the “take” following VACV challenge and in turn appeared to limit T cell responses to VACV. We therefore hypothesized that repeated inoculations with the same vector may have induced anti-vector immune responses which could have blunted responses to the HIV-1 specific insert. We performed NAb assays for MVA and vaccinia virus (VACV) on sera from the HVTN 055 study and compared the induction of anti-vector with anti-insert immune responses.
MATERIALS AND METHODS
Study Design and Subjects
HVTN 055 was a randomized, controlled, double-blinded phase I clinical trial which enrolled 150 HIV-uninfected, vaccinia-naïve volunteers. The recombinant rMVA and rFPV vectors with matched HIV-1-derived inserts (rMVA-HIV and rFPV-HIV) were provided by Therion Biologics (Cambridge, MA) and empty vectors (MVA and FPV) were used as controls. FPV and rFPV-HIV were given at a dose of 1 × 10⁹ plaque-forming units (pfu) while MVA and rMVA-HIV were given at escalating doses of 1 × 10⁷, 1 × 10⁸, or 1 × 10⁹ pfu. Inoculations were given at 0, 1, 3, 5, and 7 months and the heterologous groups received MVA or rMVA-HIV at 0 and 1 months and FPV or rFPV-HIV at 3, 5, and 7 months (MVA(2)/FPV(3) or rMVA-HIV(2)/rFPV-HIV(3)). Demographics, safety assessments, and immune responses to the HIV-1-derived inserts have been reported [4]. Three subjects were excluded from our analyses (one each from the 109 rMVA-HIV(2)/rFPV-HIV(3), 109 rFPV-HIV(5), and 109 FPV(5) groups) as no baseline samples were available; a fourth subject (from the 109 rMVA-HIV(5) group) was excluded as no samples were available following the enrollment vaccination.
Orthopoxvirus Neutralization Assays
NAb responses against VACV and MVA were measured on serum samples obtained prior to immunization (day 0) and two weeks following first (day 14), second (day 42), third (day 98), fourth (day 154), and fifth immunizations (day 210), and days 273 and 394, using a luciferase based assay as described [6, 7]. The limit of detection for the assay was a titre of 1:10. A positive response for the MVA and VACV assays was defined as a titre ≥2 times the baseline (day 0) titre and ≥ 1:20.
HIV-1 Specific Immune Responses
Details of the cellular and humoral immune responses to the HIV-1-derived inserts have been reported [4]. Briefly, ICS assays [8] to measure T cell responses to HIV-1 PTE-G peptide pools [9] were run on specimens from days 42, 98, 154, and 394. Data on responses to any peptide pool and overall magnitude (background-adjusted percentage of positive cells) for a T cell subset were used. Anti-Gag (p24) and anti-Env (gp120) binding antibody responses were determined by HVTN-validated ELISAs [10] run on specimens obtained on days 98, 154, 210, and 394.
Statistical Analysis
Analyses were generally performed as intent-to-treat (ITT) with all subjects with assay data included regardless of the number of inoculations received. Per-protocol (PP) analyses were used when noted and refer to analyses in which subjects are excluded from a time point if they did not receive all scheduled inoculations prior to that time point.
Analyses of the association of MVA or VACV neutralization with HIV-1-specific T cell responses measured by ICS and HIV-1 binding antibody responses measured by ELISA were limited to subjects who received vaccine containing the HIV-1-derived inserts (vaccinees) and did not include the 107 and 108 rMVA-HIV(2)/rFPV-HIV(3) arms due to small numbers. Subjects who received empty vectors were excluded from analyses comparing insert and vector response. To assess differences in ICS and ELISA response rates and MVA or VACV neutralization, vector-specific neutralization was categorized into low (non-responder or titre less than the median for responders for that assay/arm/visit) and high (titre greater than or equal to the median for responders for that assay/arm/visit).
Differences in rates were tested with two-sided Fisher exact tests and differences in titre distributions were tested with Wilcoxon rank sum tests. Tests with a two-sided p value < 0.05 were considered significant. No adjustments were made for multiple comparisons. 95% confidence intervals (CIs) for response rates were calculated using the score test method [11]. Spearman correlations were used to assess the correlation between MVA or VACV titres and the magnitude of T cell responses or background-adjusted ELISA ODs for responders to the two assays being compared; correlation comparisons were limited to those with a sample size of at least 10.
RESULTS
Anti-Vector Neutralizing Antibody Responses
Baseline NAb responses to MVA and VACV were low as expected since subjects were vaccinia-naive [4]. NAb responses to MVA and VACV were detected in a dose-dependent manner (Figure 1; Table 1, ITT; Supplemental Table 1, PP) from subjects who received MVA either alone or followed by FPV. Importantly, response rates for the MVA and VACV neutralization assays were similar for those in the vaccine (rMVA-HIV) and control (MVA) arms within a dose group (Supplemental Figure 1A-1E). Therefore, comparisons examining MVA and VACV response rates and titres by group combine vaccinees with subjects who received empty vector controls. Titres were higher when neutralization was measured against MVA than VACV, as reported [6], but the overall kinetics were similar between the two assays. Subjects who received FPV alone had essentially no NAb responses to either MVA or VACV.
Figure 1. Neutralizing antibody (NAb) titres to MVA and VACV are elicited in a dose-dependent manner among responders.
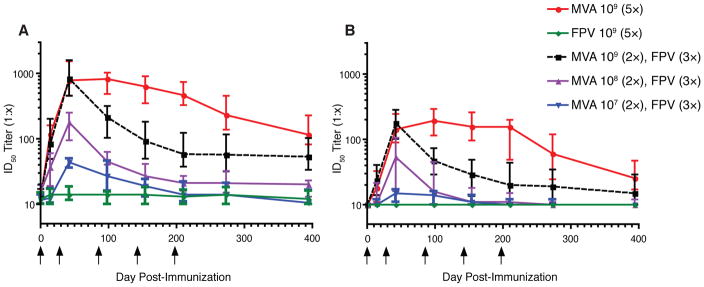
Serum samples were obtained at days 0, 14, 42, 98, 154, 210, 273, and 394 following immunization. Serial dilutions were tested for neutralizing activity against (A) MVA:Luc or (B) VACV:Luc. Data are presented as median ID50 titres with interquartile ranges (IQR) for each dose and immunization group. The limit of detection was a serum ID50 titre of 10 and arrows indicate days of immunization. A positive response was defined as a titre ≥ 2 times the day 0 titre and ≥ 1:20.
Table 1.
Neutralizing antibody response rates against MVA and VACV by Intent-to-Treat (ITT) analyses.
| Group | Day post vaccination | Proportion Responding [95% CI] | |
|---|---|---|---|
| MVA | VACV | ||
| 1 × 10⁹ FPV(5) | 14 | 1/39 (2.6%) [0.5%–13.2%] | 0/39 (0%) [0.0%–9.0%] |
| 42 | 1/39 (2.6%) [0.5%–13.2%] | 0/39 (0%) [0.0%–9.0%] | |
| 98 | 2/38 (5.3%) [1.5%–17.3%] | 0/38 (0%) [0.0%–9.2%] | |
| 154 | 1/36 (2.8%) [0.5%–14.2%] | 0/36 (0%) [0.0%–9.6%] | |
| 210 | 1/35 (2.9%) [0.5%–14.5%] | 1/35 (2.9%) [0.5%–14.5%] | |
| 273 | 1/36 (2.8%) [0.5%–14.2%] | 0/36 (0%) [0.0%–9.6%] | |
| 394 | 1/37 (2.7%) [0.5%–13.8%] | 0/37 (0%) [0.0%–9.4%] | |
| 1 × 10⁷ MVA(2)/FPV(3) | 14 | 1/12 (8.3%) [1.5%–35.4%] | 0/12 (0%) [0.0%–24.2%] |
| 42 | 9/11 (81.8%) [52.3%–94.9%] | 2/11 (18.2%) [5.1%–47.7%] | |
| 98 | 7/11 (63.6%) [35.4%–84.8%] | 2/11 (18.2%) [5.1%–47.7%] | |
| 154 | 2/11 (18.2%) [5.1%–47.7%] | 0/11 (0%) [0.0%–25.9%] | |
| 210 | 1/11 (9.1%) [1.6%–37.7%] | 0/11 (0%) [0.0%–25.9%] | |
| 273 | 2/11 (18.2%) [5.1%–47.7%] | 0/11 (0%) [0.0%–25.9%] | |
| 394 | 0/10 (0%) [0.0%–27.8%] | 0/10 (0%) [0.0%–27.8%] | |
| 1 × 10⁸ MVA(2)/FPV(3) | 14 | 6/12 (50.0%) [25.4%–74.6%] | 3/12 (25.0%) [8.9%–53.2%] |
| 42 | 11/12 (91.7%) [64.6%–98.5%] | 8/12 (66.7%) [39.1%–86.2%] | |
| 98 | 9/11 (81.8%) [52.3%–94.9%] | 5/11 (45.5%) [21.3%–72.0%] | |
| 154 | 6/11 (54.5%) [28.0%–78.7%] | 2/11 (18.2%) [5.1%–47.7%] | |
| 210 | 3/11 (27.3%) [9.7%–56.6%] | 1/11 (9.1%) [1.6%–37.7%] | |
| 273 | 3/11 (27.3%) [9.7%–56.6%] | 1/11 (9.1%) [1.6%–37.7%] | |
| 394 | 2/11 (18.2%) [5.1%–47.7%] | 1/11 (9.1%) [1.6%–37.7%] | |
| 1 × 10⁹ MVA(2)/FPV(3) | 14 | 40/41 (97.6%) [87.4%–99.6%] | 23/41 (56.1%) [41.0%–70.1%] |
| 42 | 41/41 (100%) [91.4%–100.0%] | 41/41 (100%) [91.4%–100.0%] | |
| 98 | 38/38 (100%) [90.8%–100.0%] | 32/38 (84.2%) [69.6%–92.6%] | |
| 154 | 36/36 (100%) [90.4%–100.0%] | 24/36 (66.7%) [50.3%–79.8%] | |
| 210 | 33/36 (91.7%) [78.2%–97.1%] | 18/36 (50.0%) [34.5%–65.5%] | |
| 273 | 32/36 (88.9%) [74.7%–95.6%] | 17/36 (47.2%) [32.0%–63.0%] | |
| 394 | 30/37 (81.1%) [65.8%–90.5%] | 11/37 (29.7%) [17.5%–45.8%] | |
| 1 × 10⁹ MVA(5) | 14 | 40/41 (97.6%) [87.4%–99.6%] | 19/41 (46.3%) [32.1%–61.3%] |
| 42 | 41/41 (100%) [91.4%–100.0%] | 41/41 (100%) [91.4%–100.0%] | |
| 98 | 40/40 (100%) [91.2%–100.0%] | 39/40 (97.5%) [87.1%–99.6%] | |
| 154 | 37/37 (100%) [90.6%–100.0%] | 35/37 (94.6%) [82.3%–98.5%] | |
| 210 | 36/36 (100%) [90.4%–100.0%] | 34/36 (94.4%) [81.9%–98.5%] | |
| 273 | 34/34 (100%) [89.8%–100.0%] | 28/34 (82.4%) [66.5%–91.7%] | |
| 394 | 35/36 (97.2%) [85.8%–99.5%] | 23/36 (63.9%) [47.6%–77.5%] | |
Response rates were low for the 107 MVA(2)/FPV(3) group but increased with increasing dosage of MVA and between the first and second inoculations (Figure 1; Table 1). For both the 109 MVA(2)/FPV(3) and the 109 MVA(5) groups, 100% response rates were observed for MVA and VACV neutralization after the second inoculation. Continued administration of MVA after the second inoculation did not lead to higher NAb titres in the 109 MVA(5) group but did lead to a slower decline in titres compared with the 109 MVA(2)/FPV(3) group. Statistically significant or borderline differences in response rates between the 109 MVA(2)/FPV(3) and the 109 MVA(5) groups were observed for MVA neutralization at day 394 (p=0.06 ITT, p=0.01 PP) and for VACV neutralization at day 98 (p=0.054 ITT, p=0.03 PP) and days 154, 210, 273, and 394 (all p values <0.005). In the 108 MVA(2)/FPV(3) group, 11 of 12 (91.7%) recipients responded to MVA after the second inoculation, while in the 107 MVA(2)/FPV(3) group 9 of 11 (81.8%) subjects responded.
Following the second inoculation, orthopoxvirus-specific NAb titres declined in the heterologous groups compared with the 109 MVA(5) group. By day 394, 8 of 10 (80%) subjects in the 107 MVA(2)/FPV(3) group had anti-MVA NAb titres < 1:20, as did 5 of 11 (45.4%) subjects in the 108 MVA(2)/FPV(3) group. Only 3 of 37 (8.1%) subjects in the 109 MVA(2)/FPV(3) group and none (0 of 36) of the subjects in the 109 MVA(5) arm had seroreverted by day 394.
Taken together, our results demonstrate that the HIV-1 inserts had no obvious impact on the development or maintenance of vector-specific neutralization activity. A clear dose-dependent effect on peak NAb titres is seen with MVA administration. Furthermore, while two inoculations of MVA at 109 pfu led to a maximal response rate and titre, the decline in VACV and MVA NAb titres was substantially delayed by continued inoculations of MVA.
Comparison of MVA and VACV Neutralization with T cell Responses
We compared anti-vector NAb responses with T cell responses directed against the HIV-1 insert to determine if anti-vector responses interfered with the development of insert-specific cellular immune responses. With respect to anti-MVA NAbs, there were two significant differences in T cell response rates between high and low anti-MVA neutralization groups (Table 2): 109 rMVA-HIV(2)/rFPV-HIV(3) CD8+ T cell responses at day 394 (high=70%, low=25%, p=0.04) and 109 rMVA-HIV(5) CD4+ T cell responses at day 394 (high=0%, low=31%, p=0.03). For the VACV NAb assay, 109 rMVA-HIV(2)/rFPV-HIV(3) vaccinees with high neutralization activity had significantly higher CD8+ T cell responses than the low neutralization group at day 98 (high=54.5%, low=7%, p=0.02) and day 154 (high=90%, low=29%, p=0.004).
Table 2.
HIV-1-specific T cell responses stratified by high vs low neutralization against MVA or VACV
| Day Post Vaccination a | Study Arm b | Neutralization Assay c | T cell Subset d | High Neutralization e | Low Neutralization | p value f |
|---|---|---|---|---|---|---|
| 98 | rMVA-HIV(2)/rFPV-HIV(3) | VACV | CD8+ | 6/11 (54.5%) | 1/15 (6.7%) | 0.021 |
| MVA | CD8+ | 5/14 (35.7%) | 2/12 (16.7%) | 0.391 | ||
| 154 | rMVA-HIV(2)/rFPV-HIV(3) | VACV | CD8+ | 9/10 (90.0%) | 5/17 (29.4%) | 0.004 |
| MVA | CD8+ | 10/14 (71.4%) | 4/13 (30.8%) | 0.057 | ||
| 394 | rMVA-HIV(2)/rFPV-HIV(3) | VACV | CD8+ | 3/4 (75.0%) | 8/22 (36.4%) | 0.279 |
| MVA | CD8+ | 7/10 (70.0%) | 4/16 (25.0%) | 0.043 | ||
| rMVA-HIV(5) | VACV | CD4+ | 0/10 (0%) | 4/18 (22.0%) | 0.265 | |
| MVA | CD4+ | 0/15 (0%) | 4/13 (30.8%) | 0.035 |
Enrollment is concurrent with the first vaccination; only time points with at least one comparison with p < 0.100 are shown
rMVA-HIV(5): 109 pfu/2 mL of rMVA for 5 vaccinations; rMVA-HIV(2)/rFPV-HIV(3): 109 pfu/2 mL of rMVA for 2 vaccinations followed by 109 pfu/2 mL of rFPV for 3 vaccinations
Neutralizing antibodies (NAb) assayed against either VACV-luciferase or MVA-luciferase
T cell subset which responded to the HIV-1-specific insert by flow cytometry
High neutralization: responder and ≥ median Nab titres for responders from the group; low neutralization: non-responders or < median titres for responders from the group
p value determined by two-tailed Fisher’s exact test comparing high neutralization vs low neutralization
For responders to MVA or VACV, we compared their MVA and VACV NAb titres by CD4+ or CD8+ T cell response to evaluate any association between T cell responses to the insert and MVA or VACV titres. There were no significant differences in the distributions of MVA or VACV NAb titres between T cell responders and non-responders, except for CD8+ T cell responses among 109 rMVA-HIV(2)/rFPV-HIV(3) vaccinees at day 154 for MVA NAb titres (median titre for responders = 184.5, for non-responders = 51.0, p=0.002) and at day 98 for VACV titres (median titre for responders = 92.0, for non-responders = 41.0, p=0.02).
We used Spearman correlation to evaluate associations between the magnitude of the anti-insert T cell responses and anti-vector NAb titres. Among responders to the MVA and ICS assays, the correlations between MVA NAb titres with the magnitude of T cell responses were low to moderate (Figures 2A-C), with only the CD4+ T cell responses in the 109 rMVA-HIV(2)/rFPV-HIV(3) group at day 154 being significant (r=0.52, p=0.046). For the VACV assay, the CD4+ comparison for the 109 rMVA-HIV(2)/rFPV-HIV(3) group at day 42 (after 2 MVA vaccinations) was significant (r=0.59, p=0.03) but not when the 109 rMVA-HIV(2)/rFPV-HIV(3) and 109 rMVA-HIV(5) arms were combined (r=0.21).
Figure 2. The magnitude of anti-vector NAb responses has little impact on the magnitude of HIV-1 cellular immune responses by rMVA-HIV among vaccinees.

The magnitude of HIV-1 specific CD4+ T cell responses among responders detected by intracellular cytokine staining (ICS) were compared with (A) anti-MVA and (B) anti-VACV NAb titers for NAb responders at days 42, 98, and 154. The magnitude of HIV-1 specific CD8+ T cell response among responders detected by ICS (C) were compared with anti-MVA (left) and anti-VACV (right) NAb titers for NAb responders at day 154.
Overall, these limited associations suggest that vector-specific humoral responses elicited by MVA do not interfere with development of cell-mediated responses directed against the HIV-1 insert. In fact, most interactions observed are in the opposite direction; there is some evidence of a modest, but positive, association between anti-vector neutralization activity and T cell responses elicited by the insert.
Comparison of MVA and VACV Neutralization and HIV ELISA Responses
We also compared binding antibody responses elicited by the HIV-1 insert to vector-specific neutralization activity. There were no significant differences in ELISA response rates to either p24 or gp120 between the high and low MVA neutralization groups (Table 3). For VACV neutralization, there were no significant differences in ELISA response rates to either p24 or gp120 in the 109 rMVA-HIV(2)/rFPV-HIV(3) vaccine arm. Among vaccinees who received 109 rMVA-HIV(5), the high VACV neutralization group had higher ELISA response rates (except at day 394) with significant differences for both p24 and gp120 on day 98 (p=0.02 for both), and gp120 on days 154 (p=0.05) and 210 (p=0.004).
Table 3.
HIV-1-specific ELISA antibody responses stratified by high vs low neutralization against MVA or VACV
| Day Post Vaccination a | Study Arm b | Neutralization Assay c | ELISA antigen d | High Neutralization e | Low Neutralization | p value f |
|---|---|---|---|---|---|---|
| 98 | rMVA-HIV(5) | VACV | p24 | 6/16 (37.5%) | 0/14 (0%) | 0.019 |
| MVA | p24 | 3/15 (20.0%) | 3/15 (20.0%) | 1.000 | ||
| VACV | gp120 | 14/16 (87.5%) | 6/14 (42.9%) | 0.019 | ||
| MVA | gp120 | 10/15 (66.7%) | 10/15 (66.7%) | 1.000 | ||
| 154 | rMVA-HIV(5) | VACV | gp120 | 13/15 (86.7%) | 7/14 (50.0%) | 0.050 |
| MVA | gp120 | 12/15 (80.0%) | 8/14 (57.1%) | 0.245 | ||
| 210 | rMVA-HIV(2)/rFPV-HIV(3) | VACV | p24 | 7/8 (87.5%) | 10/17 (58.8%) | 0.205 |
| MVA | p24 | 9/10 (90.0%) | 9/16 (56.3%) | 0.099 | ||
| rMVA-HIV(5) | VACV | gp120 | 13/14 (92.9%) | 5/14 (35.7%) | 0.004 | |
| MVA | gp120 | 10/14 (71.4%) | 8/14 (57.1%) | 0.695 |
Enrollment is concurrent with the first vaccination; only time points with at least one comparison with p < 0.100 are shown
rMVA-HIV(5): 109 pfu/2 mL of rMVA for 5 vaccinations; rMVA-HIV(2)/rFPV-HIV(3): 109 pfu/2 mL of rMVA for 2 vaccinations followed by 109 pfu/2 mL of rFPV for 3 vaccinations
Neutralizing antibodies (NAb) assayed against either VACV-luciferase or MVA-luciferase
Binding antibodies measured against Gag (p24) or Env (gp120)
High neutralization: responder and ≥ median Nab titres for responders from the group; low neutralization: non-responders or < median titres for responders from the group
p value determined by two-tailed Fisher’s exact test comparing high neutralization vs low neutralization
For responders to MVA or VACV, we also compared their NAb titres by whether they had binding antibody responses to p24 or gp120 elicited by the HIV-1 insert. There were no significant differences in MVA NAb titres between those who responded to p24 or gp120. Among vaccinees in the 109 rMVA-HIV(5) arm with a VACV response, p24 responders had significantly higher VACV NAb titres than non-responders at day 154 (p=0.01) and gp120 responders had significantly higher VACV NAb titres at days 98 (p=0.03), 154 (p=0.04), and 210 (p=0.005). Among 109 rMVA-HIV(2)/rFPV-HIV(3) vaccinees, the difference in VACV titres between p24 responders and non-responders at day 210 was significant (p=0.04).
We used Spearman correlation to evaluate for associations between the magnitude of the binding antibody responses to the HIV-1 insert and anti-vector NAb titres. Correlations between MVA or VACV NAb titres and ELISA background-adjusted ODs for responders were low (range of r values −0.38 – 0.46), with no significant differences.
Taken together, these modest associations suggest that vector-specific neutralization activity elicited by MVA do not interfere with development of binding antibody responses directed against the HIV-1 insert. While there was no interaction between MVA neutralization and ELISA responses, those vaccinees with high VACV neutralization activity were more likely to have a response to gp120.
DISCUSSION
We characterized anti-orthopoxvirus NAb responses elicited by MVA vaccination at doses from 107 to 109 pfu in subjects who were inoculated with MVA or MVA followed by FPV. Neutralizing antibody responses against MVA and VACV were clearly generated by the 108 and 109 doses of MVA, but only a minority of recipients in the 107 dose group seroconverted against VACV. Interestingly, a single administration of MVA in the highest dose groups (109 MVA(2)/FPV(3) or MVA(5)) elicited detectable anti-MVA and anti-VACV NAb titres in most subjects at day 14 compared to a 50% response rate to MVA and 25% response rate to VACV in the 108 MVA(2)/FPV(3) group after a single injection. These titres substantially increased by day 42 and all subjects in the 109 MVA(2)/FPV(3) and MVA(5) groups seroconverted.
Further inoculations of MVA did not lead to boosting in MVA or VACV NAb titres, but did lead to a slower decline in titres compared with the 109 MVA(2)/FPV(3) group. By day 394, 97% of subjects in the 109 MVA(5) group still had detectable anti-MVA NAb responses compared with 81% in the 109 MVA(2)/FPV(3) arm. For VACV-specific neutralization, the difference was more pronounced: 64% for the 109 MVA(5) group versus 30% in the 109 MVA(2)/FPV(3) arm. This suggests that two doses of MVA are optimal, at least for eliciting anti-orthopoxvirus responses, although the utility of booster doses on a longer time scale are not known.
MVA has most often been administered twice at a one month interval [6, 12–14]. One study using MVA-TBC (Therion), similar to the strain used in HVTN 055 but at a dose of 1 × 10⁶ pfu, inoculated volunteers up to three times and found little difference in orthopoxvirus-specific NAb titres, CD4+ T cell responses, or CD8+ T cell responses between subjects vaccinated with MVA once, twice, or thrice prior to Dryvax challenge [15]. In HVTN 065, rMVA with HIV-1 inserts was given twice following a DNA priming vaccine versus thrice without a prime. Recipients in the DNA prime/rMVA boost arm had significantly lower VACV-specific T cell responses after the first rMVA boost than subjects who received rMVA alone, but this inhibition was overcome by the second dose of rMVA [16]. In two studies using MVA to deliver melanoma-derived CD8+ T cell epitopes, the rMVA-Mel3 vaccine was given up to four times at doses ranging from 107 to 109 pfu to patients with melanoma [17, 18]. Anti-MVA binding antibodies and MVA-specific T cells were elicited but detailed kinetics for the humoral responses were not described [17, 18]. MVA-specific T cell responses were generally maximal after two injections, although two of five patients had increased VACV epitope-specific CD8+ T cell responses after all four inoculations [19].
Although we did not see evidence of boosting in NAb titres after the second immunization, there was boosting of insert-specific CD8+ T cell responses in the rMVA-HIV(2)/rFPV-HIV(3) groups, particularly at the highest dose [4]. In contrast, heterologous boosting did not increase anti-Env antibody responses which were highest in the 109 rMVA-HIV(5) group [4]. We explored the relationship between anti-vector and anti-insert responses and we found minimal interaction between the two. High MVA or VACV NAb titres were not associated with lower T cell responses to the HIV inserts, suggesting that anti-vector responses do not interfere with development of responses to the immunogen. There was some evidence of a positive association between VACV neutralization and CD8+ T cell responses among vaccinees who received rMVA-HIV(2)/rFPV-HIV(3), although this association was not seen with MVA neutralization. There was no association between MVA neutralization and ELISA responses against gp120 or p24, but vaccinees receiving rMVA-HIV(5) who had high VACV neutralization activity were more likely to have an antibody response to gp120.
In an analogous macaque study using rVACV, rMVA, and rFPV vectors from Therion (similar to the vectors used in HVTN 055) at a dose of 2 × 10⁹ pfu which delivered SIV-derived inserts [20], our group found evidence that a third dose of rMVA did elicit boosting of anti-orthopoxvirus humoral responses [7]. In a regimen of rMVA-SIV at weeks 0, 8, 26, and 43, higher anti-VACV binding antibodies were seen at week 48 than in animals inoculated with either rMVA-SIV or rVACV-SIV followed by rFPV-SIV. Anti-vector NAb and comet neutralization were also boosted after the third dose [7]. A fourth dose of rMVA-SIV did not lead to increases in anti-orthopoxvirus NAb titres, but peak titres were maintained for over four months [7]. The differences in the vaccination schedule or dose of rMVA between the macaque study and HVTN 055 could explain the differences we observed in the pattern of immune responses following booster inoculation.
Our results from HVTN 055 highlight several important concepts. First, orthopoxvirus-specific NAbs are induced by rMVA inoculation in a dose-dependent fashion from 1 × 10⁷ to 1 × 10⁹ pfu. While a second dose boosts NAb titres, further doses do not yield higher titres but do significantly delay the decay in NAb titres over more than one year of follow-up. Furthermore, orthopoxvirus-specific NAb titres were not different between subjects administered rMVA-HIV compared with those inoculated with the empty vector, suggesting that the HIV-1-derived insert does not interfere with induction of anti-vector humoral immune responses. Finally, anti-vector NAb responses elicited by rMVA-HIV do not interfere with the development of responses directed against the HIV-1-derived insert in an orthopoxvirus-naive cohort. In fact, the associations we identified suggest that there may be a positive, albeit modest, interaction between anti-vector and anti-insert responses. This possible association may reflect underlying host genetics or adjuvant-like properties of the viral vector and should be examined in a larger cohort with detailed examination of vector-induced cellular immune responses.
Supplementary Material
Supplemental Figure 1. Anti-orthopoxvirus NAb responses elicited by a heterologous prime-boost regimen compared with homologous recombinant vector vaccination. Anti-MVA (top) and anti-VACV (bottom) NAb titres were assessed in subjects receiving five inoculations of FPV or rFPV-HIV (A), five inoculations of MVA or rMVA-HIV (B), or two inoculations of MVA or rMVA-HIV at 109 pfu (C), 108 pfu (D), or 107 pfu (E) followed by three inoculations of FPV or FPV-HIV at 109 pfu. Box plots of data from responders are superimposed upon the distributions of all assay values. A positive response was defined as a titre ≥ 2 times the day 0 titre and ≥ 1:20.
Supplemental Table 1. Neutralizing antibody response rates against MVA and VACV by Per-Protocol (PP) analyses.
Highlights.
Virus-specific neutralizing antibodies are induced by MVA in a dose-dependent fashion
A second dose of MVA boosts NAb titres, but further doses do not yield higher titres
An HIV-1-derived insert did not interfere with induction of anti-vector antibodies
Anti-vector antibodies did not interfere with induction of HIV-1-specific responses
Acknowledgments
Funding:
National Institute of Allergy and Infectious Diseases (U.S. Public Health Service Grants U54 AI057159, U19 AI057330, UM1 AI069412, and K23 AI085181)
Footnotes
Potential Conflict of Interest: none
Publisher's Disclaimer: This is a PDF file of an unedited manuscript that has been accepted for publication. As a service to our customers we are providing this early version of the manuscript. The manuscript will undergo copyediting, typesetting, and review of the resulting proof before it is published in its final citable form. Please note that during the production process errors may be discovered which could affect the content, and all legal disclaimers that apply to the journal pertain.
References
- 1.Walsh SR, Dolin R. Vaccinia viruses: vaccines against smallpox and vectors against infectious diseases and tumors. Expert Rev Vaccines. 2011 Aug;10(8):1221–40. doi: 10.1586/erv.11.79. [DOI] [PMC free article] [PubMed] [Google Scholar]
- 2.Barouch DH, Korber B. HIV-1 vaccine development after STEP. Annu Rev Med. 2010;61:153–67. doi: 10.1146/annurev.med.042508.093728. [DOI] [PMC free article] [PubMed] [Google Scholar]
- 3.Paris RM, Kim JH, Robb ML, Michael NL. Prime-boost immunization with poxvirus or adenovirus vectors as a strategy to develop a protective vaccine for HIV-1. Expert Rev Vaccines. 2010 Sep;9(9):1055–69. doi: 10.1586/erv.10.106. [DOI] [PubMed] [Google Scholar]
- 4.Keefer MC, Frey SE, Elizaga M, Metch B, De Rosa SC, Barroso PF, et al. A phase I trial of preventive HIV vaccination with heterologous poxviral-vectors containing matching HIV-1 inserts in healthy HIV-uninfected subjects. Vaccine. 2011 Feb 24;29(10):1948–58. doi: 10.1016/j.vaccine.2010.12.104. [DOI] [PMC free article] [PubMed] [Google Scholar]
- 5.Seaman MS, Wilck MB, Baden LR, Walsh SR, Grandpre LE, Devoy C, et al. Effect of vaccination with modified vaccinia Ankara (ACAM3000) on subsequent challenge with Dryvax. J Infect Dis. 2010 May 1;201(9):1353–60. doi: 10.1086/651560. [DOI] [PMC free article] [PubMed] [Google Scholar]
- 6.Wilck MB, Seaman MS, Baden LR, Walsh SR, Grandpre LE, Devoy C, et al. Safety and immunogenicity of modified vaccinia Ankara (ACAM3000): effect of dose and route of administration. J Infect Dis. 2010 May 1;201(9):1361–70. doi: 10.1086/651561. [DOI] [PMC free article] [PubMed] [Google Scholar]
- 7.Grandpre LE, Duke-Cohan JS, Ewald BA, Devoy C, Barouch DH, Letvin NL, et al. Immunogenicity of recombinant Modified Vaccinia Ankara following a single or multi-dose vaccine regimen in rhesus monkeys. Vaccine. 2009 Mar 4;27(10):1549–56. doi: 10.1016/j.vaccine.2009.01.010. [DOI] [PMC free article] [PubMed] [Google Scholar]
- 8.Horton H, Thomas EP, Stucky JA, Frank I, Moodie Z, Huang Y, et al. Optimization and validation of an 8-color intracellular cytokine staining (ICS) assay to quantify antigen-specific T cells induced by vaccination. J Immunol Methods. 2007;323(1):39–54. doi: 10.1016/j.jim.2007.03.002. [DOI] [PMC free article] [PubMed] [Google Scholar]
- 9.Li F, Malhotra U, Gilbert PB, Hawkins NR, Duerr AC, McElrath JM, et al. Peptide selection for human immunodeficiency virus type 1 CTL-based vaccine evaluation. Vaccine. 2006 Nov 17;24(47–48):6893–904. doi: 10.1016/j.vaccine.2006.06.009. [DOI] [PubMed] [Google Scholar]
- 10.Goepfert PA, Tomaras GD, Horton H, Montefiori D, Ferrari G, Deers M, et al. Durable HIV-1 antibody and T-cell responses elicited by an adjuvanted multi-protein recombinant vaccine in uninfected human volunteers. Vaccine. 2007 Jan 5;25(3):510–8. doi: 10.1016/j.vaccine.2006.07.050. [DOI] [PubMed] [Google Scholar]
- 11.Agresti A, Coull BA. Approximate Is better than “exact” for interval estimation of binomial proportions. Am Stat. 1998 May;52(2):119–26. [Google Scholar]
- 12.Frey SE, Newman FK, Kennedy JS, Sobek V, Ennis FA, Hill H, et al. Clinical and immunologic responses to multiple doses of IMVAMUNE (Modified Vaccinia Ankara) followed by Dryvax challenge. Vaccine. 2007 Dec 12;25(51):8562–73. doi: 10.1016/j.vaccine.2007.10.017. [DOI] [PMC free article] [PubMed] [Google Scholar]
- 13.Vollmar J, Arndtz N, Eckl KM, Thomsen T, Petzold B, Mateo L, et al. Safety and immunogenicity of IMVAMUNE, a promising candidate as a third generation smallpox vaccine. Vaccine. 2006;24(12):2065–70. doi: 10.1016/j.vaccine.2005.11.022. [DOI] [PubMed] [Google Scholar]
- 14.von Krempelhuber A, Vollmar J, Pokorny R, Rapp P, Wulff N, Petzold B, et al. A randomized, double-blind, dose-finding Phase II study to evaluate immunogenicity and safety of the third generation smallpox vaccine candidate IMVAMUNE. Vaccine. 2010 Feb 3;28(5):1209–16. doi: 10.1016/j.vaccine.2009.11.030. [DOI] [PMC free article] [PubMed] [Google Scholar]
- 15.Parrino J, McCurdy LH, Larkin BD, Gordon IJ, Rucker SE, Enama ME, et al. Safety, immunogenicity and efficacy of modified vaccinia Ankara (MVA) against Dryvax® challenge in vaccinia-naïve and vaccinia-immune individuals. Vaccine. 2007;25(8):1513–25. doi: 10.1016/j.vaccine.2006.10.04. [DOI] [PMC free article] [PubMed] [Google Scholar]
- 16.Goepfert PA, Elizaga M, Sato A, Qin L, Cardinali M, Hay C, et al. Phase 1 safety and immunogenicity testing of DNA and recombinant modified vaccinia Ankara vaccines expressing HIV-1 Virus-Like Particles. J Infect Dis. 2011;203(5):610–9. doi: 10.1093/infdis/jiq105. [DOI] [PMC free article] [PubMed] [Google Scholar]
- 17.Dangoor A, Lorigan P, Keilholz U, Schadendorf D, Harris A, Ottensmeier C, et al. Clinical and immunological responses in metastatic melanoma patients vaccinated with a high-dose poly-epitope vaccine. Cancer Immunol Immunother. 2010 Jun;59(6):863–73. doi: 10.1007/s00262-009-0811-7. [DOI] [PMC free article] [PubMed] [Google Scholar]
- 18.Smith CL, Dunbar PR, Mirza F, Palmowski MJ, Shepherd D, Gilbert SC, et al. Recombinant modified vaccinia Ankara primes functionally activated CTL specific for a melanoma tumor antigen epitope in melanoma patients with a high risk of disease recurrence. Int J Cancer. 2005 Jan 10;113(2):259–66. doi: 10.1002/ijc.20569. [DOI] [PubMed] [Google Scholar]
- 19.Smith CL, Mirza F, Pasquetto V, Tscharke DC, Palmowski MJ, Dunbar PR, et al. Immunodominance of poxviral-specific CTL in a human trial of recombinant-modified vaccinia Ankara. J Immunol. 2005 Dec 15;175(12):8431–7. doi: 10.4049/jimmunol.175.12.8431. [DOI] [PubMed] [Google Scholar]
- 20.Santra S, Sun Y, Parvani JG, Philippon V, Wyand MS, Manson K, et al. Heterologous prime/boost immunization of rhesus monkeys by using diverse poxvirus vectors. J Virol. 2007 Aug;81(16):8563–70. doi: 10.1128/JVI.00744-07. [DOI] [PMC free article] [PubMed] [Google Scholar]
Associated Data
This section collects any data citations, data availability statements, or supplementary materials included in this article.
Supplementary Materials
Supplemental Figure 1. Anti-orthopoxvirus NAb responses elicited by a heterologous prime-boost regimen compared with homologous recombinant vector vaccination. Anti-MVA (top) and anti-VACV (bottom) NAb titres were assessed in subjects receiving five inoculations of FPV or rFPV-HIV (A), five inoculations of MVA or rMVA-HIV (B), or two inoculations of MVA or rMVA-HIV at 109 pfu (C), 108 pfu (D), or 107 pfu (E) followed by three inoculations of FPV or FPV-HIV at 109 pfu. Box plots of data from responders are superimposed upon the distributions of all assay values. A positive response was defined as a titre ≥ 2 times the day 0 titre and ≥ 1:20.
Supplemental Table 1. Neutralizing antibody response rates against MVA and VACV by Per-Protocol (PP) analyses.