Abstract
Prostate segmentation in MRI may be difficult at the interface with the bladder where the contrast is poor. Coupled-models that segment simultaneously both organs with non-overlapping constraints offer a good solution. As a pre-segmentation of the structures of interest is required, we propose in this paper a fast deformable model to segment the bladder. The combination of inflation and internal forces, locally adapted according to the gray levels, allow to deform the mesh toward the boundaries while overcoming the leakage issues that can occur at weak edges. The algorithm, evaluated on 33 MRI volumes from 5 different devices, has shown good performance providing a smooth and accurate surface.
Keywords: Algorithms; Computer Simulation; Humans; Image Enhancement; methods; Image Interpretation, Computer-Assisted; methods; Imaging, Three-Dimensional; methods; Magnetic Resonance Imaging; methods; Models, Anatomic; Models, Biological; Pattern Recognition, Automated; methods; Reproducibility of Results; Sensitivity and Specificity; Urinary Bladder; anatomy & histology
Keywords: prostate segmentation, bladder segmentation, active contour model, MRI
I. INTRODUCTION
Prostate cancer is one of the most frequent cancer in men [1], [2]. Mainly treated by surgery or radiotherapy, other alternatives as brachytherapy or high intensity focused ultrasound (HIFU) are also proposed. Except for surgery, these treatments use preoperative imaging to target prostate and preserve sensitive organs in its surrounding as the bladder and the rectum. These organs of interest are delineated, most often manually, before or during the operation. This process is time consuming and is prone to intra- and inter- expert variabilities. Automation of the segmentation step would save significant time and improve the treatment accuracy.
Compared to CT-scan or ultrasound, MRI remains the imaging process that offers the best contrast between structures. As the boundary between organs may be weak, coupled-models techniques, proposed for CT device [3], [4], that simultaneously segment the organs by applying non-overlapping constraints at the interface are promising. However, first approximations of the organs shapes and positions are needed. This paper focuses on the segmentation of the bladder. As the bladder appears with a high contrast compared to its surroundings, the region growing technique is used in [5]. However, due in part to the partial volume effect, the bladder boundary may appear badly defined. The region growing method is not adapted to these cases leading to leakage issues. A level set approach is proposed in [6] to segment the bladder wall but this kind of method can be time consuming.
In this paper, we proposed a fast deformable model that solves the leakage issue. The algorithm combines an inflation force which acts like a region growing process and an internal force which constraints the shape of the surface. The method, with its initialization, its deformation and its resampling processes, is detailed in section II. In section III, the characteristics of the MRI volumes from different devices that have been used to evaluate the method are described. The results of the deformable model compared with those of the region growing method are then presented and discussed. Finally, we conclude in section IV.
II. METHOD
A. Initialization
Given an initial point C inside the bladder, an initial mesh centered at C is built. It is shaped as a small ellipsoid surface (Fig. 1) to roughly match the future bladder global morphology. Its radii, aligned along x, y and z directions, were initialized to 12, 6 and 6 millimeters respectively. Its vertices are organized along Ma = 12 parallels and Mb = 16 meridians. In the next sections, i = (a, b) will represent the index of a vertex located on the parallel a and the meridian b.
Fig. 1.
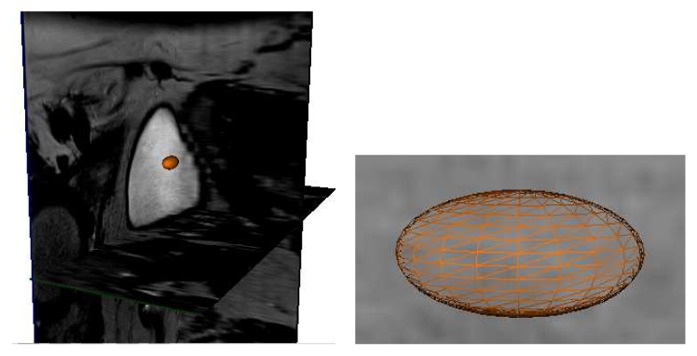
Initialization of the algorithm: ellipsoidal mesh built from an initial point.
A bladder intensity prior Iref is defined to serve as a reference in the segmentation algorithm. This one is given as the average of the gray levels of the voxels included in the initial mesh.
B. Deformation
Once the initial mesh is built, the deformation acts like a Discrete Dynamic Contour [7], [8]. A total force is applied at each vertex i. Then, the dynamic equations derived from Newton’s second law enable to calculate the acceleration a i, the velocity v i and the new position p i of each vertex i from the previous time step:
| (1) |
| (2) |
| (3) |
where mi is the mass at vertex i and Δt the time step. This process is iterated while the deformation of the mesh is significant. Every 10 iterations, the vertex to vertex distances between the previous (at t−10Δt) and the current mesh are computed. While vertices that have moved more than 2 mm exist, the deformation carries on.
In our study, corresponds to a weighted sum of inflation ( ), internal ( ) and damping ( ) forces:
| (4) |
Inflation forces enlarge the mesh according to the intensity of the image at vertex positions. In order to constrain the mesh deformation, the inflation force at a vertex is not only based on the gray level of the voxel corresponding to its location but also on the gray levels of its neighboring vertices. Given a coefficient αj:
| (5) |
where I(xj, yj, zj) is the intensity of the voxel (xj, yj, zj) and Tsurf a threshold that characterizes the intensity of the bladder close to its wall, the inflation force is defined as:
| (6) |
where r i is the unit radial vector at vertex i. j = 0 corresponds to the vertex i and j = 1, …, Ni to its Ni neighbors.
Internal forces aim at smoothing the mesh during deformation. The shape of the mesh is thus constrained avoiding the segmented surface leakage at weak edges. These forces represent the surface tension at each vertex i:
| (7) |
where eij = pi−pj is the edge vector connecting the adjacent vextices with coordinates pi and pj.
Damping forces ensure stability of dynamic behavior and prevent oscillations during deformation. They are proportional to the velocity:
| (8) |
with , a small negative constant.
In order to better control the inflation, weights are also adjusted according to the image intensity.
are defined so that a vertex located inside the bladder moves quickly but slows down when it gets closer to the bladder wall:
| (9) |
with Tin a threshold that represents the gray levels of the inner part of the bladder and are positive weights that satisfy . Thus, considering this definition and those of the inflation force (6) the displacement of a vertex will be more important if the number of its neighbors that satisfy the threshold criteria is large and its corresponding gray level is intense. On the contrary, a vertex whose intensity is weak and/or whose neighbors are already stopped will not keep on moving. This process also contributes to solve leakage issues.
and are adapted to stop the deformation of the surface in the areas where the vertices enter the bladder wall:
| (10) |
| (11) |
Indeed, the total force of a vertex whose intensity is less than Tsurf will be defined as:
| (12) |
and, according to (2), the velocity at the next iteration will become nil.
Thresholds and weights values will be deduced from a set of various qualities images and given in section III.
C. Resampling
The initial resolution of the ellipsoidal mesh may become insufficient depending on the size of the bladder. Indeed, the resolution must be fine enough to capture the shape variations. But, according to the definition of the inflation force (6), the area covered by a vertex and its neighbors must be large enough so the neighboring vertices can stop the current one in case of a local bad definition of the boundary.
Let denotes the edge vector oriented from the vertex (a, b) to the vertex (a, b+ 1). Given a parallel a, the average distance d̄a between its vertices is given by:
| (13) |
The average distance d̄b along a meridian b is computed in the same way. A good compromise in the resolution of the mesh was found by adapted regularly, when necessary, the number of parallels and/or meridians so that d̄ a= Ma/2 and d̄b =0 keep equal on average to 5 mm.
Because of the deformation of the mesh, the distance between vertices will change. The resolution may become locally smaller or bigger depending on the areas (Fig. 2 (a)). As the bladder may present local variations, the regularity of the sampling must be preserved to better delineate the organ. A process was thus applied to keep the distances between vertices homogeneous successively along parallels and meridians.
Fig. 2.
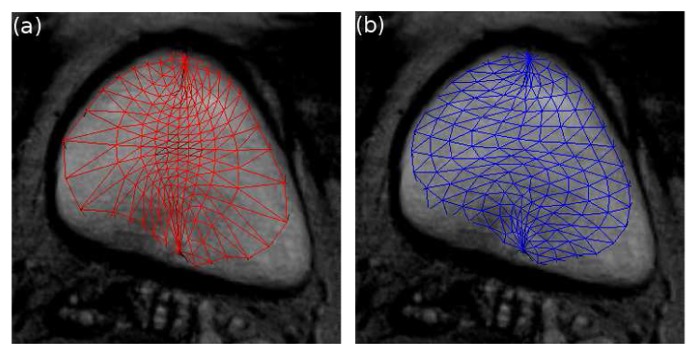
Resampling process at the 50th iteration: (a) before resampling, (b) after resampling.
First, the positions of the vertices are moved along the edge vectors of parallels a so that the distances between them are equal to d̄a in the way described on Fig. 3. Then, the accelerations and the velocities at new positions are obtained using a bilinear interpolation from the previous vertices locations. The same process is then applied along the meridians from the new vertices positions. The resulting mesh after resampling is illustrated on Fig. 2 (b).
Fig. 3.
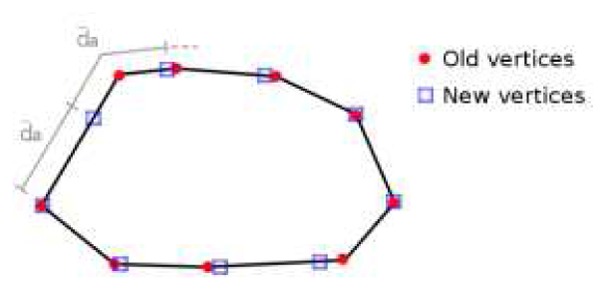
Resampling of a parallel a. The vertices are moved along the edge vectors to be spaced of d̄a.
III. MATERIALS AND RESULTS
The algorithm was tested on 33 T2 axial MRI volumes from 5 different devices. The MRI systems and volumes characteristics are summarized in Table I. MRI 3D images were interpolated along z before segmenting the bladder.
TABLE I.
MRI systems and volumes characteristics.
| MRI System | n | Size (voxel) | sa (mm) | st (mm) |
|---|---|---|---|---|
| 3T Philips Achieva | 10 | 720 ×720 ×20 | 0.416 | 4.001 |
| 3T Siemsens Vero | 5 | 320 ×320 ×20 | 0.625 | 3.600 |
| 1.5T Siemens Magnetom Symphony | 16 | 256 ×256 ×24 | 0.781 | 3.000 |
| 3T Philips Achieva | 1 | 352 ×352 ×24 | 0.540 | 2.630 |
| GE Signa HDxt | 1 | 512 ×512 ×16 | 0.391 | 4.500 |
n: number of volumes, sa: axial pixel size, st: transverse pixel size.
This work comes within the context of a segmentation with a coupled-model technique. Before segmenting the bladder, the prostate shape and position is approximately known. Thus, in this study, the initial point C inside the bladder is located automatically using geometrical (location of the bladder with respect to those of the prostate) and image (high intensity of the bladder) features.
The parameters of the deformable model were adjusted from the 33 MRI volumes. Given the different qualities of the MRI systems, the bladder wall definition varies from one volume to another. Also, the position of the bladder at the beginning of the volume and the thickness of the axial slices lead to strong partial volume effects. Thus, the bladder intensity can not be considered as really homogeneous. The weights and thresholds values defined in section II were adapted to take into account this heterogeneity. The chosen parameters values give good results on the whole set of data.
The intensity of the bladder decrease from its center to its boundary. The threshold Tin (9) characterizes the intensity of the inner part of the bladder except the region close to its wall. It must be high while taking into account the inhomogeneity of the gray levels. It was thus set to 0.8Iref. A value of Tsurf = 0.6Iref (Eqs. 5, 9–11) that represents the nearness of the bladder wall produces good segmentations.
A voxel whose gray level is higher than Tin have a great likelihood to belong to the bladder and can move quickly. and (9) allow to deform the mesh fast inside the bladder and to slow down progressively near its boundary. The internal forces must have a weight in the same level of magnitude but slightly larger than the one of the inflation force. Indeed, if an inflation force attempts to pass through the bladder wall because of a local bad definition of the boundary, the internal force must be strong enough to stop it. A value of 1.2 was thus chosen for (10). The weight (11) which is less sensitive [9] was set to −0.6.
The mass and the time step of the dynamic process (Eqs. 1)–(3) were set to mi = 1, Δt = 1 for simplicity.
Five examples of the resulting segmentations obtained with the proposed deformable model are displayed Fig. 4 with axial (X-Y), sagittal (Y-Z) and coronal (X-Z) sections (from left to right). White arrows indicate some areas where a region growing method would leak. Figs. 5 and 6 illustrate this issue on the same volumes than Figs. 4(a) and 4(b) respectively. The three slices on the top of Fig. 5 were obtained with a threshold equal to Iref. We observe that this value is insufficient to segment the whole bladder due to its heterogeneity. Decreasing the threshold to Tin (bottom of Fig. 5) helps to delineate the organ but also extracts a part of the surroundings and the inside of the prostate (indicated on Fig. 4(a) with a white arrow). Fig. 6 shows a result obtained with a threshold of Iref. Once again, only the half of the bladder is segmented and, even with this high threshold, a part of the surroundings is already included in the segmentation result.
Fig. 4.
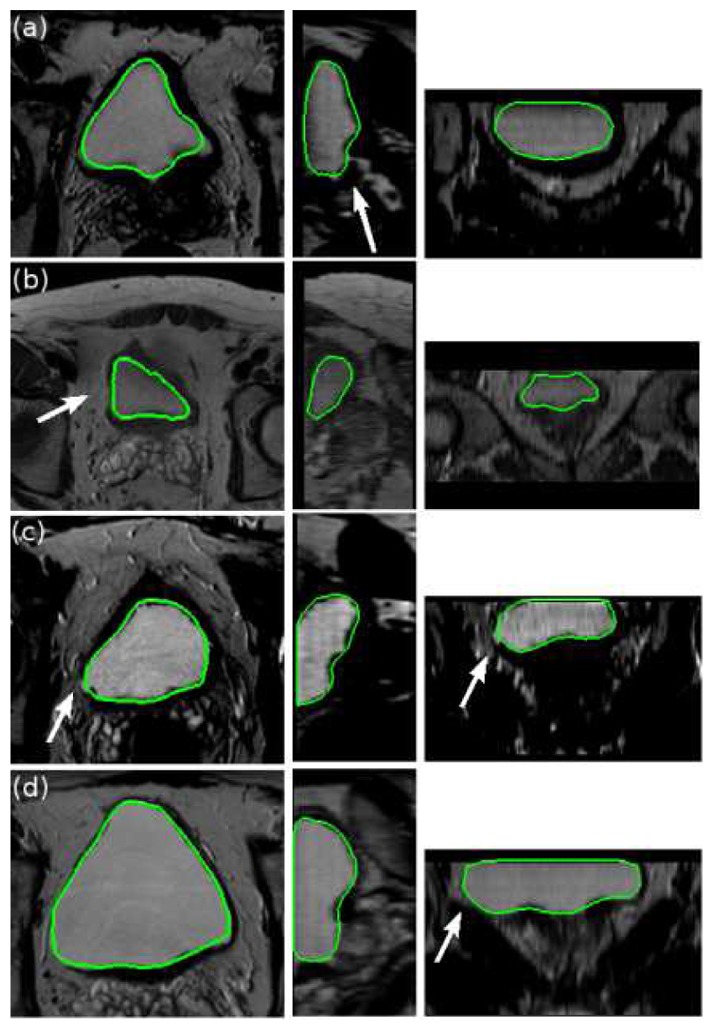
Five examples of segmentation results obtained with the proposed deformable model. From left to right: axial (X-Y), sagittal (Y-Z) and coronal (X-Z) sections. White arrows indicate some areas where a region growing method would leak.
Fig. 5.
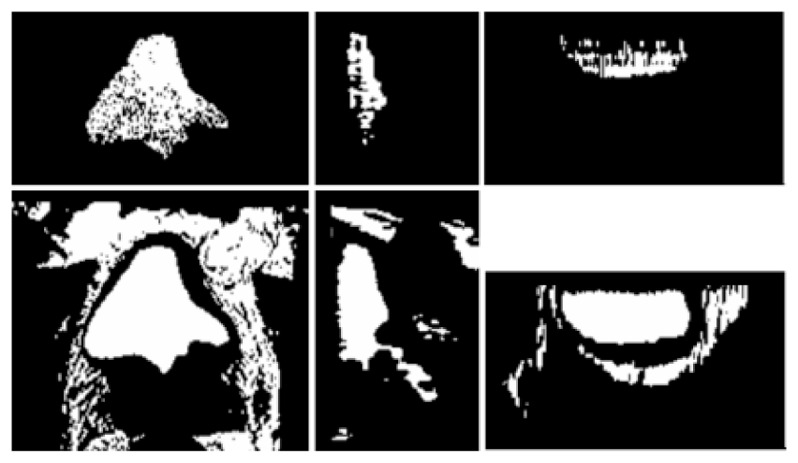
Segmentation obtained with a region growing method on the same volume than Fig. 4(a). The threshold is set to Iref at the top and Tin at the bottom. From left to right: axial (X-Y), sagittal (Y-Z) and coronal (X-Z) sections. Leakage can be observed, notably in the area indicated with a white arrow in Fig. 4(a).
Fig. 6.
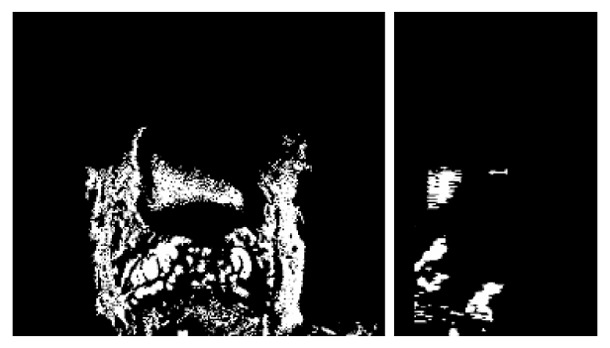
Segmentation obtained with a region growing method with a threshold of Iref on the same volume than Fig. 4(b). From left to right: axial (X-Y), and sagittal (Y-Z) sections.
The deformable model gives good results for all these critical cases. Even if in Fig. 4(a) a little part of the bladder is missing due to is thinness, the boundary close to the prostate is always well delineated. Besides, no leakage issue occurs in spite of the weakness of the bladder wall in some areas and of the similarity between the bladder and the background intensities. A good example is given on Fig. 4(d) where the wall is really thin and badly defined on a large area at the left bottom of the bladder. Even in this case, the surface stopped at the boundary.
Concerning the computational time, the segmentation process lasts 1 second on average and 3 second to the maximum on a 2.33 GHz Xeon PC.
IV. CONCLUSION
A fast and efficient 3D deformable model was proposed in this paper to segment the bladder in T2 MRI volumes. The algorithm was evaluated on 33 patients from different MRI devices and has shown good performance for all specimens. Without any pre- or post- processing, the method produces a smooth segmented surface. Besides, the adaptive definitions of forces and weights according to the intensity of the image help to solve the leakage issues that can occur with a region growing technique. The resulting surface can then be included in a coupled bladder-prostate segmentation method in order to constrain and improve the segmentation at the interface between the two organs.
Acknowledgments
The authors would like to thank E. Blanc and C. Vurpillot from EDAP-TMS, Pr. O. Rouvière from the Edouard Herriot hospital of Lyon and R. Mathieu from the Pontchaillou hospital of Rennes for providing the datasets.
This work is part of the French MULTIP project supported by an ANR Grant (ANR-09-TECS-011-06).
References
- 1.American Cancer Society. Cancer Facts and Figures. 2010. http://www.cancer.org.
- 2.European Cancer Observatory. http://eu-cancer.iarc.fr.
- 3.Costa M, Delingette H, Novellas S, Ayache N. Automatic Segmentation of Bladder and Prostate Using Coupled 3D Deformable Models. Proc MICCAI. 2007;4791:252–260. doi: 10.1007/978-3-540-75757-3_31. [DOI] [PubMed] [Google Scholar]
- 4.Song Q, Liu Y, Liu Y, Saha PK, Sonka M, Wu X. Graph search with appearance and shape information for 3-D prostate and bladder segmentation. Proc MICCAI. 2010;6363:172–180. doi: 10.1007/978-3-642-15711-0_22. [DOI] [PubMed] [Google Scholar]
- 5.Pasquier D, Lacornerie T, Vermandel M, Rousseau J, Lartigau E, Betrouni N. Automatic Segmentation of Pelvic Structures From Magnetic Resonance Images for Prostate Cancer Radiotherapy. Int J Radiat Oncol Biol Phys. 2007;68(2):592–600. doi: 10.1016/j.ijrobp.2007.02.005. [DOI] [PubMed] [Google Scholar]
- 6.Duan C, Liang Z, Bao S, Zhu H, Wang S, Zhang G, Chen JJ, Lu H. A Coupled Level Set Framework for Bladder Wall Segmentation with Application to MR Cystography. IEEE Trans Med Imag. 2010;29(3):903–915. doi: 10.1109/TMI.2009.2039756. [DOI] [PMC free article] [PubMed] [Google Scholar]
- 7.Lobregt S, Viergever MA. A discrete dynamic contour model. IEEE Trans Med Imag. 1995 Mar;14(1):12–24. doi: 10.1109/42.370398. [DOI] [PubMed] [Google Scholar]
- 8.Hu N, Downey DB, Fenster A, Ladak HM. Prostate boundary segmentation from 3D ultrasound images. Med Phys. 2003 Jul;30(7):1648–1659. doi: 10.1118/1.1586267. [DOI] [PubMed] [Google Scholar]
- 9.Ladak HM, Mao F, Wang Y, Downey DB, Steinman DA, Fenster A. Prostate boundary segmentation from 2D ultrasound images. Med Phys. 2000 Aug;27(8):1777–1788. doi: 10.1118/1.1286722. [DOI] [PubMed] [Google Scholar]


