Abstract
There is a huge variety in biological surfaces covered with micro- and nanostructures oriented at some angle to the supporting surface. Such structures, for example snake skin, burr-covered plant leaves, cleaning devices and many others cause mechanical anisotropy due to different friction or/and mechanical interlocking during sliding in contact with another surface in different directions. Such surfaces serve propulsion generation on the substrate (or within the substrate) for the purpose of locomotion or for transporting items. We have theoretically studied the dependence of anisotropic friction efficiency in these systems on (1) the slope of the surface structures, (2) rigidity of their joints, and (3) sliding speed. Based on the proposed model, we suggest the generalized optimal set of variables for maximizing functional efficiency of anisotropic systems of this type. Finally, we discuss the optimal set of such parameters from the perspective of biological systems.
Anisotropic surfaces are widespread in the non-biological world ranging from the molecular level1 to the macroscopic level. The crystal structure of solids leads to the anisotropy of their surfaces on an atomic level. In engineering, anisotropy of certain texture patterns of polycrystalline materials is produced naturally or artificially during manufacturing of the materials. Surface anisotropy manifests itself even on geological scales where, due to tectonics, a majority of structures have well developed anisotropy.
There is also a huge variety in biological surfaces covered with micro- and nanostructures oriented at some angle to the supporting surface2,3,4. Such structures cause mechanical anisotropy due to different friction or/and mechanical interlocking during sliding in contact with another surface in different directions. Such surfaces serve propulsion generation on the substrate (or within the substrate) for the purpose of locomotion or for transporting items. They have been previously described in a variety of mechanical systems belonging to different organisms ranging from the insect unguitractor plate5,6,7,8,9, interlocking mechanisms of joints in insect legs and antennae3, insect ovipositor valvulae3,10,11,12,13, animal attachment pads14,15,16,17,18,19,20, inner surface of pitcher plants19,20,21,22, wheat awns23, fluids-guiding systems of plants24, butterfly wings25, etc.
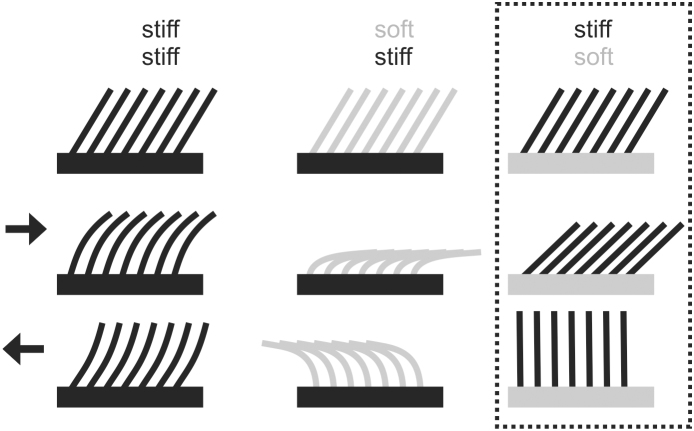
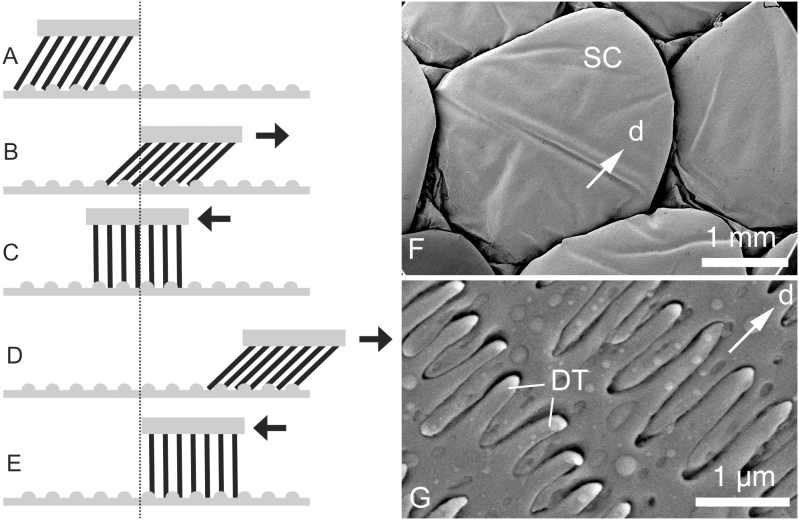
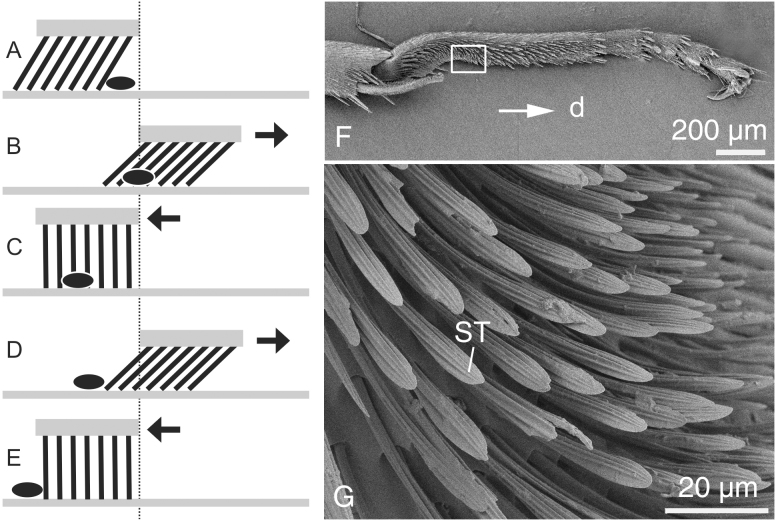
The surface outgrowths, their joints to the supporting layer, and the supporting layer itself in most anisotropic surfaces in biology are rather rigid and rely on the ratchet principle in their mechanical behavior. However, some systems exhibit pronounced flexibility of surface structures due to the flexible material of the supporting layer or due to a specialized flexible joint connecting to the rigid supporting layer. A typical macroscale system of this kind is the snake skin consisting of rather stiff scales26 embedded in a rather flexible supporting layer (Fig. 1). Preferred orientation of both scales themselves and surface microstructures has been discussed to be the key features responsible for the frictional anisotropy in this particular system27,28,29,30 (Fig. 2F). In addition, there is a microstructure at the level of the scale with strongly anisotropic orientation, which has been recently demonstrated to provide frictional anisotropy of the snake skin29,40 (Fig. 2G). Also shark skin exhibits a similar arrangement of stiff surface denticles embedded in a flexible collagenous supportive layer31. Another example has been reported from the burr-covered Galium aparine plant leaves/stems/fruits32, where burrs are connected to the supporting layer with a flexible joint33. Cleaning devices of insects consist of rigid setae connected to the surface also with flexible joints34,35,36 (Fig. 3).
Figure 1. Diagram of ratchet-like frictional anisotropic systems.
First column, stiff protuberances on a stiff supporting layer. Second column, soft protuberances on a stiff supporting layer. Third column, stiff protuberances on a soft supporting layer. The third (framed) column indicates the system considered in the present study. First row, systems in non-deformed state. Second row, deformation caused by sliding in the direction of the protuberance slope. Third row, deformation caused by sliding in the direction opposite to the protuberance slope.
Figure 2. System that assists body propulsion for locomotion.
(A–E). Diagram showing how the soft-embedded sloped stiff array of protuberances can generate propulsion due to the opposite movements along a non-smooth substrate. (F, G). Lateral scales of the snake Python regius at different magnifications in the scanning electron microscope (SEM). d, direction toward the tail (caudal); DT, denticulations; SC, scales.
Figure 3. System that generates particle movement for cleaning.
(A–E). Diagram showing how the soft-embedded sloped stiff array of protuberances can generate unidirectional particle motion due to opposite movements along a substrate. (F, G). Foreleg of the ant Formica polyctena with a specialized cleaning device at different magnifications in SEM. d, distal direction; ST, setae.
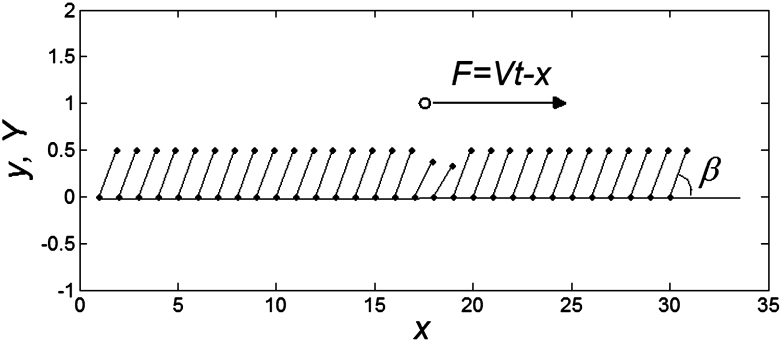
These numerous examples have a wide range of functions from the transport of particles (cleaning devices), the leaf positioning on the top of another leaf to the propulsion generation during slithering locomotion (snake). Since the rigidity of the support must have an influence on the mechanical behavior of these systems (as recently was shown for the snake skin40), we have developed, in this paper, a model aiming at the study of their mechanical behavior (Fig. 4). We studied the dependence of the anisotropic friction efficiency on (1) the slope of the surface structures, (2) rigidity of their joints, and (3) sliding speed. Based on the proposed model, we suggest the generalized optimal set of variables for maximizing functional efficiency of anisotropic systems of this type. Finally, we discuss the optimal combination of such parameters from the perspective of biological systems.
Figure 4. Conceptual diagram of the model.
The motion of the system is determined by Eq. (1) at equal damping constants  , fixed elasticity
  of external spring and interaction
  between the probe and hairs. Two other parameters: external velocity
  and rigidity against rotations
  remain varied.
Results
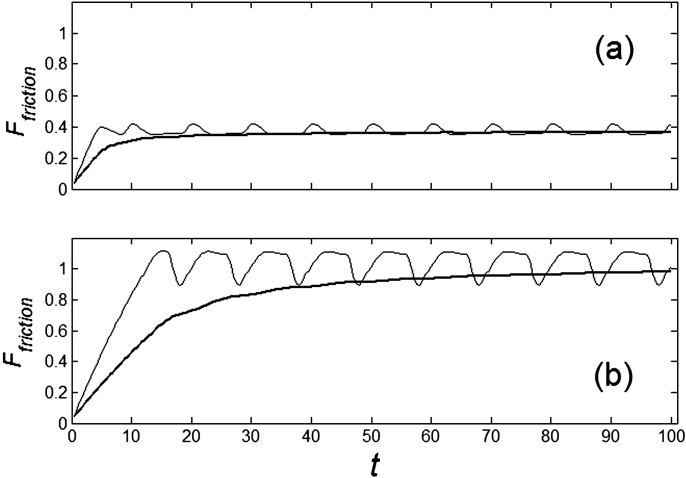
Typical time-dependencies of the friction force  at positive V > 0 and negative V < 0 velocities are presented in the subplots (a) and (b) of Fig. 5, respectively. Bold lines in both cases show mean friction force
 |
accumulated from starting moment t = 0 to a current time t. Mean force  averaged during sufficiently long time runs can be used to characterize the difference in system properties at varied elasticity
  and velocities
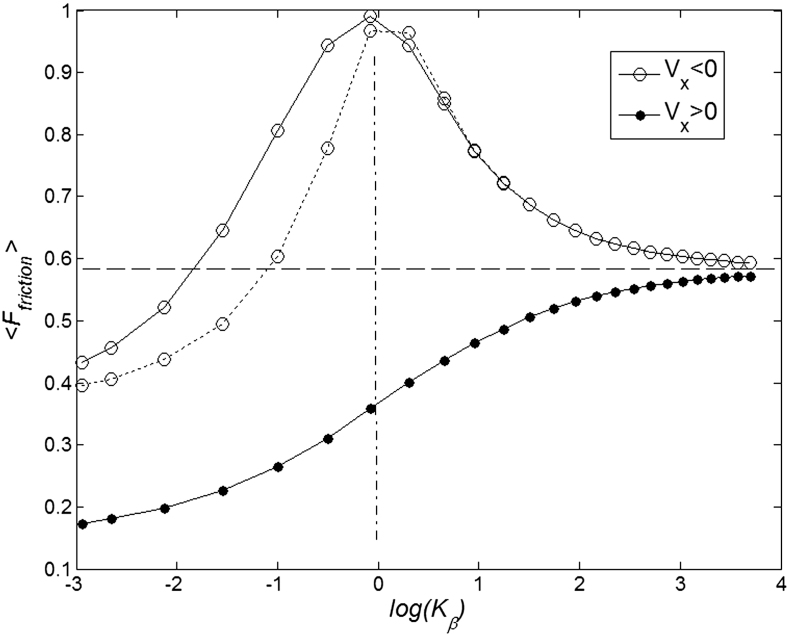
  . Results of numerical simulations performed at
  and varied
  are presented in Fig. 6, where
  is shown in an interval of a few orders of amplitude
  . A wide interval of
  , where the system demonstrates strong anisotropy of the friction, is clearly seen. The optimal value of
  is marked by a dash-dotted line. At a given set of the parameters it is around
  .
.
Figure 5. Typical time dependencies of the friction force for positive  (a) and negative
  (b) velocities.
Bold lines in both cases show mean friction force (Ffriction) averaged starting from  to a current moment of time
  . The parameters are the same as in Fig. 4.
Figure 6. Mean friction forces for fixed positive and negative velocities  accumulated for a few orders of the absolute value
  .
.
Optimal elasticity around at  , which corresponds to the maximal anisotropy of motion, is marked by dash-dotted line. To compare two variants of the model, numerical simulations with
  also was performed (dotted curve).
It is important to note that the model is robust against particular choice of the elastic force  . This force was chosen above as the linear function
  , partially because we believe that this force monotonously increases with the deviation of the angle
  from its equilibrium value, partially because to the moment we do not know its correct real dependence. An alternative choice could be
  which reflects the fact that distortions of the skin
 which tends as effective springs prevent a rotation of the fibers is proportional to the cosine:
  . Corresponding force
  degenerates into linear one
  at small deviations
  . The results obtained in this variant of the model must coincide with the linear one in this limit. Stronger difference is expected in principle for large deviations, which can appear at negative velocities
 and weak elastic constant
  , when external force is able to rotate fibers strongly. However, in this limit
  also becomes nonrealistic too, because the force
  must grow monotonously at large deviations.
To compare two variants of the model, we performed numerical simulations with  also. The results are shown in Fig. 6 by dotted curve. As expected, a deviation is observable only for a combination of negative velocity
  and weak elastic constant
  . For stronger
  and for all positive velocities
  two variants almost perfectly coincide (for positive
  the difference is practically invisible in the figure). Let us account also, that majority of the results below will be obtained for the elastic constant close to the optimal value
  . It allows limiting ourselves by the simplest linear model
  . It is also important to admit that the present basic minimalistic model leaves outside the consideration of many important parameters, such as density and geometry of the stiff fibers, their length, thickness, etc, which may also affect the results. All these questions remain open for more specific further studies of concrete biological systems. The main advantage of the present model is in its simplicity and transparency both allowing considering the importance of the flexibility of structures for tuning of frictional anisotropy.
It is interesting also to study the inverse problem and apply friction anisotropy (which is, in fact, caused by real anisotropy of the interaction between the substrate and probe) to produce a directed drift of a “cargo”. To do this, let us put the probe on the top of the substrate and perform periodic oscillations of the substrate. One can check numerically that anisotropy of interaction really leads to a directed motion. We found directed drift even when a gently colored random noise of fluctuations with slightly preferable frequency  instead of strictly periodic oscillations is applied. Such sustainability against perturbations, and even ability of the system to produce directed motion at weakly pronounced preferences, must be extremely important for the biological applications of the effect. However, for the goals of this paper, below we limit ourselves to the strictly periodic oscillations with unique frequency
  .
.
The numerical experiment in this case is as follows. We use the same Eq.(1), but change the external force to zero  . Instead, we move the substrate periodically and find out how the probe position changes during a sufficiently long run. Appearance of the directed drift is characterized by a non-zero mean velocity
  :
:
 |
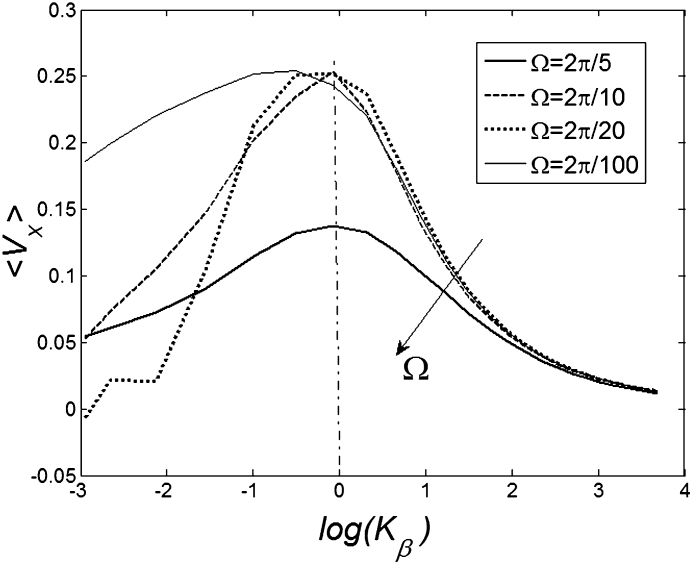
Figure 7 shows a dependence of mean drift velocity  on the
  elastic constant at some representative frequencies
  . The larger
  , the more pronounced the effect appears. Dot-dashed line in the figure corresponds to the optimal elasticity
  . At high frequencies curves
  start to shift down monotonously. We do not show directly all the curves in order not to overload the figure. Instead, the direction of the shift is qualitatively marked by an arrow. One can collect optimal values of the drift velocity, found on each curve near
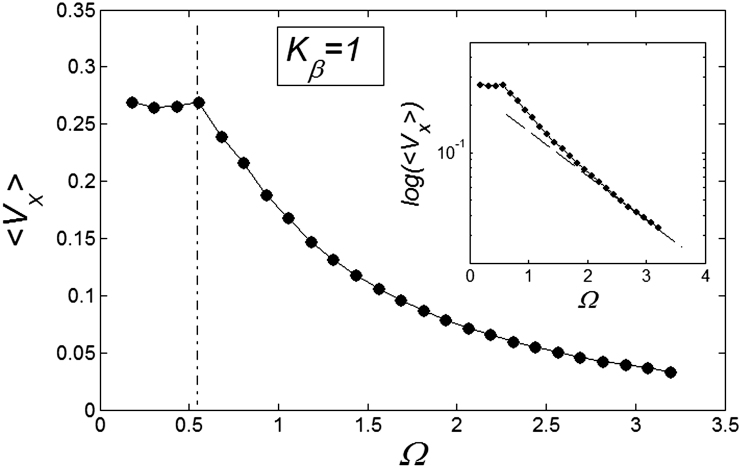
  , and plot them as a function of
  . This is done in Fig. 8. Starting from a frequency slightly higher than
  (around
  shown in Fig. 7) marked by a dash-dotted line, the drift exponentially goes down, especially at
  . This exponential decay is clearly confirmed by the logarithmic plot in the insert to Fig. 8. At low frequencies
  drift velocity is almost constant. It means that at small frequencies
  the probe always has enough time to be captured by the substrate motion and tends to move much more strongly in one preferred direction. From the practical point of view, one has also to count the time which every cycle of the motion lasts. This period is inversely proportional to the frequency
  and becomes very long for the extremely small
  . So, from the biological point of view, one can observe that frequency near the bending point (marked by the dash-dotted line) is an optimal case.
Figure 7. Dependence of mean drift velocity  on the elasticity of the surface
  calculated for some representative frequencies
  .
.
Dot-dashed line corresponds to optimal elasticity  , at which the drift velocity is maximal. The arrow qualitatively marks monotonous shift of the curves
  at frequencies higher than
  . Most of these curves (excluding one example for
  ) are not shown here to do not overload the figure.
Figure 8. Frequency dependence of drift velocity  calculated at fixed optimal elasticity
  .
.
Logarithmic plot (inset) confirms an exponential decay of the drift velocity  at high
  .
.
Discussion
The surprising not-trivial result of the study of the proposed model is that the degree of anisotropy, which is defined here as the relationship between forces, resisting sliding motion in both directions, is strongly dependent on the stiffness of the joints between individual sloped protuberances (hairs) and their supporting layer. Quite unexpectedly, the anisotropy is maximal at an intermediate stiffness of joints. Presumably, this is the reason why frictional systems, based on softly-embedded stiff sloped hairs, occur widely in biological mechanical devices dealing with propulsion/locomotion or transport of items/particles.
Another important conclusion from studying the model is that the degree of anisotropy depends on the frequency/velocity of sliding movements. There is a frequency at which the cumulative directed displacement, caused by oscillations in opposite directions, is maximal. The use of such a frequency in combination with particular stiffness of joints leads to an enhancement of the propulsive/carrying performance to several orders of magnitude.
One may assume that in biological evolution both oscillation frequency and joint stiffness were two important variables for the optimization of concrete mechanical systems. Performance of the systems requiring particular oscillating frequency for their proper functioning due to some other reasons, such as characteristic velocity of the muscle contraction, might be tuned to an optimum due to tuning of mechanical properties of hair joints. On the other hand, systems with constant mechanical properties of the joints might adapt their performance by tuning their specific oscillating frequency within the range of mathematically available frequencies. An optimal stiffness of joints is presumably comparable to specific forces at which the mechanical system usually operates. Stiff joints will not improve the performance at very low operating forces and, vice versa, soft joints will not maintain strong frictional anisotropy at very high forces.
Some biological anisotropic systems, such as snake skin, have an even higher degree of hierarchical organization of anisotropically-oriented structures (scales, denticulations) that may allow an additional optimization of anisotropic frictional behavior at different macro- and microscopic levels of organization.
A very interesting observation of the behavior of the proposed model is that in the “cargo”-transporting devices, the transporting function completely fails at a certain minimal oscillating frequency. Nevertheless, both types of systems may properly operate at quite a wide range of joint stiffness and sliding velocities, which in biological evolution might be under the control of selective pressure. The model demonstrates an entire mathematical range of mechanical properties in combination with oscillating frequencies. However, in biological systems, spectra of these variables must be much narrower, because of limitations caused by specific biological factors. For example, biological systems cannot be too slow, if only because of the fact that a too long transport duration, even in an effective transporting process, might be too long compared with some specific physiological processes within a living organism or even compared with an organism's length of life. On the other hand, the oscillating frequency cannot be too high, since the effectiveness of transport will decrease. Typical frequencies of sliding in various biological systems are in the range of 0.5–25 Hz and sliding velocity 0.01–50 m/s, and mutual relations between them are well within the range of the optimum predicted by the model.
Recently, biologically-inspired systems with anisotropic frictional properties have been developed39. We believe that our model might aid in the further optimization of such systems for technological purposes. The verification of the model in different biological systems is not a simple task and it is currently in progress. Some preliminary results, showing the influence of the flexibility of supporting tissues on the degree of frictional anisotropy, are recently published40. However, the verification of the model requires much broader range of parameters than that used in the above mentioned paper.
Methods
The present model explains the behavior of two different classes of mechanical functions of anisotropic surfaces with soft-embedded surface protuberances: propulsion/locomotion and transport of items/particles. In such systems, the interaction between the tips of protuberances and the substrate asperities or particles during a sliding motion effects the non-symmetric resistance of the anisotropic surface depending on (1) the direction of the movement and (2) orientation of hairs. However, this result is obvious and would be similar for other types of anisotropic surfaces with stiff or soft hairs embedded in the stiff matrix.
To construct a numerical model of the stiff hairs embedded in the soft matrix, we considered a simple configuration of the probe body connected to the spring, driven at fixed velocity V and interacting with 1-dimensional periodic array of stiff “hairs”. The probe interacts with nearest hair with a force depending on an inclination angle of the hair to the substrate plane:
  . This force has a maximum
  for the hair standing perpendicular to the surface and
  at
at  . A conceptual picture of the model is presented in Fig. 4. In real system, interaction between the probe and hair in horizontal orientation is much smaller than at nonzero angles
  . Below, for the simplicity of the basic model, we will neglect this impact to the interaction and suppose that
  at
at  .
.
At any moment of time  instant orientation of each hair depends on the relation between its place in the array
  ,
,  and current position of the probe
  . Normally the hair tends to keep angle
  close to its equilibrium
  by an elastic force
  . In biological structures, typical Kelastic is in the range of 1–100 μN/rad. Instant inclination angle
  is dynamically determined by a balance between pressure of the probe
  and elastic force
  . In turn, the probe detects a reaction of the hair
  and is driven by the external force
  . As a result one gets the following model equations:
 |
Here it is supposed that rotation of the hair inside a viscous substrate is strongly over-damped and material properties of the substrate are completely described by elastic  and damping
  constants. The value of damping
  of the substrate defines the characteristic time scale of the process and may be experimentally restored for a particular system. To study general properties of the model below, it is convenient to measure time in the units of
  and take
  . Preliminary study of the model shows that clearest manifestation of the friction anisotropy appears when damping of the external device is comparable to the internal one
  and for the external elastic force
  at typical elongation
  close to one period of the structure
  also comparable to the maximum
  of interaction between the probe and hairs
  . Period of real structures in different biological systems has a wide range of dimensions (from 1 to 1000 μm), but typically 1–10 μm. So our unit of length corresponds to 1–10 μm. Below, for the sake of clarity, we will take that
  and characterize the system by the remaining free parameters: relative elasticity
  and external velocity
  . The system of differential equations is simple enough to be easily solved numerically using any standard package of mathematical programs. In particular, we used MatLab program and applied time step
  , which is small enough to get stable behavior at the entire interval of variations of both parameters
  and
and  .
.
Even before numerical solution one can intuitively predict that in the limiting case of extremely rigid  and extremely soft
  systems, the probe actually interacts either with almost fixed periodic substrate potential or with a practically flat surface, where the hair easily lays down under the influence of the external body sliding along the hair array. In both cases, the probe effectively interacts with static potential. Incline angle
  may still make friction anisotropy possible, but one can expect that friction force weakly depends on the direction of motion and its values are very similar at positive
  and negative
  velocities. Another situation appears at some intermediate constant
  , when the probe, moving against the inclination of the hairs
  , mounts them almost vertically, provoking strong resistance to the motion. In this case, resistance should essentially differ for two directions of motion. From the mathematical point of view it is an example of the movable systems providing directed transport due to anisotropic organization of the motion37,38.
Author Contributions
Both authors have equally contributed to the manuscript.
Supplementary Material
Snake_1_1.avi
Snake_1_2.avi
Snake_1_3.avi
Snake_1_4.avi
Snake_2_1.avi
Snake_2_2.avi
Acknowledgments
We thank V. Kastner for linguistic correction of the manuscript. This work was supported by the SPP 1420 priority program of the German Science Foundation (DFG) ‘Biomimetic Materials Research: Functionality by Hierarchical Structuring of Materials' (project GO 995/9) to S.N.G.
References
- Liley M. et al. Friction anisotropy and asymmetry of a compliant monolayer induced by a small molecular tilt. Science 280, 273–275 (1998). [DOI] [PubMed] [Google Scholar]
- Nachtigall W. Biological Mechanisms of Attachment. Berlin, Heidelberg, New York: Springer-Verlag (1974). [Google Scholar]
- Gorb S. N. Attachment Devices of Insect Cuticle. Kluwer Academic Publishers (2001). [Google Scholar]
- Scherge M. & Gorb S. N. Biological Micro- and Nanotribology. Berlin, Heidelberg, New York, Springer (2001). [Google Scholar]
- Dashman T. The unguitractor plate as a taxonjomic tool in the Hemiptera. Ann. Entomol. Soc. Am. 46, 561–578 (1953). [Google Scholar]
- Goel S. C. Notes on the structure of the unguitractor plate in Heteroptera (Hemiptera). J. Entomol. 46, 167–173 (1972). [Google Scholar]
- Conde-Boytel R., Erickson E. H. & Carlson S. D. Scanning electron microscopy of the honeybee, Apis mellifera L.(Hymenoptera: Apidae) pretarsus. Int. J. Insect Morphol. Embryol. 18, 59–69 (1989). [Google Scholar]
- Seifert P. & Heinzeller T. Mechanical, sensory and glandular structures in the tarsal unguitractor apparatus of Chironomus riparius (Diptera, Chironomidae). Zoomorphology 109, 71–78 (1989). [Google Scholar]
- Gorb S. N. Design of insect unguitractor apparatus. J. Morphol. 230, 219–230 (1996). [DOI] [PubMed] [Google Scholar]
- Müller H. J. Über Bau und Funktion des Legeapparates der Zikaden (Homoptera Cicadina). Z. Morphol. Ökol. Tiere 38, 534–629 (1941). [Google Scholar]
- Smith E. L. Biosystematics and morphology of Symphyta. 3. External genitalia of Euura. Int. J. Insect Morphol. Embryol. 1, 321–365 (1972). [Google Scholar]
- Mickoleit G. Über den Ovipositor der Neuropteroidea und Coleoptera und seine phylogenetische Bedeutung (Insecta, Holometabola). Z. Morphol. Tiere 74, 37–64 (1973). [Google Scholar]
- Austin A. D. & Browning T. O. A mechanism for movement of eggs along insect ovipositors. Int. J. Insect Morphol. Embryol. 10, 93–108 (1981). [Google Scholar]
- Autumn K. et al. Adhesive force of a single gecko foot-hair. Nature 405, 681–685 (2000). [DOI] [PubMed] [Google Scholar]
- Gorb S. N. & Scherge M. Biological microtribology: anisotropy in frictional forces of orthopteran attachment pads reflects the ultrastructure of a highly deformable material. Proc. Roy. Soc. London B 267, 1239–1244 (2000). [DOI] [PMC free article] [PubMed] [Google Scholar]
- Huber G., Gorb S. N. Spolenak R. & Arzt E. Resolving the nanoscale adhesion of individual gecko spatulae by atomic force microscopy. Biol. Lett. 1, 2–4 (2005). [DOI] [PMC free article] [PubMed] [Google Scholar]
- Niederegger S. & Gorb S. N. Friction and adhesion in the tarsal and metatarsal scopulae of spiders. J. Comp. Physiol. A 192, 1223–1232 (2006). [DOI] [PubMed] [Google Scholar]
- Gorb S. N., Sinha M., Peressadko A., Daltorio K. A. & Quinn R. D Insects did it first: a micropatterned adhesive tape for robotic applications. Bioinsp. Biomim. 2, S117–S125 (2007). [DOI] [PubMed] [Google Scholar]
- Bohn H. F. & Federle W. Insect aquaplaning: Nepenthes pitcher plants capture prey with the peristome, a fully wettable water-lubricated anisotropic surface. Proc. Natl. Acad. Sci. USA 101, 14138–14143 (2004). [DOI] [PMC free article] [PubMed] [Google Scholar]
- Clemente C. J., Dirks J.-H., Barbero D. R., Steiner U. & Federle W. Friction ridges in cockroach climbing pads: anisotropy of shear stress measured on transparent, microstructured substrates. J. Comp. Physiol. A 195, 805–814 (2009). [DOI] [PubMed] [Google Scholar]
- Gorb E. V. & Gorb S. N. Functional surfaces in the pitcher of the carnivorous plant Nepenthes alata: A cryo-SEM approach. In Gorb S. N. ed. Functional surfaces in biology: Adhesion related systems, Vol. 2, 205–238 (2009). [Google Scholar]
- Gorb E. V. & Gorb S. N. The effect of surface anisotropy in the slippery zone of Nepenthes alata pitchers on beetle attachment. Beilstein J. Nanotechnol. 2, 302–310 (2011). [DOI] [PMC free article] [PubMed] [Google Scholar]
- Elbaum R., Zaltzman L., Burgert I. & Fratzl P. The role of wheat awns in the seed dispersal unit. Science 316, 884–886 (2007). [DOI] [PubMed] [Google Scholar]
- Roth-Nebelsick A. et al. Leaf surface structures enable the endemic Namib desert grass Stipagrostis sabulicola to irrigate itself with fog water. J. R. Soc. Interface 10.1098/rsif.2011.0847 (2012). [DOI] [PMC free article] [PubMed] [Google Scholar]
- Zheng Y., Gao X. & Jiang L. Directional adhesion of superhydrophobic butterfly wings. Soft Matter 3, 178–182 (2007). [DOI] [PubMed] [Google Scholar]
- Klein M.-C. G., Deuschle J. K. & Gorb S. N. Material properties of the skin of the Kenyan sandboa Gongylophis colubrinus (Squamata, Boidae). J. Comp. Physiol. A 196, 659–668 (2010). [DOI] [PubMed] [Google Scholar]
- Hazel J., Stone M., Grace M. S. & Tsukruk V. V. Nanoscale design of snake skin for reptation locomotions via friction anisotropy. J. Biomech. 32, 477–484 (1999). [DOI] [PubMed] [Google Scholar]
- Niitsuma K., Miyagawa S. & Osaki S. Mechanical anisotropy in cobra skin is related to body movement. Europ. J. Morph. 42, 193–200 (2005). [DOI] [PubMed] [Google Scholar]
- Berthé R., Westhoff G., Bleckmann H. & Gorb S. N. Surface structure and frictional properties of the skin of the Amazon tree boa Corallus hortulanus (Squamata, Boidae). J. Comp. Physiol. A 195, 311–318 (2009). [DOI] [PMC free article] [PubMed] [Google Scholar]
- Hu D. L., Nirody J., Scott T. & Shelley M. J. The mechanics of slithering locomotion. Proc. Natl. Acad. Sci. USA 106, 10081–10085 (2009). [DOI] [PMC free article] [PubMed] [Google Scholar]
- Reif W.-E. & Dinkelacker A. Hydrodynamics of the squamation in fast swimming sharks. Neues Jahrb. Geol. Paläontol. 164, 184–187 (1982). [Google Scholar]
- Bauer G. et al. Always on the bright side: the climbing mechanism of Galium aparine. Proc. R. Soc. B doi: 10.1098/rspb.2010.2038 (2010). [DOI] [PMC free article] [PubMed] [Google Scholar]
- Gorb E. V. & Gorb S. N. Contact separation force of the fruit burrs in four plant species adapted to dispersal by mechanical interlocking. Plant Physiol. Biochem. 40, 373–381 (2002). [Google Scholar]
- Schönitzer K. Comparative morphology of the antenna cleaner in bees (Apoidea). Z. Zool. Syst. Evolutionsforsch. 24, 35–51 (1986). [Google Scholar]
- Schönitzer K. & Lawitzky G. A phylogenetic study of the antenna cleaner in Formicidae, Mutillidae and Tiphiidae (Insecta, Hymenoptera). Zoomorphology 107, 273–285 (1987). [Google Scholar]
- Schönitzer K. & Penner M. The function of the antenna cleaner of the honeybee (Apis mellifica). Apidologie 15, 23–32 (1984). [Google Scholar]
- Filippov A. E. & Popov V. Directed molecular transport in an oscillating channel with randomness. Phys. Rev. E 77, N 211114 (2008). [DOI] [PubMed] [Google Scholar]
- Fleishman D., Filippov A. E. & Urbakh M. Directed molecular transport in an oscillating symmetric channel. Phys. Rev. E 69, N 011908 (2004). [DOI] [PubMed] [Google Scholar]
- Murphy M. P., Aksak B. & Sitti M. Adhesion and anisotropic friction enhancements of angled heterogeneous micro-fiber arrays with spherical and spatula tips. J. Adhesion Sci. Technol. 21, 1281–1296 (2007). [Google Scholar]
- Benz M. J., Kovalev A. E. & Gorb S. N. Anisotropic frictional properties in snakes. In: Bioinspiration, Biomimetics, and Bioreplication 2012, eds. Lakhtakia, A. & Martín-Palma, R. J., Proc. of SPIE, vol. 8339, doi: 10.1117/12.916972 (2012). [Google Scholar]
Associated Data
This section collects any data citations, data availability statements, or supplementary materials included in this article.
Supplementary Materials
Snake_1_1.avi
Snake_1_2.avi
Snake_1_3.avi
Snake_1_4.avi
Snake_2_1.avi
Snake_2_2.avi


