Abstract
Bile reflux is a risk factor in the development of intestinal metaplasia in the stomach and is believed to function as an initiator of gastric carcinogenesis. However, whether the G protein-coupled bile acid receptor TGR5 is expressed in this tumor is not known. In this study, we determined the expression of TGR5 in gastric adenocarcinoma and examined the role of TGR5 in cell proliferation. Strong TGR5 staining was present in 12% of cases of intestinal metaplasia but in no cases of normal gastric epithelium (P < 0.01). Moderate to strong TGR5 membranous and cytoplasmic staining was present in 52% of the intestinal but in only 25% of the diffuse subtype of adenocarcinomas (P < 0.001). Kaplan-Meier univariate survival analysis revealed that moderate to strong TGR5 staining was associated with decreased patient survival (P < 0.05). Treatment with taurodeoxycholic acid (TDCA, a bile acid) significantly increased thymidine incorporation in the AGS gastric adenocarcinoma cell line, suggesting that bile acids may increase cell proliferation. This increase was significantly decreased by knockdown of TGR5 with TGR5 small-interfering RNA (siRNA). In addition, overexpression of TGR5 significantly enhanced TDCA-induced increases in thymidine incorporation. TGR5 is coupled with Gqα and Gαi-3 proteins. TDCA-induced increase in thymidine incorporation was significantly decreased by knockdown of Gqα and Gαi-3 with their siRNAs. We conclude that TGR5 is overexpressed in most gastric intestinal-type adenocarcinomas, and moderate to strong TGR5 staining is associated with decreased patient survival in all gastric adenocarcinomas. Bile acids increase cell proliferation via activation of TGR5 receptors and Gqα and Gαi-3 proteins.
Keywords: TGR5, gastric adenocarcinoma, bile acid
gastric cancer is one of the most common cancers in the world, causing 650,000 deaths annually (14) and accounting for about 10% of new cancers (8, 16). Gastric cancer has two histological types, diffuse and intestinal (18). Intestinal metaplasia is a premalignant condition in the stomach related to chronic inflammation and atrophic gastritis (22). Gastric carcinogenesis is a complex process and not fully understood. Helicobacter pylori infection is known to be the strongest risk factor for the development of this neoplasm (20). However, H. pylori eradication does not completely prevent gastric cancer, and it might be useful only in patients without atrophic gastritis or intestinal metaplasia at baseline (4). Duodenal reflux through the pylorus has been reported to induce gastric adenocarcinoma in rats, suggesting that duodenal juice, including bile acids, may be a risk factor for development of gastric adenocarcinoma (15).
Recently, a cell membrane bile acid receptor, TGR5 (a G protein-coupled receptor), has been shown to be important in bile acid-regulated lipid metabolism, energy homeostasis, and glucose metabolism (7, 11, 19). Whether the TGR5 receptor is expressed in the stomach and whether it mediates bile acid-induced increases in cell proliferation are not known. In this study, we show that the TGR5 receptor is present in metaplastic and neoplastic gastric epithelial cells, is coupled with Gq and Gi-3 proteins, and mediates bile acid taurodeoxycholic acid (TDCA)-induced increases in cell proliferation. In addition, moderate to strong TGR5 expression by gastric adenocarcinoma cells is associated with decreased patient survival.
MATERIALS AND METHODS
Patients and specimens.
Archival cases of distal gastric cancer from 171 patients (86 intestinal and 85 diffuse subtypes) were collected between the years of 1992 and 2004 from the archives of the Department of Pathology at the Rhode Island Hospital (RIH). Proximal (cardia) cancers were excluded. Stage was defined according to American Joint Committee on Cancer criteria (1). Recurrence and survival data were ascertained through the Rhode Island Tumor Registry and RIH chart review. This study was approved by the Institutional Review Board at the RIH. All tissue samples were formalin-fixed and paraffin-embedded. The corresponding hematoxylin-eosin slides were reviewed for confirmation of diagnosis and adequacy of material by Dr. M. Resnick. The detailed clinicopathological features of the study population are given in Table 1.
Table 1.
Clinicopathological features of the study group
| Diffuse Type | Intestinal Type | P Value | |
|---|---|---|---|
| No. | 85 (49.7) | 86 (50.3) | |
| Age | |||
| Range, yr | 29–91 | 41–96 | >0.05 |
| Median, yr | 75 | 74 | |
| Sex | |||
| Male, % | 54 | 47 | 0.396 |
| Female, % | 46 | 53 | |
| Stage, % | |||
| I | 19.5 | 34.5 | 0.170 |
| II | 28.6 | 25.9 | |
| III | 27.3 | 15.5 | |
| IV | 24.7 | 24.1 | |
| Median survival, mo | 17 | 30 |
There were 171 patients in the study group. Percentages are in parentheses.
Tissue microarray construction.
Paraffin blocks containing areas consisting of invasive carcinoma were identified on corresponding hematoxylin- and eosin-stained sections. Areas of interest that represented the “invasive front” of the tumor, rich in nonnecrotic tumoral glands, were identified and marked on the source block. The source block was cored, and a 1-mm core was transferred to the recipient “master block” using the Beecher Tissue Microarrayer (Beecher Instruments, Silver Spring, MD). Three to six cores of tumor were arrayed per specimen. In addition, a core of normal adjacent gastric mucosa and areas of intestinal metaplasia were also sampled when present.
Immunohistochemistry.
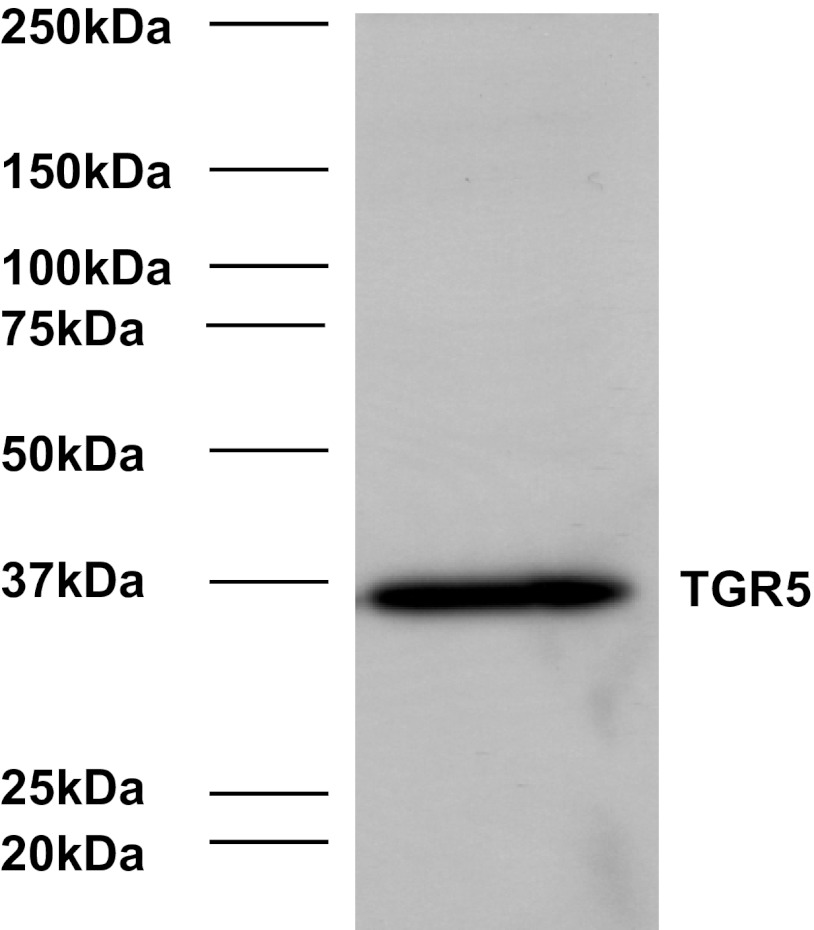
Immunohistochemistry for TGR5 was performed on 4-μm paraffin sections of each gastric cancer tissue microarray section described above. Slides were stained with TGR5 antibody (1:1,000; Sigma-Aldrich, St. Louis, MO) using the DAKO Envision + Dual Link System and the DAKO Liquid 3,3′-Diaminobenzidine Substrate Chromagen System (DAKO North America, Carpinteria, CA). Bile ducts from liver tissue were used as positive controls. Negative controls included replacement of the primary antibody with nonreacting antibodies of the same species. The specificity of TGR5 antibody was shown in Fig. 1 by Western blot analysis.
Fig. 1.
Representative image of Western blot analysis with TGR5 antibody in AGS cells.
Immunohistochemistry assessment.
Cancers (and nonneoplastic mucosa) that displayed a strong, well-localized, staining pattern for TGR5 were scored as +3, moderately intense staining as +2, and weak staining as +1. The extent of staining (percentage of cells staining) was scored as follows: 1+ 1–10%, 2+ 11–50%, 3+ 51–100%. At least three cores were scored per case. The analysis of three cores per case has been shown to be comparable with the analysis of the whole section in a recent study (10). A combined score of intensity and extent was calculated and categorized as follows: weak staining 1–2, moderate staining 3–4, strong staining 5–6. All sections were scored independently by Cao and Tian without knowledge of the clinicopathological features or clinical outcome.
Cell culture and TDCA treatment.
The human gastric adenocarcinoma cell line AGS (American Type Culture Collection, Manassas, VA) was cultured in DMEM containing 10% fetal bovine serum and antibiotics at 37°C with 5% CO2 in a humidified atmosphere.
For TDCA treatment, AGS cells were incubated with 10−11 M TDCA for 24 h. Next, the culture medium and cells were collected for measurements.
Small-interfering RNA and TGR5 plasmid transfection.
Twenty-four hours before transfection at 70–80% confluence, cells were trypsinized (1–3 × 10⁵ cells/ml) and transferred to 12-well plates. Transfection of small-interfering RNA (siRNAs) was carried out with Lipofectamine 2000 (Invitrogen, La Jolla, CA) according to the manufacturer's instruction. Per well, 75 pmol of siRNA duplex of TGR5, Gqα, Gαi-3, or control siRNA formulated into liposomes were applied; the final volume was 1.2 ml/well. Forty eight hours after transfection, cells were treated without or with TDCA (10−11 M) in culture medium (pH 7.2, without phenol red) for 24 h, and then the culture medium and cells were collected for measurements. Transfection efficiencies were determined by fluorescence microscopy after transfection of Block-it fluorescent oligonucleotide (Invitrogen) and approached 70% at 48 h.
For transfection of pCDNA3.1-TGR5 plasmid, which was constructed by our lab and described previously (6), AGS cells (70% confluence, ∼5 × 10⁶ cells) were transfected with 2 μg of pCDNA3.1-TGR5 or control plasmids using the Amaxa-Nucleofector-System (Lonza, Walkersville, MD) according to the manufacturer's instructions. Twenty-four hours after transfection, cells were treated with TDCA (10−11 M) for an additional 24 h, and then the culture medium and cells were collected for measurements. Transfection efficiencies were determined by fluorescence microscopy after transfection of pmax-GFP (Lonza) and approached 90% at 48 h.
Coupling to immunoprecipitation matrix and immunoprecipitation experiments.
The TGR5 antibody (5 μg) was coupled to 40–50 μl of suspended IP matrix (Santa Cruz Biotechnology, Santa Cruz, CA) in 500 μl phosphate-buffered saline as recommended by the manufacturer and incubated at 4°C on a rotator overnight. Forty eight hours after pCDNA3.1-TGR5 transfection, cells were lysed in Triton X lysis buffer containing 50 mM Tris·HCl (pH 7.5), 100 mM NaCl, 50 mM NaF, 5 mM EDTA, 1% (vol/vol) Triton X-100, 40 mM β-glycerol phosphate, 40 mM p-nitrophenylphosphate, 200 μM sodium orthovanadate, 100 μM phenylmethylsulfonyl fluoride, 1 μg/ml leupeptin, 1 μg/ml pepstatin A, and 1 μg/ml aprotinin. The supernatants were mixed with TGR5 antibody-IP matrix complex and incubated at 4°C on a rotator for 5 h. The immunoadsorbents were recovered by centrifugation for 5 min at 700 g, washed three times with cell lysis buffer, mixed with SDS loading buffer (Sigma), and heated at 100°C for 5 min.
Western blot analysis.
Cells were lysed in Triton X lysis buffer. The suspension was centrifuged at 15,000 g for 5 min, and the protein concentration in the supernatant was determined. Western blotting was performed as described previously (3). Primary antibodies used were as follows: TGR5 antibody (1:1,000) and GAPDH antibody (1:2,000).
[3H]thymidine incorporation.
Twenty-four hours after transfection with control siRNA, Gq siRNA, Gi-3 siRNA, or TGR5 siRNA, cells were treated without or with TDCA for 24 h and then incubated with [methyl-3H]thymidine (0.05 μCi/ml) for 4 h. After being washed three times with phosphate-buffered saline, cells were collected and homogenized with a lysis buffer containing (pH 7.4): 50 mM HEPES, 50 mM NaCl, 1% Triton X-100, 1% Nonidet P-40, 0.1 mM phenylmethylsulfonyl fluoride, and 1 mM dithiothreitol. [methyl-3H]thymidine uptake was measured in a scintillation counter. The level of protein in the homogenates was also determined, and the level of [methyl-3H]thymidine incorporation was normalized to protein content.
Materials.
[methyl-3H]thymidine was purchased from Perkin Elmer (Waltham, MA); TGR5 siRNA, TGR5 antibody, and GAPDH antibody were bought from Santa Cruz Biotechnology; Gqα antibody, Gsα antibody, Gαi-3 antibody, and Gαi-1 and Gαi-2 antibody were purchased from EMD Chemicals (Gibbstown, NJ). TDCA, Triton X-100, phenylmethylsulfonyl fluoride, and other reagents were purchased from Sigma.
Statistical analysis.
Data are expressed as means ± SE. Statistical differences between two groups were determined by Student's t-test. Differences between multiple groups were tested using ANOVA and checked for significance using Fisher's protected least-significant difference test. For the survival analysis, the intensity scores were grouped as low (which included scores 0 and +1) and high (which included scores +2 and +3). The influence of prognostic factors on tumor-related survival was assessed by Kaplan-Meier estimates, and subgroups were compared by the Breslow test for univariate analysis. The multivariate Cox proportional hazard model was applied using a stepwise forward method to detect independent predictors of survival. Two-tailed P values of 0.05 or less were considered to be statistically significant.
RESULTS
Expression of TGR5 in normal gastric mucosa and in intestinal metaplasia.
To examine the specificity of the TGR5 antibody, we did Western blot analysis in AGS cells. We found that only one band was detectable by using TGR5 antibody (Fig. 1), suggesting that TGR5 antibody is relatively specific. Expression of TGR5 was examined in both normal gastric mucosa and in areas of intestinal metaplasia by immunohistochemistry. As can be seen in Table 2, although the frequency of weak and moderate staining was quite similar in both groups, strong TGR5 staining was only detected in the intestinal metaplasia group (P < 0.01). The staining pattern was membranous and cytoplasmic (Fig. 2, A and B). The data suggest that TGR5 may be overexpressed in some patients with intestinal metaplasia.
Table 2.
TGR5 expression in normal mucosa, intestinal metaplasia, and intestinal-type and diffuse-type adenocarcinoma
| n | Negative | Weak | Moderate | Strong | |
|---|---|---|---|---|---|
| Normal mucosa | 88 | 37 (42.0) | 16 (18.2) | 35 (39.8) | 0 (0) |
| Intestinal metaplasia | 41 | 15 (36.6) | 7 (17.1) | 14 (34.1) | 5* (12.2) |
| Intestinal-type cancer | 86 | 19 (22.1) | 22 (25.6) | 29 (33.7) | 16** (18.6) |
| Diffuse-type cancer | 85 | 37 (43.5) | 27 (31.8) | 19 (22.4) | 2 (2.3) |
n, No. of patients. Percentages are in parentheses.
P < 0.02 and
P < 0.0001 compared with normal mucosa; moderate to strong TGR5 staining was present in 52% of the intestinal but in only 25% of the diffuse subtype of adenocarcinomas (P < 0.001).
Fig. 2.
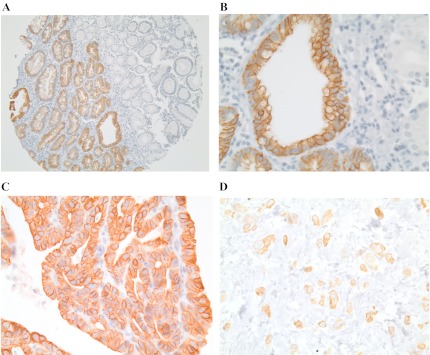
TGR5 expression. A: low-power view (×40) shows that TGR5 expression was increased in the intestinal metaplasia (left) when compared with normal gastric mucosa (right). B: high-power view (×400) shows that the TGR5 staining pattern is membranous and cytoplasmic. C: strong and diffuse TGR5 immunohistochemical staining in intestinal-type gastric adenocarcinoma. D: focal TGR5 immunohistochemical staining in diffuse-type gastric adenocarcinoma. Original magnifications ×100.
Expression of TGR5 in gastric adenocarcinoma.
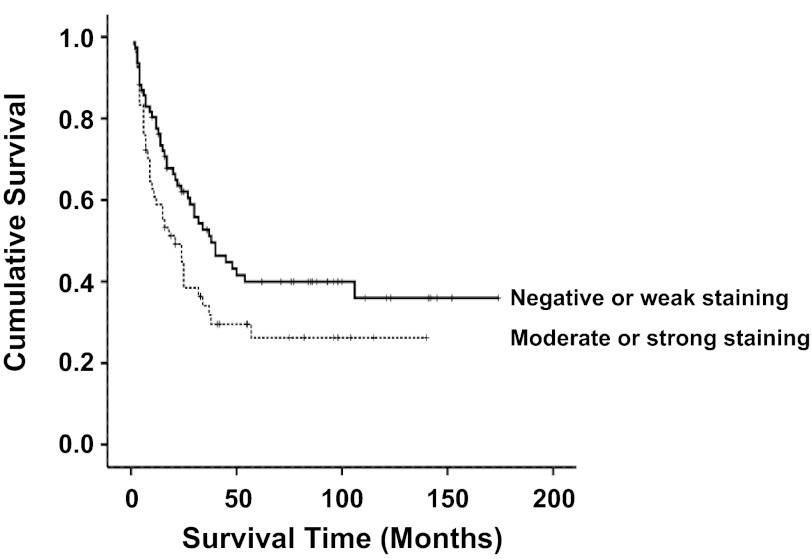
Next we evaluated TGR5 expression in the diffuse and intestinal subtypes of gastric adenocarcinoma. Strong TGR5 staining was present in 18.6% of the intestinal-type adenocarcinomas but in none of the normal mucosa (P < 0.0001, Table 2). Moderate to strong TGR5 staining was present in 52% of the intestinal-type adenocarcinomas but in only 25% of the diffuse subtype of adenocarcinomas (P < 0.001, Fig. 2, C and D, and Table 2). In addition, Kaplan-Meier univariate survival analysis revealed that moderate to strong TGR5 staining was associated with decreased patient survival in all gastric adenocarcinomas (P < 0.05, Fig. 3). There was no statistically significant difference in tumor stage, chemotherapy, and radiation therapy between negative to weak and moderate to strong TGR5 staining tumors (data not shown).
Fig. 3.
Survival analysis. Kaplan-Meier univariate survival analysis shows that moderate to strong TGR5 staining was associated with decreased patient survival in the combination of intestinal and diffuse type of adenocarcinoma (P < 0.05).
We have previously shown that tumor stage and the diffuse as opposed to intestinal subtype are associated with poor survival (17). After adjusting for potential effects of confounding variables, the Cox multivariate model of survival revealed that tumor stage, diffuse subtype, and moderate to strong TGR5 staining were independently associated with a significant decrease in patients' survival (Table 3).
Table 3.
Multivariate survival analysis (Cox proportional hazard model)
| Variable | β (slope) | Standard Error | P Value | Odds Ratio |
|---|---|---|---|---|
| Stage | 0.44 | 0.11 | 0.000 | 1.55 |
| Tumor type | 0.51 | 0.24 | 0.036 | 1.66 |
| TGR5 | 0.52 | 0.23 | 0.024 | 1.68 |
Role of TGR5 in cell proliferation.
To examine the role of TGR5 in cell proliferation, we used the gastric adenocarcinoma cell line AGS, which was most likely derived from an intestinal-type gastric adenocarcinoma (2, 9). We have previously shown that low doses (e.g., 10−11 M) of the bile acid TDCA increases cell proliferation in Barrett's esophagus cells (6). Therefore, we used 10−11 M TDCA in this study. TDCA treatment significantly increased thymidine incorporation in AGS cells. Knockdown of TGR5 with TGR5 siRNA significantly decreased thymidine incorporation at the basal condition as well as in response to TDCA treatment (Fig. 4A). TGR5 siRNA has been shown by us to effectively knock down TGR5 expression (6). To further confirm this result, we transfected AGS cells with a TGR5 expression plasmid. Figure 4, B and C, shows that transfection with TGR5 plasmid significantly increased the TGR5 protein level in AGS cells. In addition, overexpression of TGR5 significantly enhanced the TDCA-induced increase in thymidine incorporation (Fig. 4D). These data suggest that the TGR5 receptor mediates the bile acid-induced increase in cell proliferation.
Fig. 4.
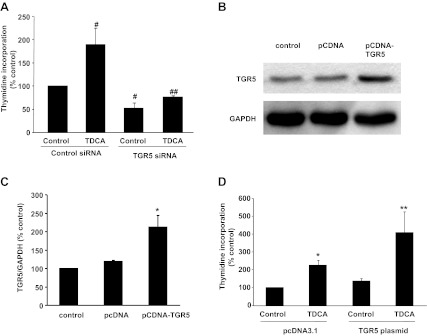
Bile acid taurodeoxycholic acid (TDCA)-induced cell proliferation in AGS cells. A: TDCA treatment significantly increased thymidine incorporation in AGS cells. Knockdown of TGR5 with TGR5 small-interfering RNA (siRNA) significantly decreased thymidine incorporation at the basal condition as well as in response to TDCA treatment. B: a typical image of three Western blot analyses. C: summarized data showing that transfection of AGS cells with TGR5 plasmid significantly increased TGR5 protein expression. D: TDCA treatment significantly increased thymidine incorporation in AGS cells. This increase was significantly enhanced by overexpression of TGR5; n = 3 experiments. ANOVA: #P < 0.05 compared with the control group treated with control siRNA; ##P < 0.01 compared with the TDCA group treated with control siRNA; *P < 0.05 compared with the control group transfected with pcDNA3.1; **P < 0.05 compared with the TDCA group transfected with pcDNA3.1.
TGR5 receptor is coupled with Gq and Gi-3 proteins.
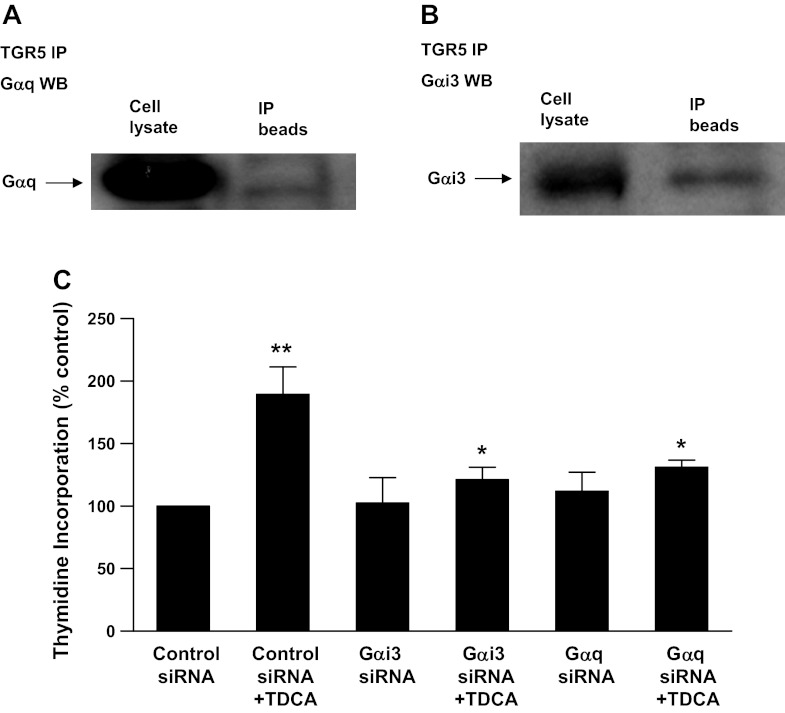
Because TGR5 is a G protein-coupled receptor, we examined which G proteins are coupled with TGR5 receptors in AGS cells. Figure 5, A and B, shows that the TGR5 receptor is coupled with Gq and Gαi-3 proteins in AGS cells. We have previously shown that Gq and Gαi-3 siRNAs effectively knock down Gq and Ga i-3 proteins (6). Knockdown of Gq and Gαi-3 significantly decreased the TDCA-induced increase in thymidine incorporation (Fig. 5C), suggesting that Gq and Gαi-3 proteins may mediate the TDCA-induced increase in cell proliferation.
Fig. 5.
Immunoprecipitation (IP) of G proteins with TGR5 antibody from FLO cell lysate. A and B: cell extracts were immunoprecipitated with an antibody against TGR5, followed by Western blot analysis using the indicated antibodies. A typical example of Western blot analysis of three experiments shows that Gqα and Gαi-3 protein were immunoprecipitated with TGR5 antibody from AGS cell lysate, indicating that TGR5 receptor may be coupled with Gqα and Gαi-3 protein in AGS cells. C: TDCA-induced increase in thymidine incorporation was significantly decreased by knockdown of Gqα or Gαi-3 protein in AGS cells, suggesting that Gqα and Gαi-3 proteins may mediate the bile acid-induced increase in cell proliferation; n = 3. ANOVA: *P < 0.01 compared with TDCA plus control siRNA; **P < 0.001 compared with the control siRNA alone group.
DISCUSSION
Gastric cancer remains one of the most common cancers in the world (14). The mechanisms of gastric carcinogenesis are not fully understood. Several environmental factors, such as H. pylori infection, excessive intake of salt, and low intake of vegetables and fruit, have been implicated (20, 22). Animal studies have shown that eradication of H. pylori infection, especially early on, is effective in preventing H. pylori-related gastric carcinogenesis (4), supporting the role of H. pylori in the development of gastric adenocarcinoma. However, in a meta-analysis of the published clinical trials, H. pylori eradication only prevented gastric cancer by ∼35% (5). Duodenal reflux through the pylorus has been reported to induce gastric adenocarcinoma in rats, suggesting that duodenal juice, including bile acids, may be a risk factor for development of gastric adenocarcinoma (15).
Recently, the G protein-coupled receptor TGR5 has been identified to mediate bile acids' effects as a cell-surface receptor (12). The TGR5 receptor is abundantly expressed in human monocytes and macrophages and participates in the regulation of cell metabolism (13, 21). Primary bile acids (cholic acid, taurocholic acid, and glycocholic acid) and secondary bile acids (deoxycholic acid, TDCA, glycodeoxycholic acid, and taurolithocholic acid) have been shown to bind to TGR5 receptors (12). Primary bile acids are much weaker at inducing cAMP production via activation of TGR5 than secondary bile acids. Deoxycholic acid, TDCA, and glycodeoxycholic acid have similar strengths at inducing cAMP production (12). We have previously shown that TGR5 receptors are present in esophageal adenocarcinoma cells and that TGR5 expression levels were significantly greater in esophageal adenocarcinoma tissues than normal esophageal mucosa or Barrett's mucosa, suggesting that TGR5 may play an important role in the development of esophageal adenocarcinoma (6). Until now, the expression of the TGR5 receptor in the stomach has not been described.
In this study, we found that TGR5 was expressed weakly in normal gastric epithelial cells and moderately to strongly in intestinal metaplastic cells and gastric adenocarcinoma cells. The pattern of TGR5 expression was membranous and cytoplasmic (Fig. 2). Cytoplasmic TGR5 staining may be due to the internalization of membrane-bound receptors, which has been shown in CHO cells (12). In some patients with intestinal metaplasia, TGR5 is overexpressed when compared with normal gastric epithelium. We also found that the expression levels of TGR5 were not significantly different between intestinal metaplasia and gastric adenocarcinoma (intestinal type), indicating that TGR5 receptors may not be further upregulated in adenocarcinoma cells. As shown in Table 2, 45 intestinal-type and 21 diffuse-type cases showed moderate to strong staining, whereas 41 intestinal-type and 64 diffuse-type cases showed negative to weak staining. Even though there are more diffuse-type cases in the negative to weak staining group, moderate to strong TGR5 staining was associated with decreased patient survival in all gastric adenocarcinomas, suggesting that TGR5 may be a negative prognostic marker.
We have previously shown that the TGR5 receptor is involved in bile acid-induced increases in cell proliferation in Barrett's esophagus cells (6). We also find that the TGR5 receptor mediates the bile acid-induced increase in cell proliferation in AGS cells, since TDCA treatment significantly increased thymidine incorporation in AGS cells. This increase was significantly decreased by knockdown of TGR5 with TGR5 siRNA, whereas overexpression of TGR5 significantly enhanced the TDCA-induced increase in thymidine incorporation.
TGR5 is a G protein-coupled receptor. However, which G proteins are coupled to TGR5 receptor in gastric adenocarcinoma cells is not known. In CHO cells, the TGR5 receptor may be coupled to Gsα protein (12). We found that TGR5 receptor was coupled with Gqα and Gαi-3 proteins in AGS cells and that Gqα and Ga i-3 proteins may mediate the TDCA-induced increase in cell proliferation because knockdown of Gqα and Gαi-3 significantly decreased the TDCA-induced increase in thymidine incorporation. This result is slightly different from our finding in esophageal adenocarcinoma cells where Gqα proteins, but not Gαi-3, mediate the TDCA-induced increase in NOX5-S expression and H2O2 production.
In conclusion, TGR5 is moderately to strongly expressed in most gastric intestinal-type adenocarcinomas. Moderate to strong TGR5 staining is associated with decreased patient survival in all gastric adenocarcinomas. Bile acids increase cell proliferation via activation of TGR5 receptors and Gqα and Gαi-3 proteins.
GRANTS
This work was supported in part by National Institutes of Health (NIH) Grants R01 DK-080703 and NCI R01 CA-111533. This project was also in part supported by the Molecular Pathology Core of the COBRE Center for Cancer Research Development, NIH no. P20 RR-17695, awarded by the National Center for Research Resources, Institutional Development Award (IdeA) Program.
DISCLOSURES
No conflicts of interest, financial or otherwise, are declared by the authors.
AUTHOR CONTRIBUTIONS
Author contributions: W.C. and J.H. conception and design of research; W.C. and W.T. analyzed data; W.C. and M.B.R. interpreted results of experiments; W.C. and J.H. prepared figures; W.C. and D.L. drafted manuscript; W.C., D.L., S.F.M., and M.B.R. edited and revised manuscript; W.C. approved final version of manuscript; J.H., D.L., R.T., and L.N. performed experiments.
REFERENCES
- 1. American-Joint-Committee-on-Cancer AJCC Cancer Stagng Manual. New York, NY: Springer, 2010 [Google Scholar]
- 2. Barranco SC, Townsend CM, Jr, Casartelli C, Macik BG, Burger NL, Boerwinkle WR, Gourley WK. Establishment and characterization of an in vitro model system for human adenocarcinoma of the stomach. Cancer Res 43: 1703–1709, 1983 [PubMed] [Google Scholar]
- 3. Cao W, Sohn UD, Bitar KN, Behar J, Biancani P, Harnett KM. MAPK mediates PKC-dependent contraction of cat esophageal and lower esophageal sphincter circular smooth muscle. Am J Physiol Gastrointest Liver Physiol 285: G86–G95, 2003 [DOI] [PubMed] [Google Scholar]
- 4. Cheung TK, Xia HH, Wong BC. Helicobacter pylori eradication for gastric cancer prevention. J Gastroenterol 42, Suppl 17: 10–15, 2007 [DOI] [PubMed] [Google Scholar]
- 5. Fuccio L, Zagari RM, Eusebi LH, Laterza L, Cennamo V, Ceroni L, Grilli D, Bazzoli F. Meta-analysis: can Helicobacter pylori eradication treatment reduce the risk for gastric cancer? Ann Intern Med 151: 121–128, 2009 [DOI] [PubMed] [Google Scholar]
- 6. Hong J, Behar J, Wands J, Resnick M, Wang LJ, DeLellis RA, Lambeth D, Souza RF, Spechler SJ, Cao W. Role of a novel bile acid receptor TGR5 in the development of oesophageal adenocarcinoma. Gut 59: 170–180, 2010 [DOI] [PMC free article] [PubMed] [Google Scholar]
- 7. Houten SM, Watanabe M, Auwerx J. Endocrine functions of bile acids. Embo J 25: 1419–1425, 2006 [DOI] [PMC free article] [PubMed] [Google Scholar]
- 8. Jemal A, Bray F, Center MM, Ferlay J, Ward E, Forman D. Global cancer statistics. CA Cancer J Clin 61: 69–90, 2011 [DOI] [PubMed] [Google Scholar]
- 9. Ji J, Chen X, Leung SY, Chi JT, Chu KM, Yuen ST, Li R, Chan AS, Li J, Dunphy N, So S. Comprehensive analysis of the gene expression profiles in human gastric cancer cell lines. Oncogene 21: 6549–6556, 2002 [DOI] [PubMed] [Google Scholar]
- 10. Jourdan F, Sebbagh N, Comperat E, Mourra N, Flahault A, Olschwang S, Duval A, Hamelin R, Flejou JF. Tissue microarray technology: validation in colorectal carcinoma and analysis of p53, hMLH1, and hMSH2 immunohistochemical expression. Virchows Arch 443: 115–121, 2003 [DOI] [PubMed] [Google Scholar]
- 11. Katsuma S, Hirasawa A, Tsujimoto G. Bile acids promote glucagon-like peptide-1 secretion through TGR5 in a murine enteroendocrine cell line STC-1. Biochem Biophys Res Commun 329: 386–390, 2005 [DOI] [PubMed] [Google Scholar]
- 12. Kawamata Y, Fujii R, Hosoya M, Harada M, Yoshida H, Miwa M, Fukusumi S, Habata Y, Itoh T, Shintani Y, Hinuma S, Fujisawa Y, Fujino M. A G protein-coupled receptor responsive to bile acids. J Biol Chem 278: 9435–9440, 2003 [DOI] [PubMed] [Google Scholar]
- 13. Keitel V, Donner M, Winandy S, Kubitz R, Haussinger D. Expression and function of the bile acid receptor TGR5 in Kupffer cells. Biochem Biophys Res Commun 372: 78–84, 2008 [DOI] [PubMed] [Google Scholar]
- 14. Lau M, Le A, El-Serag HB. Noncardia gastric adenocarcinoma remains an important and deadly cancer in the United States: secular trends in incidence and survival. Am J Gastroenterol 101: 2485–2492, 2006 [DOI] [PubMed] [Google Scholar]
- 15. Miwa K, Hasegawa H, Fujimura T, Matsumoto H, Miyata R, Kosaka T, Miyazaki I, Hattori T. Duodenal reflux through the pylorus induces gastric adenocarcinoma in the rat. Carcinogenesis 13: 2313–2316, 1992 [DOI] [PubMed] [Google Scholar]
- 16. Parkin DM. Epidemiology of cancer: global patterns and trends. Toxicol Lett 102–103: 227–234, 1998 [DOI] [PubMed] [Google Scholar]
- 17. Resnick MB, Gavilanez M, Newton E, Konkin T, Bhattacharya B, Britt DE, Sabo E, Moss SF. Claudin expression in gastric adenocarcinomas: a tissue microarray study with prognostic correlation. Hum Pathol 36: 886–892, 2005 [DOI] [PubMed] [Google Scholar]
- 18. Vauhkonen M, Vauhkonen H, Sipponen P. Pathology and molecular biology of gastric cancer. Best Pract Res Clin Gastroenterol 20: 651–674, 2006 [DOI] [PubMed] [Google Scholar]
- 19. Watanabe M, Houten SM, Mataki C, Christoffolete MA, Kim BW, Sato H, Messaddeq N, Harney JW, Ezaki O, Kodama T, Schoonjans K, Bianco AC, Auwerx J. Bile acids induce energy expenditure by promoting intracellular thyroid hormone activation. Nature 439: 484–489, 2006 [DOI] [PubMed] [Google Scholar]
- 20. Wroblewski LE, Peek RM, Jr, Wilson KT. Helicobacter pylori and gastric cancer: factors that modulate disease risk. Clin Microbiol Rev 23: 713–739, 2010 [DOI] [PMC free article] [PubMed] [Google Scholar]
- 21. Yang JI, Yoon JH, Myung SJ, Gwak GY, Kim W, Chung GE, Lee SH, Lee SM, Kim CY, Lee HS. Bile acid-induced TGR5-dependent c-Jun-N terminal kinase activation leads to enhanced caspase 8 activation in hepatocytes. Biochem Biophys Res Commun 361: 156–161, 2007 [DOI] [PubMed] [Google Scholar]
- 22. Yuasa Y. Control of gut differentiation and intestinal-type gastric carcinogenesis. Nat Rev Cancer 3: 592–600, 2003 [DOI] [PubMed] [Google Scholar]


