

Abstract
Background
Patients with newly diagnosed acute myeloid leukemia (AML) often have residual leukemia in the bone marrow on day 10–14 after the start of induction therapy. Some cooperative groups administer a second cycle of similar induction therapy on day 14 if there is residual leukemia. It is common perception that the presence of residual leukemia at that point predicts for a worse prognosis, irrespective of therapy given. The purpose of this study was to determine if patients who require a second cycle of induction to achieve complete remission (CR), given on or about day 14, have a worse prognosis than patients who achieve CR after only one cycle, since a worse prognosis might alter postremission therapy.
Methods
Patients registered to 6 consecutive studies for AML conducted by the Eastern Cooperative Oncology Group (ECOG) between 1983 to 1993 were treated with induction therapy. If the day 14 bone marrow had residual leukemia, patients were to receive a second cycle of identical induction therapy. All patients who achieved CR after one or two cycles, received the identical post-remission therapy.
Results
In each of the 6 studies the long-term outcome was similar for patients requiring one or two cycles of induction to achieve CR and this was independent of other prognostic variables such as age or karyotype.
In conclusion
The presence of residual leukemia in a day 10–14 bone marrow does not predict for a worse prognosis if a second similar cycle of induction therapy is administered and CR is achieved.
Keywords: Acute myeloid leukemia, induction therapy, prognostic factors, residual disease, complete remission
INTRODUCTION
Prognostic factors for AML at diagnosis include cytogenetics1,2, the fms-related tyrosine kinase 3 gene (FLT3)3,4, the CCATT/enhancer binding protein alpha gene (CEPBA)5,6, the Wilms' Tumor gene (WT1)7 the myeloid-lymphoid or mixed lineage leukemia gene (MLL)8, the nucleophosmin gene (NMP1)9, age10, multidrug resistance status (MDR)11 and white blood cell count at presentation12. Time to achievement of complete remission (CR)13 or time to clearance of peripheral blast cells14,15 have been reported to be independent post-induction prognostic factors in AML. Furthermore, some investigators have considered patients who do not achieve CR with one cycle as refractory or as primary induction failure16,17. In these studies, patients who failed to achieve CR after one cycle were generally not given additional therapy on day 14, if the marrow demonstrated residual leukemia, and most, if not all, such patients can be expected not to be in CR at the end of induction therapy. Residual leukemia present on a day 14 bone marrow can be an early indicator of a highly resistant clone, but can also represent a slower response to therapy. While it is possible that some patients with residual leukemia will achieve a subsequent CR18, most such patients will not be in CR at the end of induction. At the same time, some patients may enter CR if early therapeutic intervention, on or about day 14, is administered. Furthermore, if on about day 14 further therapy is given and the patient achieves CR, little is known about the long-term outcome. Thus, is it appropriate to consider a patient with residual leukemia on day 14 as refractory?
The standard practice of the Eastern Cooperative Oncology Group (ECOG) for the treatment of AML mandates that if the bone marrow performed on day 10–14 of induction demonstrates unequivocal residual leukemia in a marrow that is not hypocellular, a repeat course of the identical induction therapy is given at that point. The planned post-remission therapy is identical whether one or two cycles are required to achieve CR.
Because the post-remission therapy is not altered by the presence of residual leukemia on about day 14, it is therefore possible to evaluate the true impact on the long-term prognosis. This study evaluated patients treated on six consecutive ECOG studies conducted between 1983 and 1993 and comprising approximately 2000 patients, to assess whether the long-term survival is affected by the number of cycles given to achieve CR. This issue is important to address if patients requiring a second cycle of induction therapy to achieve CR have a worse prognosis, their postremission strategy may change.
MATERIALS AND METHODS
Between 1983 and 1993 1,980 patients were registered to 6 consecutive studies of ECOG (E3483, PC486, E1490, E2491/INT0129, E3489 and E3993). All studies were approved by the institutional review boards and all patients gave written informed consent. These studies were for patients age 18–55 years (E3483, PC486 and E3489); age 56–70 years (E1490); age >56 years (E3993) and with no age limit (E2491/ INT0129) (Fig. 1). Of these 1,980 patients, 1272 achieved CR (64%) and were available for analysis. In each study patients received standard induction therapy, consisting of daunorubicin 60 mg/m2 (E3483, PC486 and E1490), or 45 mg/m2 (E2491/ INT0129) or idarubicin 12 mg/m2 (E3489), or a randomization between daunorubicin 45 mg/m2, idarubicin 12 mg/m2 or mitoxantrone 12 mg/m2 (E3993) – all for 3 days – together with cytarabine 100–200 mg/m2 by continuous infusion for 7 days. (Fig. 1). It should be noted that in the North American Intergroup Acute Promyelocytic Leukemia (APL) study (E2491/ INT0129) patients who received ATRA in induction are excluded from this analysis. In each study patients were to receive a second cycle of identical induction therapy if the day 10–14 bone marrow demonstrated unequivocal residual leukemia. Identical study-specific post-remission therapy, including consolidation therapy and/or allogeneic or autologous bone marrow transplantation, was given to all patients who went into CR – irrespective if this was achieved after 1 or 2 cycles.
Figure 1.
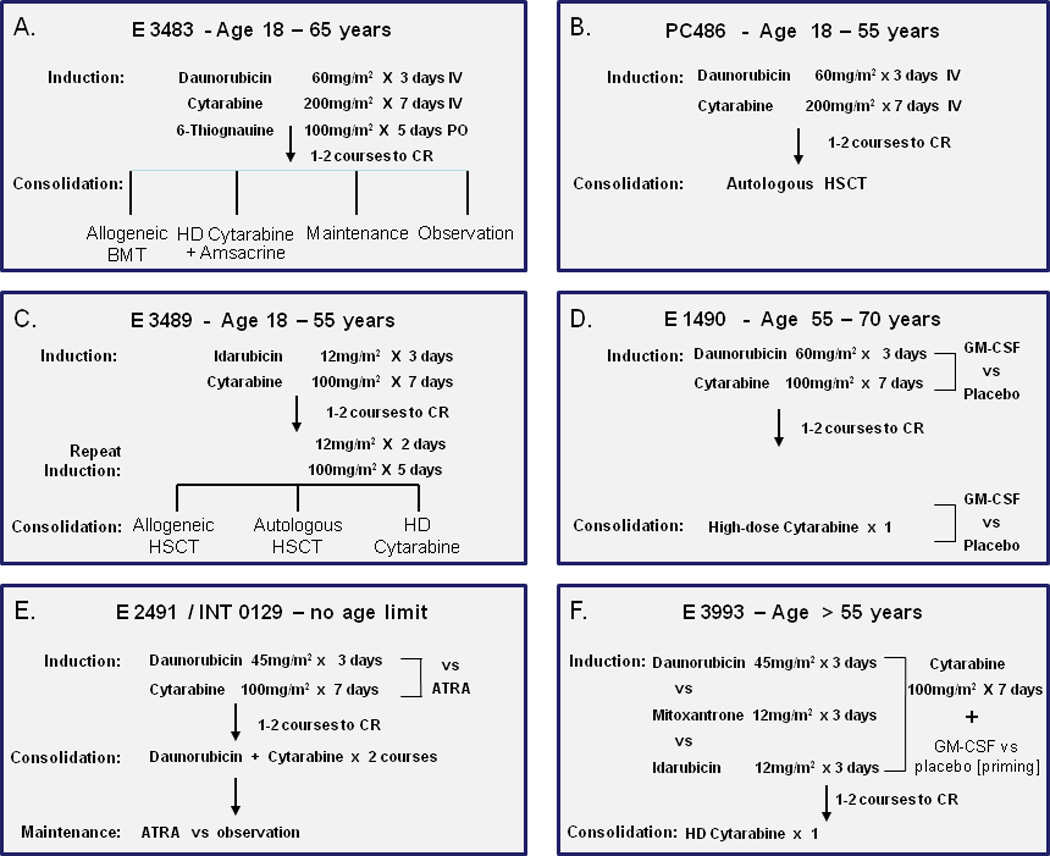
a. E 3483 study for newly diagnosed AML patients of less than 65 years.
The only prospective study in young adults to include an observation arm post remission.
b. PC486 study
A pilot study for young adults of induction therapy to be followed by autologous transplant with in vitro purging for hydroxyl-peroxy-cyclophosphamide years
c. E 3489
A major intergroup study designed to evaluate three prospective post-remission therapies given at approximately the same time point.
d E 1490.
A study evaluating the role of GM-CSF when given after marrow aplasia as evaluated by the marrow on day 10.
e E 2491 / INT 0129.
A North American intergroup study establishing the role of ATRA in induction and as maintenance therapy. For the purpose of this analysis patients who received ATRA in induction are not included.
f E 3993
A study in older patients comparing three induction regimens and randomizing patients to GM-SCF or placebo as priming therapy.
E3483 (Fig. 1a)
This was a phase III trial for patients aged 18–56 years consisting of therapy with daunorubicin 60 mg/m2 for 3 days, cytarabine 200mg/ m2 for 7 days and 6-thioguanine 100mg/m2 for 5 days as induction therapy followed by post-remission therapy with either allogeneic hematopoietic stem cell transplantation (HSCT) if a patient had a histocompatible (HLA) sibling and was less than 55 years of age, high-dose therapy with cytarabine and amsacrine, maintenance therapy with low-dose cytarabine and 6-thioguanine, as well as an observation arm.19
PC486 (Fig. 1b)
This was a phase II study for patients aged 18–55 years using induction therapy with daunorubicin 60 mg/m2 for 3 days and cytarabine 200mg/m2 for 7 days. Patients in CR received an autologous HSCT without any prior intensification.20
E3489 (Fig. 1c)
This was a US intergroup study for patients aged 18–55 receiving induction therapy with idarubicin 12mg/m2 for 3 days together with cytarabine 100mg/m2 for 7 days. If in CR, all patients received a second cycle of "attenuated" induction ("2+5") consisting of idarubicin and cytarabine. The purpose of this added therapy at this point was to enable the various post-remission modalities to be given at the same time, which included the period needed (in the year 1989) to search for a donor and refer a patient to a transplant center. For post-remission, patients were assigned to an allogeneic HSCT if they had an HLA-compatible sibling. Otherwise they were randomized to an autologous HSCT versus a single course of high-dose cytarabine.21
E1490 (Fig. 1d)
This was a study for patients aged 55–70. For induction they received daunorubicin 60 mg/m2 for 3 days and cytarabine 100mg/ m2 for 7 days. All patients were randomized to receive either granulocyte-monocyte colony-stimulating factor (GM-CSF) or placebo in induction. As consolidation, patients received one course of high-dose cytarabine (attenuated for age) with the same randomized study drug (GM-CSF or placebo) that they had received during induction.22
E2491/ INT0129 (Fig. 1e)
This was an international intergroup study with no age limit, using as induction therapy daunorubicin 45 mg/m2 for 3 days and cytarabine 100mg/ m2 for 7 days. This induction regimen was compared with all-trans-retinoic acid (ATRA) given as a single agent without concurrent chemotherapy. As consolidation, patients received 2 cycles of daunorubicin and cytarabine followed by a maintenance randomization to ATRA therapy for one year or observation.23
E3993 (Fig. 1f)
This was a study for patients aged 56 and above with no upper age limit. They were randomized in induction to receive daunorubicin 45 mg/m2 for 3 days versus mitoxantrone 12 mg/m2 for 3 days versus idarubicin 12mg/m2 for 3 days. All patients received cytarabine 100mg/ m2 for 7 days. In induction there was also a randomization to GM-CSF given as priming therapy versus placebo. As consolidation, patients received only one cycle of high-dose cytarabine (attenuated for age).24
Statistical Analysis
Two primary endpoints were explored in this analysis: disease-free survival (DFS) and overall survival (OS). DFS was defined as the time from documented CR until relapse or death from any cause. The Kaplan-Meier (KM) method was used to estimate DFS and OS, the log-rank test was used to test the difference of KM curves between one and two cycles of induction therapy. Furthermore, multivariate Cox regression analysis was performed to examine if the number of cycles of induction therapy were of prognostic significance in the presence of other known prognostic factors for AML, such as age at the study entry, gender, race, baseline hemoglobin levels, white blood cell count (WBC), platelet count and karyotype, although the latter was only available for studies E3489 and E3993. The proportional hazards assumption in Cox model was assessed and all two-way interactions were examined. In addition, baseline characteristics were compared using a two-sided Wilcoxon-Rank-Sum test for continuous variables and Fisher’s Exact test for categorical variables.
All patients who achieved CR, defined according to the international working group25 were included in this analysis. Thus, the study also includes those patients who achieved CR but did not receive further post-remission therapy.
RESULTS
Baseline Characteristics
Baseline characteristics are shown in Table 1. Apart from age in E3483 and white cell count in E2491, the number of induction cycles successfully leading to CR was not affected by age, white cell count, platelet count or the hemoglobin at presentation.
Table 1.
Baseline Characteristics
| No. of Induction Cycles | |||||
|---|---|---|---|---|---|
| 1 | 2 | All |
*p- value |
||
| E3483 | N | 189 | 128 | 317 | |
| age, median (range) | 44(15,65) | 38(15,65) | 41(15,65) | 0.004 | |
| sex, male(%) | 98 (52) | 65 (51) | 163 (52) | 0.82 | |
| WBC, median (range) | 16.4(0.3,270) | 12.5(0.5,271.2) | 15.6(0.3,271.2) | 0.49 | |
| plt, median (range) | 51(7,434) | 57.5(1,520) | 52.5(1,520) | 0.17 | |
| Hb, median (range) | 9.5(0.5,13.9) | 9.3(4,14.7) | 9.3(0.5,14.7) | 0.65 | |
| PC486 | N | 33 | 51 | 84 | |
| age, median (range) | 32(17,53) | 34(16,54) | 34(16,54) | 0.73 | |
| sex, male(%) | 20 (63) | 25 (49) | 45 (54) | 0.26 | |
| WBC, median (range) | 7.9(0.5,147) | 8.5(0.4,159.8) | 8.1(0.4,159.8) | 0.76 | |
| plt, median (range) | 63(11,400) | 68(11,999) | 65.5(11,999) | 0.17 | |
| Hb, median (range) | 9.3(6.4,12.8) | 9(3.5,15.1) | 9.1(3.5,15.1) | 0.68 | |
| E3489 | N | 453 | 75 | 528 | |
| age, median (range) | 38(17,55) | 39(16,54) | 38(16,55) | 0.43 | |
| sex, male(%) | 219(48) | 30 (41) | 249 (47) | 0.26 | |
| WBC, median (range) | 13.2(0.2,360) | 11.2(0.3,396) | 12.9(0.2,396) | 0.17 | |
| plt, median (range) | 51(3,820) | 44(6,259) | 49(3,820) | 0.22 | |
| Hb, median (range) | 9(0.2,16.4) | 9(4.7,13.5) | 9(0.2,16.4) | 0.91 | |
| E1490 | N | 55 | 12 | 67 | |
| age, median (range) | 63(56,70) | 62.5(56,69) | 63(56,70) | 0.81 | |
| sex, male(%) | 32 (58) | 3 (25) | 35 (52) | 0.06 | |
| WBC, median (range) | 4.6(0.8,201) | 3.4(1,64.8) | 3.8(0.8,201) | 0.48 | |
| plt, median (range) | 64(9,273) | 58(14,312) | 64(9,312) | 0.97 | |
| Hb, median (range) | 9.6(4.2,14.9) | 9.9(7.6,11.1) | 9.6(4.2,14.9) | 0.95 | |
| E2491 | N | 87 | 39 | 126 | |
| age, median (range) | 40(1,81) | 36(7,68) | 39(1,81) | 0.33 | |
| sex, male(%) | 38 (44) | 14 (36) | 52 (41) | 0.44 | |
| WBC, median (range) | 2.9(0.2,139) | 1.5(0.3,82.8) | 2.3(0.2,139) | 0.03 | |
| plt, median (range) | 30.5(2,223) | 25(3,220) | 30(2,223) | 0.51 | |
| Hb, median (range) | 9.1(4.5,14.3) | 8.8(4.2,12.5) | 9.1(4.2,14.3) | 0.91 | |
| E3993 | N | 128 | 22 | 150 | |
| age, median (range) | 66(56,80) | 67(58,78) | 66(56,80) | 0.28 | |
| sex, male(%) | 59 (46) | 9 (41) | 68 (45) | 0.82 | |
| WBC, median (range) | 6.9(0.6,200.2) | 2.5(1.1,77) | 6.5(0.6,200.2) | 0.12 | |
| plt, median (range) | 62.5(7,351) | 52.5(18,285) | 60(7,351) | 0.80 | |
| Hb, median (range) | 9(4,14.4) | 9.6(6.2,13.7) | 9.2(4,14.4) | 0.18 | |
p-values for comparison of continuous variables calculated using two-sided Wilcoxon-Rank-Sum (WRS) test.
WBC – white cell count ×103/µL
Plt – platelet count ×103/µL
Hb – hemoglobin g/dL
Table 2 summarizes the CR rate in each study and the number of induction cycles required to achieve CR. In total 1,272 out of 1,980 (64%) achieved a CR with 74% reaching this after one cycle and 26% reaching this after two cycles. Table 3 provides further breakdown on the CR rate and number of cycles given in each study.
Table 2.
Achievement of complete remission and number of induction cycles required for CR
| Study | Complete remission | 1 cycle (%) |
2 cycles (%) |
|---|---|---|---|
| E 3483 | 317/485 (65%) | 60 | 40 |
| PC486 | 84/113 (74%) | 39 | 61 |
| E 3489 | 528/748 (71%) | 86 | 14 |
| E 1490 | 67/111 (60%) | 82 | 18 |
| E 2491 | 126/175 (72%) | 69 | 31 |
| E 3993 | 150/348 (43%) | 85 | 15 |
| All Studies | 1,272 / 1,980 (64%) | 74 | 26 |
Table 3.
Response in each study depending on number of induction cycles
| 1 Cycle | 2 Cycles | All | |||||
|---|---|---|---|---|---|---|---|
| No CR | CR | No CR | CR | No CR | CR | ||
| N (%) | N (%) | N (%) | N (%) | N (%) | N (%) | p-value* | |
| E3483 | 57 (23) | 189 (77) | 111 (46) | 128 (54) | 168 (35) | 317 (65) | <0.001 |
| PC486 | 13 (28) | 33 (72) | 16 (24) | 51 (76) | 29 (26) | 84 (74) | 0.66 |
| E3489 | 218 (33) | 453 (68) | 2 (3) | 75 (97) | 220(29) | 528 (71) | <0.001 |
| E1490 | 20 (27) | 55 (73) | 24 (67) | 12 (33) | 44 (40) | 67 (60) | <0.001 |
| E2491 | 29 (25) | 87 (75) | 20 (34) | 39 (66) | 49 (28) | 126 (72) | 0.22 |
| E3993 | 141 (52) | 128 (48) | 57 (72) | 22 (28) | 198(57) | 150 (43) | 0.002 |
| All | 478 (34) | 945 (66) | 230 (41) | 327 (59) | 708(36) | 1272(64) | 0.001 |
: p-value for comparison of CR rates between 1 and 2 cycles
By multivariate analysis, the important prognostic factors at diagnosis for achievement of CR included age (E3483, E3993); male sex (E3483, E1490), white blood cell count (E3489), hemoglobin (E3483) and cytogenetics (E3489, E3993) (data not shown). The rates of consolidation actually given to patients, as per protocol, were similar whether CR was achieved after 1 or 2 cycles.
Disease-free survival and overall survival
The 5- and 10-year DFS and OS for each study is shown in Table 4. The difference in long-term outcome was not significantly affected by the need for 1 or 2 cycles to achieve a CR in any study. In multivariate Cox regression model, these overall results demonstrating no difference between one or two cycles were not affected by age, presenting white cell count, hemoglobin level or platelet counts, or cytogenetics (data not shown) (Table 5). Karyotypes were only routinely available for studies E3489 and E3993. The distributions of the cytogenetic risk groups are similar between 1 and 2 cycles for all patients or for patients who achieved CR only in these two studies (Table 6). In E2491 almost all patients had the abnormal 15;17 translocation. In the Cox model (Table 5) the hazard ratio was similar with and without karyotype data in these two studies (E3489 and E3993). In fact, the p value is even less significant with inclusion of karyotype data in the model. Figure 2 graphically depicts the DFS in all 6 studies depending on the number of induction cycles received.
Table 4.
Disease-free survival (DFS) and overall survival (OS) depending on number of cycles needed to achieve CR
| OS (%) ±s.e. | DFS (%) ±s.e. | ||||||
|---|---|---|---|---|---|---|---|
| 1 cycle | 2 cycles | p-value | 1 cycle | 2 cycles | p-value | ||
| E3483 | 5yr | 29%±3% | 26%±4% | 0.56 | 21%±3% | 24%±4% | 0.45 |
| 10yr | 22%±3% | 24%±4% | 17%±3% | 22%±4% | |||
| PC486 | 5yr | 42%±9% | 37%±7% | 0.93 | 39%±9% | 35%±7% | 0.87 |
| 10yr | 36%±8% | 35%±7% | 33%±8% | 33%±7% | |||
| E3489 | 5yr | 46%±2% | 34%±6% | 0.20 | 36%±2% | 28%±5% | 0.36 |
| 10yr | 41%±2% | 32%±5% | 34%±2% | 28%±5% | |||
| E1490 | 5yr | 24%±6% | 0% | 0.10 | 20%±5% | 0% | 0.26 |
| 10yr | 21%±6% | 0% | 18%±5% | 0% | |||
| E2491 | 5yr | 57%±5% | 48%±8% | 0.44 | 31%±5% | 38%±8% | 0.88 |
| 10yr | 51%±6% | 45%±8% | 29%±5% | 38%±8% | |||
| E3993 | 5yr | 14%±3% | 14%±7% | 0.22 | 7%±2% | 5%±4% | 0.53 |
| 10yr | NA | NA | NA | NA | |||
s.e. – standard error; NA: not available
Table 5.
Hazard ratio of induction cycle 2 compared to induction cycle 1 in a multivariate Cox model
| OS | DFS | |||
|---|---|---|---|---|
| HR | p-value | HR | p-value | |
| E3483 | 1.20 | 0.17 | 1.05 | 0.71 |
| PC486 | 1.16 | 0.61 | 1.20 | 0.53 |
| E3489 | 1.26 | 0.17 | 1.17 | 0.36 |
| E1490 | 1.86 | 0.07 | 1.54 | 0.21 |
| E2491 | 1.38 | 0.24 | 1.15 | 0.57 |
| E3993 | 1.54 | 0.08 | 1.25 | 0.37 |
HR – hazard ratio
OS – overall survival
DFS – disease-free survival
Table 6.
E3993 & E3489. Cytogenetic risk group breakdown by no of cycles
| E3993 | E3489 | |||||||
|---|---|---|---|---|---|---|---|---|
| All patients (n = 338) | CR only (n = 145) | All patients (n = 578) | CR only (n = 411) | |||||
| Cytogenetics | 1 Cycle (n= 352) | 2 Cycles (n= 86) | 1 Cycle (n= 123) | 2 Cycles (n= 22) | 1 Cycle (n = 516) | 2 Cycles (n= 62) | 1 Cycle (n= 351) | 2 Cycles (n=60) |
| Favorable | 2 (0.8%) | 1 (1.2%) | 2 (1.6%) | 1 (4.6%) | 106 (21%) | 10 (16%) | 88 (25%) | 9 (15%) |
| Intermediate | 98 (38.9%) | 27 (31.4%) | 57 (46%) | 5 (23%) | 236 (46% | 31 (50%) | 173 (49%) | 31 (52%) |
| Unfavorable | 59 (23.4%) | 28 (32.6% | 23 (19%) | 5 (23%) | 152 (29%) | 20 (32%) | 78 (22%) | 19 (32%) |
| Indeterminate | 93 (36.9%) | 30 (34.9%) | 41 (33%) | 11 (50%) | 22 (4%) | 1 (2%) | 12 (3%) | 1 (2%) |
| p-value | 0.36 | 0.19 | 0.6 | 0.2 | ||||
Figure 2. Disease-free survival by number of cycles to achieve CR.
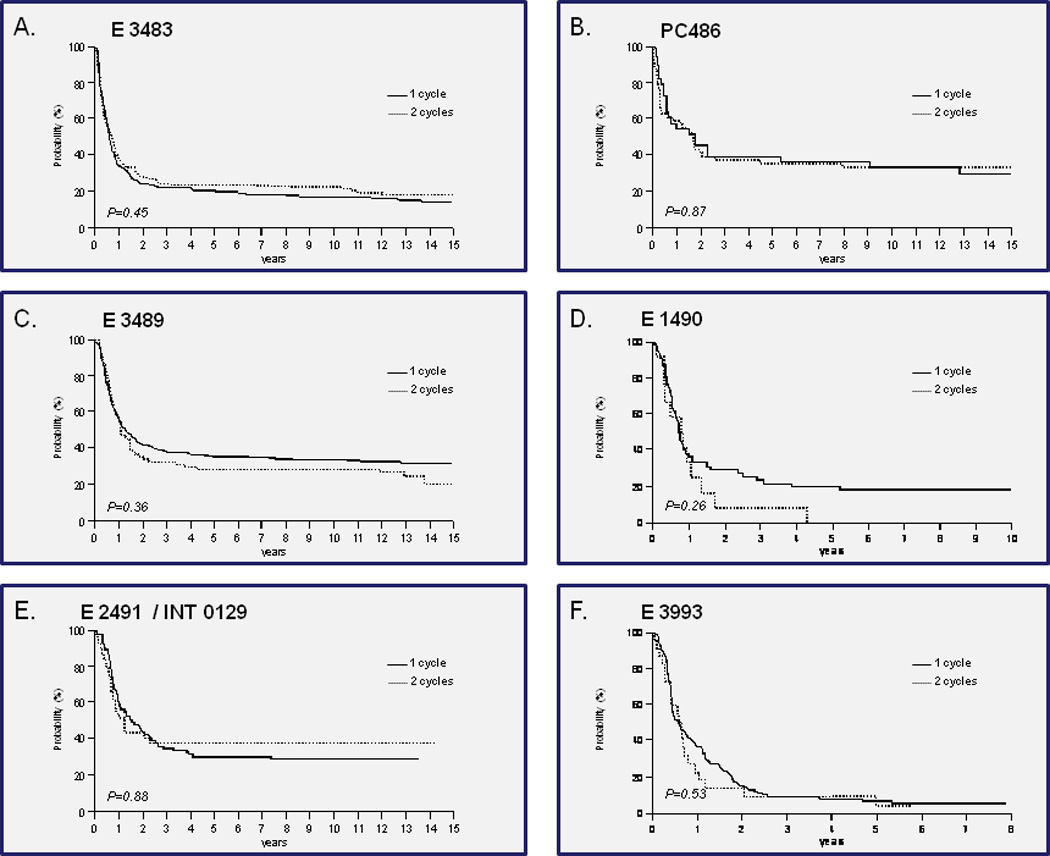
a. E 3483
b. PC486
c. E 3489
d. E 1490
e. E 2491 / INT 0129
f. E 3993
DISCUSSION
Several studies have addressed the significance of a day 10–14 bone marrow, without regard to subsequent therapy that was given26–30. The issue addressed in the present study is what happens to patients who have residual leukemia on day 10–14, receive a second cycle of induction therapy at that point and subsequently achieve CR. Do they have a worse prognosis at that point than patients who achieved CR after only one course of induction? The data reported from this study demonstrate that such patients do not have a worse long-term outcome than patients who achieve CR after one cycle, and therefore no modification of post-remission therapy is warranted for these patients. It must be emphasized that the results of this study in no way imply a recommendation for patients to receive a second cycle on day 14. Rather, the study negates a common perception and practice that patients who achieve a CR after a second cycle of induction, given on day 10–14, have a worse prognosis such that their planned post-remission intervention needs to be altered.
The present analysis included patients who were registered on clinical trials since 1983. Per protocol, all patients who had residual leukemia on day 10–14 were to receive a second course of therapy. 26% of patients who eventually achieved CR required two courses of induction therapy, although the percentage of patients who received two courses varied between studies (Table 2). Above all else, this reflects also the feasibility and safety in young adults of administering a second course of induction therapy on or about day 14. This does not imply that all patients who received such therapy would not have achieved CR if a second cycle had not been given18. Indeed, in some earlier studies of APL residual leukemia on day 14 may have been over- diagnosed31. Furthermore, in the early studies patients may have been diagnosed as having residual leukemia based on a very hypocellular marrow. The rigorous criteria of having unequivocal residual leukemia in the marrow that is not hypocellular were only more commonly instituted in the protocols conducted in the early 1990s32. None-the-less, the rigorous requirement for the assessment of the marrow that may not be hypocellular is not uniform and in most of the earlier analyses33,34 this was not required. The data in this report encompass 6 studies conducted at different time points, with possibly slightly different criteria defining residual leukemia, but with an overall result that is similar and consistent in each study. APL patients who did not receive ATRA are included in this analysis, being a part of consecutive studies for newly diagnosed patients with AML or APL, as the results from this specific study (E2491/INT0129) are virtually superimposable on results from the other studies and excluding this study does not alter the final conclusion. Also, a small number of APL patients were included in the earlier studies for AML (E3483, PC486 and E1490), and were thus not excluded.
The prognostic significance of time to CR in this report, one or two cycles, is independent from other prognostic factors, such as age, presenting white cell counts, hemoglobin or platelets, as well as karyotype. While there is an overall perception that patients who have residual leukemia on about day 14 have a worse prognosis, this should not affect the management of those patients who achieve a CR if a second cycle is promptly administered on day 14. Such patients have a long-term prognosis that is indistinguishable from patients who achieved a CR after one cycle of induction therapy.
There is no doubt that having residual leukemia on a day 14 bone marrow portends for a worse prognosis13–17. In many studies no further therapy is given on day 14, and treatment decisions for post-remission therapy are based entirely on whether or not a CR was achieved at the end of a single cycle. The actual presence of residual leukemia on day 14, or earlier, or the delayed clearance of blasts from the peripheral blood, has been reported to be predictive for a worse prognosis in several publications13–15,18,27–29,33–35.
Two major studies routinely administered two cycles of induction, irrespective of whether CR was achieved after the first cycle. However, none administered this as early as day 14. The Medical Research Council (MRC) in the United Kingdom evaluated over 1,700 patients on their AML10 trial36. In a careful analysis, the two most predictive parameters for outcome were cytogenetics and response after one cycle of therapy. In this MRC trial patients received two courses of induction therapy. However, the second course was invariably given at the end of completion of the first cycle, whether or not a patient had achieved a CR. Patients were never treated as early as day 14. The response was only assessed at the end of induction which is at about 4 weeks from the start of induction33,36. In the German AML Cooperative Group (GAMLCG) 1992 trial, patients received induction therapy with daunorubicin, cytarabine and 6-thioguainine (TAD). A second course of therapy consisting of high-dose cytarabine with mitoxantrone (HAM) was administered on about day 21. A day 16 bone marrow was assessed for residual leukemia, but no therapy was given at day 16. The authors reported that patients with more than 10% blasts on the day 16 bone marrow had only a 54% CR rate compared with patients who had less than 10% blasts on day 16, in whom over 84% achieved CR. The adverse prognostic value of the day 16 bone marrow was independent of all other variables, including cytogenetics34. The impact of marrow cellularity on the assessment of the presence of marrow blasts was not discussed.
Several other studies assessed the time to CR or clearance of peripheral blasts. In a large retrospective analysis reported from the MD Anderson Cancer Center in 1996, 1101 patients with newly diagnosed AML or advanced myelodysplasia were examined. In this study, the authors found a strong correlation between the overall survival and the time to CR, which was an independent prognostic factor, not affected by other prognostic variables such as karyotype.13 In this study, as in the previous studies, patients did not receive a second course of induction on day 14 if there was evidence of residual leukemia at that point. An early report from over two decades ago assessed the bone marrow on day 6 for the degree of marrow cellularity and residual blasts. 116 out of 253 patients were found to have cellularity of more than 30% on the bone marrow biopsy or greater than 10% of abnormal blast cells on the aspirate and these patients received high-dose therapy on days 8, 9 and 10 of induction. There was a non-statistically significant trend for an improved CR for those patients who received the added therapy on day 8 (69%) versus those who did not (60%)28. Several smaller reports in recent years have described the relationship between the rate of clearance of leukemic blasts from the peripheral blood and the likelihood of achieving response14,15. In one report from Italy14 patients who achieved CR had a significantly more rapid clearance of peripheral blood that could be determined from day 2 to day 6 of induction therapy. For example, on day 6 patients who achieved CR had a 3.71 log reduction in their peripheral blasts compared with a 2.08 log reduction for those who did not achieve CR (p = .0001). Another report of 86 adult patients with previously untreated AML demonstrated once again the correlation between the overall relapse-free survival and the rate of blast clearance and actually separated this into 3 prognostic groups. At "good risk" were those with blast clearance before day 3; an "intermediate group" were those in whom the blasts cleared on days 4 or 5 and the "poor-risk" group were those whose peripheral blasts cleared only after day 6 (p < .001)15. Not surprisingly, another Italian group correlated the findings of the bone marrow on day 15 with cytogenetics and reported that over 90% of patients with the favorable karyotype had less than 10% marrow blasts at day 14 compared with less than 20% among patients with unfavorable karyotype. It is clear that as new prognostic markers are increasingly being used in patients with AML, such as FLT3 or NPM1, such analyses are likely to be further refined in future years.
The issue addressed in this report has practical implications. For example, in a large prospective study of AML, residual leukemia in a patient with a normal karyotype was an indication for referral to a matched unrelated donor (MUD) HSCT37. The data from our study do not support assigning such high risk status to patients based on a day 14 marrow alone. Furthermore, future studies will need to determine whether findings in our study are also applicable to patients with adverse molecular subtypes such as, for example, FLT3 positive / NPM1 negative patients9.
REFERENCES
- 1.Grimwade D, Walker H, Harrison G, et al. The predictive value of hierarchical cytogenetic classification in older adults with acute myeloid leukemia (AML): analysis of 1065 patients entered into the United Kingdom Medical Research Council AML11 trial. Blood. 2001;98:1312–1320. doi: 10.1182/blood.v98.5.1312. [DOI] [PubMed] [Google Scholar]
- 2.Slovak ML, Kopecky KJ, Cassileth PA, et al. Karyotypic analysis predicts outcome of preremission and postremission therapy in adult acute myeloid leukemia: a Southwest Oncology Group/Eastern Cooperative Oncology Group Study. Blood. 2000;96:4075–4083. [PubMed] [Google Scholar]
- 3.Kottaridis PD, Gale RE, Langabeer SE, Frew ME, Bowen DT, Linch DC. Studies of FLT3 mutations in paired presentation and relapse samples from patients with acute myeloid leukemia: implications for the role of FLT3 mutations in leukemogenesis, minimal residual disease detection, and possible therapy with FLT3 inhibitors. Blood. 2002;100:2393–2398. doi: 10.1182/blood-2002-02-0420. [DOI] [PubMed] [Google Scholar]
- 4.Schnittger S, Schoch C, Dugas M, et al. Analysis of FLT3 length mutations in 1003 patients with acute myeloid leukemia: correlation to cytogenetics, FAB subtype, and prognosis in the AMLCG study and usefulness as a marker for the detection of minimal residual disease. Blood. 2002;100:59–66. doi: 10.1182/blood.v100.1.59. [DOI] [PubMed] [Google Scholar]
- 5.Frohling S, Schlenk RF, Stolze I, et al. CEBPA mutations in younger adults with acute myeloid leukemia and normal cytogenetics: prognostic relevance and analysis of cooperating mutations. J Clin Oncol. 2004;22:624–633. doi: 10.1200/JCO.2004.06.060. [DOI] [PubMed] [Google Scholar]
- 6.Preudhomme C, Sagot C, Boissel N, et al. Favorable prognostic significance of CEBPA mutations in patients with de novo acute myeloid leukemia: a study from the Acute Leukemia French Association (ALFA) Blood. 2002;100:2717–2723. doi: 10.1182/blood-2002-03-0990. [DOI] [PubMed] [Google Scholar]
- 7.Barragan E, Cervera J, Bolufer P, et al. Prognostic implications of Wilms' tumor gene (WT1) expression in patients with de novo acute myeloid leukemia. Haematologica. 2004;89:926–933. [PubMed] [Google Scholar]
- 8.Dohner K, Tobis K, Ulrich R, et al. Prognostic significance of partial tandem duplications of the MLL gene in adult patients 16 to 60 years old with acute myeloid leukemia and normal cytogenetics: a study of the Acute Myeloid Leukemia Study Group Ulm. J Clin Oncol. 2002;20:3254–3261. doi: 10.1200/JCO.2002.09.088. [DOI] [PubMed] [Google Scholar]
- 9.Schlenk RF, Dohner K, Krauter J, et al. Mutations and treatment outcome in cytogenetically normal acute myeloid leukemia. N Engl J Med. 2008;358:1909–1918. doi: 10.1056/NEJMoa074306. [DOI] [PubMed] [Google Scholar]
- 10.Appelbaum FR, Gundacker H, Head DR, et al. Age and acute myeloid leukemia. Blood. 2006;107:3481–3485. doi: 10.1182/blood-2005-09-3724. [DOI] [PMC free article] [PubMed] [Google Scholar]
- 11.Leith CP, Kopecky KJ, Godwin J, et al. Acute myeloid leukemia in the elderly: assessment of multidrug resistance (MDR1) and cytogenetics distinguishes biologic subgroups with remarkably distinct responses to standard chemotherapy. A Southwest Oncology Group study. Blood. 1997;89:3323–3329. [PubMed] [Google Scholar]
- 12.Schaich M, Koch R, Soucek S, Repp R, Ehninger G, Illmer T. A sensitive model for prediction of relapse in adult acute myeloid leukaemia with t(8;21) using white blood cell count, CD56 and MDR1 gene expression at diagnosis. Br J Haematol. 2004;125:477–479. doi: 10.1111/j.1365-2141.2004.04939.x. [DOI] [PubMed] [Google Scholar]
- 13.Estey EH, Shen Y, Thall PF. Effect of time to complete remission on subsequent survival and disease-free survival time in AML, RAEB-t, and RAEB. Blood. 2000;95:72–77. [PubMed] [Google Scholar]
- 14.Gianfaldoni G, Mannelli F, Baccini M, Antonioli E, Leoni F, Bosi A. Clearance of leukaemic blasts from peripheral blood during standard induction treatment predicts the bone marrow response in acute myeloid leukaemia: a pilot study. Br J Haematol. 2006;134:54–57. doi: 10.1111/j.1365-2141.2006.06100.x. [DOI] [PubMed] [Google Scholar]
- 15.Elliott MA, Litzow MR, Letendre LL, et al. Early peripheral blood blast clearance during induction chemotherapy for acute myeloid leukemia predicts superior relapse-free survival. Blood. 2007;110:4172–4174. doi: 10.1182/blood-2007-07-104091. [DOI] [PubMed] [Google Scholar]
- 16.Hiddemann W, Martin WR, Sauerland CM, Heinecke A, Buchner T. Definition of refractoriness against conventional chemotherapy in acute myeloid leukemia: a proposal based on the results of retreatment by thioguanine, cytosine arabinoside, and daunorubicin (TAD 9) in 150 patients with relapse after standardized first line therapy. Leukemia. 1990;4:184–188. [PubMed] [Google Scholar]
- 17.Estey E. Treatment of refractory AML. Leukemia. 1996;10:932–936. [PubMed] [Google Scholar]
- 18.Hussein K, Jahagirdar B, Gupta P, Burns L, Larsen K, Weisdorf D. Day 14 bone marrow biopsy in predicting complete remission and survival in acute myeloid leukemia. Am J Hematol. 2008;83:446–450. doi: 10.1002/ajh.21133. [DOI] [PubMed] [Google Scholar]
- 19.Cassileth PA, Lynch E, Hines JD, et al. Varying intensity of postremission therapy in acute myeloid leukemia. Blood. 1992;79:1924–1930. [PubMed] [Google Scholar]
- 20.Cassileth PA, Andersen J, Lazarus HM, et al. Autologous bone marrow transplant in acute myeloid leukemia in first remission. J Clin Oncol. 1993;11:314–319. doi: 10.1200/JCO.1993.11.2.314. [DOI] [PubMed] [Google Scholar]
- 21.Cassileth PA, Harrington DP, Appelbaum FR, et al. Chemotherapy compared with autologous or allogeneic bone marrow transplantation in the management of acute myeloid leukemia in first remission. N Engl J Med. 1998;339:1649–1656. doi: 10.1056/NEJM199812033392301. [DOI] [PubMed] [Google Scholar]
- 22.Rowe JM, Andersen JW, Mazza JJ, et al. A randomized placebo-controlled phase III study of granulocyte-macrophage colony-stimulating factor in adult patients (>55 to 70 years of age) with acute myelogenous leukemia: a study of the Eastern Cooperative Oncology Group (E1490) Blood. 1995;86:457–462. [PubMed] [Google Scholar]
- 23.Tallman MS, Andersen JW, Schiffer CA, et al. All-trans-retinoic acid in acute promyelocytic leukemia. N Engl J Med. 1997;337:1021–1028. doi: 10.1056/NEJM199710093371501. [DOI] [PubMed] [Google Scholar]
- 24.Rowe JM, Neuberg D, Friedenberg W, et al. A phase 3 study of three induction regimens and of priming with GM-CSF in older adults with acute myeloid leukemia: a trial by the Eastern Cooperative Oncology Group. Blood. 2004;103:479–485. doi: 10.1182/blood-2003-05-1686. [DOI] [PubMed] [Google Scholar]
- 25.Cheson BD, Bennett JM, Kopecky KJ, et al. Revised recommendations of the International Working Group for Diagnosis, Standardization of Response Criteria, Treatment Outcomes, and Reporting Standards for Therapeutic Trials in Acute Myeloid Leukemia. J Clin Oncol. 2003;21:4642–4649. doi: 10.1200/JCO.2003.04.036. [DOI] [PubMed] [Google Scholar]
- 26.Preisler H, Barcos M, Reese P, Priore RL, Pothier L. Recognition of drug resistance during remission induction therapy for acute non-lymphocytic leukemia: utility of day 6 bone marrow biopsy. Leuk Res. 1983;7:67–75. doi: 10.1016/0145-2126(83)90059-0. [DOI] [PubMed] [Google Scholar]
- 27.Roberts MM, Juttner CA, To LB, Kimber RJ. Bone marrow biopsy during induction chemotherapy for acute myeloid leukaemia identifies only 50% of patients with resistant disease. Leuk Res. 1988;12:817–821. doi: 10.1016/0145-2126(88)90035-5. [DOI] [PubMed] [Google Scholar]
- 28.Browman G, Preisler H, Raza A, et al. Use of the day 6 bone marrow to alter remission induction therapy in patients with acute myeloid leukaemia: a leukemia intergroup study. Br J Haematol. 1989;71:493–497. doi: 10.1111/j.1365-2141.1989.tb06308.x. [DOI] [PubMed] [Google Scholar]
- 29.Hammerschmidt DE, Crea MT. Anthracycline-based therapy of de novo acute myeloid leukemia in adults: failure of first-cycle cytoreduction to predict second-cycle outcome. Am J Hematol. 1994;47:172–177. doi: 10.1002/ajh.2830470305. [DOI] [PubMed] [Google Scholar]
- 30.Cassileth PA, Gerson SL, Bonner H, Neiman RS, Lusk EJ, Hurwitz S. Identification of early relapsing patients with adult acute nonlymphocytic leukemia by bone marrow biopsy after initial induction chemotherapy. J Clin Oncol. 1984;2:107–111. doi: 10.1200/JCO.1984.2.2.107. [DOI] [PubMed] [Google Scholar]
- 31.Tallman MS, Kim H, Andersen JW, et al. Outcome of patients with acute promyelocytic leukemia (APL) in the pre- ATRA era: an anlysis from the Eastern Cooperative Oncology Group (ECOG) Blood. 2002;100:3030a. [Google Scholar]
- 32.Cheson BD, Cassileth PA, Head DR, et al. Report of the National Cancer Institute-sponsored workshop on definitions of diagnosis and response in acute myeloid leukemia. J Clin Oncol. 1990;8:813–819. doi: 10.1200/JCO.1990.8.5.813. [DOI] [PubMed] [Google Scholar]
- 33.Wheatley K, Burnett AK, Goldstone AH, et al. A simple, robust, validated and highly predictive index for the determination of risk-directed therapy in acute myeloid leukaemia derived from the MRC AML 10 trial. United Kingdom Medical Research Council's Adult and Childhood Leukaemia Working Parties. Br J Haematol. 1999;107:69–79. doi: 10.1046/j.1365-2141.1999.01684.x. [DOI] [PubMed] [Google Scholar]
- 34.Kern W, Haferlach T, Schoch C, et al. Early blast clearance by remission induction therapy is a major independent prognostic factor for both achievement of complete remission and long-term outcome in acute myeloid leukemia: data from the German AML Cooperative Group (AMLCG) 1992 Trial. Blood. 2003;101:64–70. doi: 10.1182/blood-2002-02-0532. [DOI] [PubMed] [Google Scholar]
- 35.Ferrara F, Palmieri S, Leoni F. Clinically useful prognostic factors in acute myeloid leukemia. Crit Rev Oncol Hematol. 2008;66:181–193. doi: 10.1016/j.critrevonc.2007.09.008. [DOI] [PubMed] [Google Scholar]
- 36.Burnett AK, Goldstone AH, Stevens RM, et al. Randomised comparison of addition of autologous bone-marrow transplantation to intensive chemotherapy for acute myeloid leukaemia in first remission: results of MRC AML 10 trial. UK Medical Research Council Adult and Children's Leukaemia Working Parties. Lancet. 1998;351:700–708. doi: 10.1016/s0140-6736(97)09214-3. [DOI] [PubMed] [Google Scholar]
- 37.Krauter J, Heil G, Hoelzer D, et al. Treatment of patients up to 60 years with high risk AML: Final results of the AML SHG-Hannover 01/99 trial. Blood. 2006;108:433a. [Google Scholar]