Abstract
Previous studies have shown a loss in the precision of horizontal localization responses of older hearing-impaired (HI) individuals, along with potentially poorer neural representations of sound-source location. These deficits could be the result or corollary of greater difficulties in discriminating spatial images, and an insensitivity to punctate sound sources. This hypothesis was tested in three headphone-presentation experiments varying interaural coherence (IC), the cue most associated with apparent auditory source width (ASW). First, thresholds for differences in IC were measured for a broad sampling of participants. Older HI participants were significantly worse at discriminating IC across reference values than younger normal-hearing participants. These results are consistent with senescent increases in temporal jitter. Performance decreased with age, a finding corroborated in a second discrimination experiment using a separate group of participants matched for hearing loss. This group also completed a third, visual experiment, with both a cross-mapping task where they drew the size of the sound they heard and an identification task where they chose the image that best corresponded to what they heard. The results from the visual tasks indicate that older HI individuals do not hear punctate images and are relatively insensitive to changes in width based on IC.
I. INTRODUCTION
Deficits in absolute azimuthal localization for older hearing-impaired (HI) relative to younger normal-hearing (NH) listeners have been repeatedly shown in the literature (see Section 1.1 below). These errors are often due to an increased variability or scatter in a listener’s observed localization responses, not a systematic bias in a listener’s responses away from the acoustic sound source location. That is, these are errors of imprecision, not bias (Stallings & Gillmore, 1971). This increased imprecision in localization could result from poorer representations of sound-source locations in the aged auditory pathway and lead to a more diffuse percept of sound sources. Given physiological evidence of senescent changes in the neural representations of sound location (May et al., 2006; Ross et al., 2007), it is possible that older HI individuals do not perceive clear, concise – punctate – spatial impressions of sounds. As insensitivity to spatial impression may be a cause of decreased speech-intelligibility benefit from source separation (e.g., Noble et al., 1997), it can impose limits on the usefulness of strategies for restoring localization cues by, for example, bilaterally matched hearing aids.
To examine whether or not HI individuals hear punctate sounds, it is not simply a case of asking whether a sound is punctate or broad; this method has been previously shown to be ineffective (Yost et al., 2007). The perception of punctateness can be determined from measurements of the leftmost and rightmost extents of the spatial image, its apparent auditory source width (ASW; Wiggins & Seeber, 2011). A key parameter influencing the perceived width of a sound is the similarity between the sounds arriving at the two ears, the interaural coherence (IC). The IC is measured as the height of the peak in the interaural cross-correlation function. Changes in IC occur due to the fluctuations in interaural differences due to early reflections (Rakerd & Hartmann, 2010). The current study examined the sensitivity of older HI individuals to changes in the apparent width of a sound caused by changes in IC that were precisely controlled through headphone presentation, and how a method of visual analogy can assess a potential (in)sensitivity to these changes.
A. Localization deficits
Several studies have shown increased horizontal localization errors for older HI individuals relative to younger NH listeners in locating broadband supra-threshold sources. Root-mean-square (RMS) errors increased from 5-8° for younger NH listeners to 13-20° for older HI listeners (Noble & Byrne, 1990; Lorenzi et al., 1999a & 1999b; Keidser et al., 2006; van den Bogaert et al., 2006; Best et al., 2010). RMS localization error, however, cannot separate errors in bias from errors in precision. For studies that reported signed and unsigned (RMS) errors (Noble & Byrne, 1990; Keidser et al., 2006), the localization bias was not different across NH and HI groups, but the precision decreased for HI. Because the groups often differ both in age and pure-tone thresholds, it is not clear whether this imprecision is due more to age-related cortical deficits or peripheral hearing loss, nor how this imprecision manifests itself in perception. In a recent examination of the effects of aging on localization, Dobreva et al. (2011) had young (19-41 years), middle-aged (45-66 years) and elderly (70-81 years) participants locate suprathreshold noise-burst trains in the near front hemifield (−40 to +40°) with a visual pointer. Middle-aged and elderly participants had pure-tone thresholds ranging from normal to mild-to-moderate sloping loss. The results for broadband stimuli, when expressed as signed error, showed no significant differences between groups. The precision of responses, however, significantly varied between groups, with an average intrasubject variability (i.e., standard deviations around mean location) of 2.4° for young, 4.1° for middle-aged, and 5.5° for elderly participants.
B. Aging and localization
There are age-related deficits in temporal cues to sound localization that could lead to imprecise localization judgments and are unrelated to peripheral sensorineural hearing loss (Fitzgibbons & Gordon-Salant, 1996). Aging affects the lateralization of click trains, resulting in a doubling of lateralization threshold for older participants with normal pure-tone audiometric thresholds below 4 kHz compared to younger participants (Herman et al., 1977). Babkoff et al. (2002) corroborated this, finding increased insensitivity with age to temporal (interaural time difference; ITD) but not level cues (interaural level difference; ILD) for the lateralization of click trains. They also found decreased ability to discriminate diotic from dichotic click trains with age. Grose and Mamo (2010) found that the ability to discriminate phase-dynamic (dichotic) from phase-static (diotic) stimuli significantly decreased from young adults (age 18-27 years) to middle-aged adults (age 40-55 years) to older adults (age 63-75 years). Physiological data corroborates the effects of aging on supra-threshold localization, ranging from much more broadly tuned and less intense inferior colliculus responses in small mammals (May et al., 2006) to decreased sensitivity to phase information in the human auditory cortex (Ross et al., 2007). Given older individuals decreased ability to detect differences between diotic and dichotic stimuli (Babkoff et al., 2002; Grose & Mamo, 2010), it is possible that there is a loss in the ability to perceive punctate sounds.
C. Auditory source width and interaural coherence
In architectural acoustics, the spatial impression of a sound can be described by its apparent auditory source width (ASW). Keet (1968) found an inverse linear relationship between subjective judgments of ASW and the IC of orchestral music recordings; that is, ASW decreases with increasing IC. Later studies corroborated this finding, although the relationship for narrowband sounds has been found to be nonlinear (e.g., Ando & Kurihara, 1986). A broadening percept with decreasing IC was demonstrated by Blauert and Lindemann (1986) in a task where NH listeners drew the size of broad- and narrowband noises presented over headphones.1 The extent of these intra-cranial images increased from full IC (1) to partial (< 1) ICs, but was not significantly different across partial ICs of 0.25-0.75 for broadband stimuli. Merimaa and Hess (2004) described an updated computerized version of this technique and applied it to recordings in different rooms, showing that it was sensitive to acoustic changes as well as inter-listener differences.
The increased imprecision seen in older HI localization studies could be the result or corollary of broader images of sound source location. That is, if there are poor neural responses to sound-source location in aged – not necessarily hearing-impaired – populations, there should be greater difficulties in discriminating ASW based on IC and broader images for highly coherent sounds. In previous studies of normal-hearing interaural coherence discrimination, thresholds for discriminating IC-varying stimuli with bandwidths greater than 1 kHz against a diotic (IC = 1) reference ranged from 0.019 to 0.045 with an average change-in-coherence (ΔIC) threshold of 0.035 (Pollack & Trittipoe, 1959; Gabriel & Colburn, 1981; Akeroyd & Summerfield, 1999; Boehnke et al., 2002; Lüddemann et al., 2009). In a study of several binaural discrimination tasks for a small number of listeners, Gabriel et al. (1992) examined IC discrimination against a diotic (IC = 1) reference for third-octave bands of noise centered at 250-4000 Hz. One of two high-frequency sensorineural hearing loss (SNHL) participants (aged 48 years) had an IC-difference (ΔIC) threshold of near-NH performance at 250 Hz, but was an order of magnitude worse at 500 and 1000 Hz. The other SNHL participant (aged 65 years) could not perform the task at 250 Hz, and had dramatically higher thresholds at other frequencies. In a later study of binaural tasks with hearing-impaired listeners, Koehnke et al. (1995) also examined coherence discrimination for third-octave bands of noise centered at 500 and 4000 Hz from a diotic reference for young NH (age 18-32 years) and HI (age 19-70 years) individuals. All HI individuals performed worse than all NH individuals.
D. Current Study
The goal of the current study was to determine the sensitivity of hearing-impaired adults to punctate sounds through a combination of psychophysical discrimination and perceptual judgment methods. We examined ASW sensitivity through its underlying psychophysical correlate, IC, in three headphone-presentation experiments. First, a broad sampling of participants performed an IC discrimination task across several reference ICs, so allowing a comparison to the NH results of Pollack and Trittipoe (1959) and the HI results of Gabriel et al. (1992) and Koehnke et al. (1995). Second, the particular role of aging in insensitivity to punctate images was investigated with a sample of participants matched for hearing loss performing the same discrimination task against a diotic reference. Third, the same group of participants from the second experiment also drew a visual representation of the size and position of the image they perceived (cf. Blauert & Lindemann, 1986). To corroborate this open-set visual cross-mapping task, the third experiment also included an identification task, where listeners selected from a closed set of visual images the nearest representation to the sound-source size and location they heard.
2. METHODS
Stimuli in all three experiments were broadband noises constructed using octave-spaced, third-octave-wide narrowband noises whose ICs could be independently controlled, to ensure the same IC in each band. The stimuli were generated using the symmetric method, where two independent noises are added and subtracted, respectively, to each other in the left and right channel, to reduce potential variability (Hartmann & Cho, 2011). Simon and Aleksandrovsky (1997) found that equal dB SPL presentation of narrowband noises for hearing-impaired listeners with any audiometric asymmetries produced a more stable midline percept than adjusting the signal to equal SL presentation. Therefore, a flat A-weighted 75-dB SPL presentation was used across experiments here. In the discrimination experiments (I and II), the level was modestly roved to control for changes in level caused by correlation differences (Edmonds & Culling, 2009) while not affecting ASW judgments (cf. Sato & Ando, 2002).
A. Experiment I
In the first experiment, participants varying in age and hearing loss discriminated the ASW of broadband noises based on the IC difference between the noises across several reference ICs and at three global interaural time differences (ITDs).
1. Participants
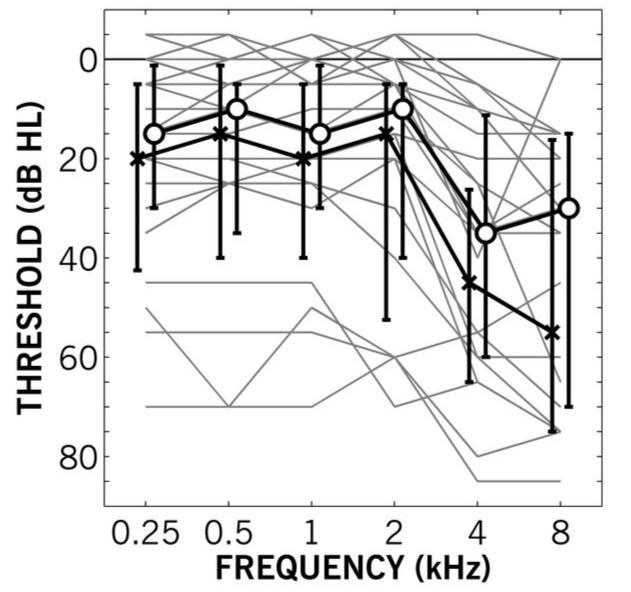
Twenty-three adults (7 female, 16 male) were recruited from the pool of normal-hearing and hearing-impaired patients available to the Institute of Hearing Research, sourced from attendees at clinics of the local hospitals by postal survey, and employees of the Institute. Seven of the participants (2 female, 5 male) were classified as “younger” adults by being below 40 years of age (25-38 years). The remaining 16 listeners (age 46-75 years) were classified as “older.” Pure-tone thresholds were assessed using the modified Hughson-Westlake method (British Society of Audiology, 1981) with a calibrated audiometer (GSI 61). All hearing losses were predominantly sensorineural, with air-bone conduction differences less than 10 dB HL. As shown in Figure 1, the hearing losses varied widely from normal to moderate-to-severe. Four of the older participants had variable pure-tone threshold average (VPTA) asymmetries greater than 20 dB HL.2 At the time of testing, nine of the older participants were unilaterally aided and one older participant was bilaterally aided. All testing was done unaided.
Figure 1.
Pure-tone audiometric thresholds as a function of frequency for Experiment I. Gray lines show individual participant’s better-ear (based on variable pure-tone threshold average) audiogram. Black lines show median thresholds for left (crosses) and right (circles) ears. Error bars show first and third quartile ranges.
2. Apparatus
Participants were seated in a sound-dampened booth (1.5 × 1.3 × 2 m). The stimuli were presented via a soundcard (RME DIGI-96/8 PAD), audio amplifier (Arcam A80), and circumaural headphones (Sennheiser HD-580). Responses were given via a touch-screen monitor.
3. Stimuli
To vary their IC, stimuli were 500-ms broadband complexes comprised of third-octave narrow-band noises centered at 250-4000 Hz in octaves. To create each component at a desired IC, two uncorrelated narrowband noises were first generated in the Fourier domain using real and imaginary values from a Gaussian distribution at each spectral frequency with a sampling rate of 48 kHz. The two uncorrelated noises were then mixed using the symmetric generator method (Plenge, 1972; Hartmann & Cho, 2011) so that the stimulus component in one channel (L) was the addition of the two noises (N1 and N2) and the other (R) was the subtraction:
where α = [½(IC + 1)]½ and β = (1 – α)½
These narrowband noises were repeatedly generated in advance until there were 100 samples of each narrowband noise within 0.0001 tolerance of the desired IC (0-1.00 in 0.01 increments) at each center frequency. Each narrowband noise was equalized to have the same RMS level regardless of bandwidth and summed. Each broadband signal was composed from a random selection out of the 100 stored samples at each of the center frequencies on each stimulus presentation and for each interval. An ITD of −312, 0 or 312 μs subsequently was applied to the broadband signal. The signal was then adjusted to a calibrated long-term average A-weighted level of 75 dB SPL using an artificial ear (Bruel & Kjaer 4153) coupled to a sound level meter (Bruel & Kjaer 2600). For three participants with moderate-severe sloping hearing loss, the level was adjusted to 85 dB to ensure audibility [i.e., greater than 10 dB SL across test frequencies (250-4000 Hz)].3
4. Procedure
Interaural coherence discrimination thresholds were measured using a two-interval forced-choice adaptive procedure. On each trial, participants were presented with two intervals, one at the reference IC and the other at reference-minus-difference coherence. Participants were asked to judge which of the two sounds appeared wider to them. The IC difference (ΔIC) was adjusted using a two-up/one-down rule, asymptoting on the 71%-correct point on the psychometric function (Levitt, 1971). Participants were first instructed on the task: to judge which of the two sounds was wider. They were then given a shorter version of the adaptive task with a reference IC of 1, starting ΔIC of 0.3 and step size of 0.1 to familiarize them with the stimuli and the task just prior to testing. For test trials, the ΔIC was adjusted in 0.02 steps for the first two reversals, then 0.01 steps for six more reversals. Thresholds were calculated as the average of the last four reversals. Thresholds were estimated at five reference IC values of 0.5, 0.75, 0.88, 0.95 and 1. The order of reference IC was also randomized across runs. Initial ΔIC values were 0.33, 0.22, 0.15, 0.10 and 0.08, respectively, all being approximately 0.05 higher than the discrimination thresholds obtained by Pollack and Trittipoe (1959). The average adaptive-track length was 31 trials. The total session lasted 1-1.5 hours.
B. Experiment II
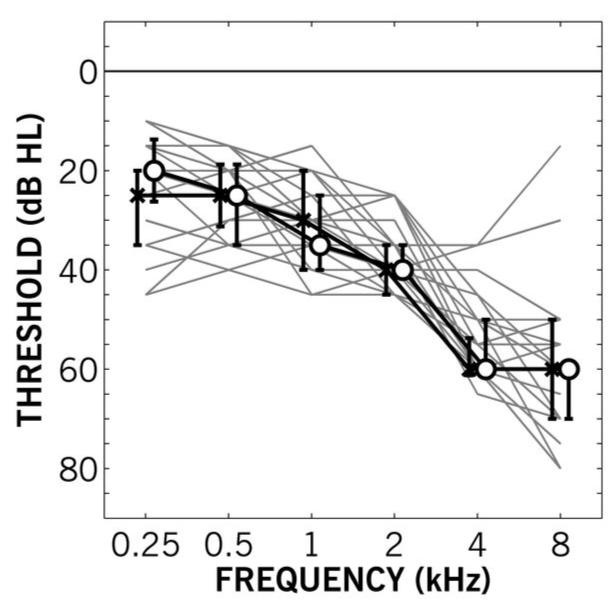
In the second experiment, the particular role of aging in the results of Experiment I was investigated with a sample of participants matched for hearing loss performing the same discrimination task as Experiment I against a diotic reference. Twenty-one participants (10 female, 11 male), none of whom participated in Experiment I, were recruited based on previously measured audiometric thresholds showing negligible asymmetry between the two ears, and no signs of conductive loss in either ear. Their ages ranged from 47-77 years (median age 65 years). Pure-tone thresholds were re-assessed just prior to the experiment and are shown in Figure 2. The actual range of VPTAs was 33-43 dB HL with asymmetries of 0-10 dB HL. At the time of testing, six of the participants were unilaterally aided and two were bilaterally aided. All testing was done unaided.
Figure 2.
Pure-tone audiometric thresholds as a function of frequency for Experiment II. Gray lines show individual participant’s better-ear (based on variable pure-tone threshold average) audiogram. Black lines show median thresholds for left (crosses) and right (circles) ears. Error bars show first and third quartile ranges.
The apparatus was the same as in Experiment I. The stimuli were generated as above except that only a diotic (IC = 1; 0 ITD and ILD) reference was used. Participants performed the same discrimination task procedure as in Experiment I but only for one stimulus condition with three interleaved tracks (cf. one track in Experiment I) with starting ΔIC values randomly chosen from the range 0.14-0.18, based on the results of Experiment I. ΔIC thresholds were calculated as the average of the three interleaved threshold estimations for each participant. The instructions and practice were the same as in the previous experiment.
C. Experiment III
In the first part of the third experiment – Experiment IIIa – the same group of 21 participants from the Experiment II also drew a visual representation of the size and position of the image they perceived on a touch screen (i.e., an open-set, cross-modal task). In the second part – Experiment IIIb – the last 15 HI participants from Experiment II selected from a set of 15 arbitrary images of source width and position the closest visual representation to what they heard (i.e., a closed-set, identification task). Experiment III directly followed Experiment II for all HI participants. In addition, four younger NH participants (1 female) from Experiment I completed Experiment IIIa and IIIb for comparison purposes.
The apparatus was the same as in the previous experiments. The stimuli were generated as above except that there were five simulated positions: 0°, ±30° and monaural left (L) and right (R). The simulated 0° position, with 0 ITD and ILD, was the same as the 0 ITD stimuli in Experiment I. The simulated ±30° positions were produced by using the ITD and ILD values derived from average measurements of the KEMAR and AUDIS person-specific impulse-response databases for targets at ±30° azimuth and 0° elevation (Gardner & Martin, 1995; Blauert et al., 1998): 229 μs and 4.8 dB, respectively. The monaural left and right signals were produced by fully attenuating the other channel. Three IC values were tested, 0.6, 0.8 and 1, at the three simulated positions as well as monaurally, totalling 11 stimulus conditions.
For Experiment IIIa, participants were asked to sketch the perceived size of the sound. Unlike Blauert and Lindemann (1986), participants sketched the size of the sound only from the front perspective, not the top. Participants were therefore instructed to project any images heard at the rear of the head into the frontal plane. No specific instructions were given on how to draw the sound sources except that the experiment was concerned with the size of the sound the participants heard. After the presentation of a stimulus, participants were presented with a 450-pixel (15.9 cm display size) square image of a mannequin head, with an ear-to-ear distance of 360 pixels. Participants were instructed to draw the size of the image using a plastic stylus which displayed a red 8-x-8 pixel square centered at the point of contact. To ensure that participants understood the mirror-image aspect of the task, practice stimuli with an IC of 1 at the five positions (L, −30°, 0°, +30° and R) were presented sequentially. None of the participants swapped the lateral position of the practice stimuli, indicating an initial understanding of the method. After this short practice, participants drew the perceived sound location and size for ten presentations of each combination of IC and position for a total of 110 trials. The stimuli were presented in randomized order. If participants did not respond, the same trial was repeated.
Occasionally the participants sketched incomplete shapes, requiring a two-dimensional recursive moving average to create closed shapes for each trial response. The responses from five older HI participants were not included in further analysis: two participants only drew dots to indicate position, and three others occasionally placed the ±30° stimuli contralaterally. Results are based on the responses of the remaining 16 older HI participants. The width was computed as the difference between the x-axis minimum and maximum for each shape drawn by the participant. The center was computed for each shape as the geometric centroid [(1/n) × Σxn]. To account for possible outliers, the analysis excluded the minimum and maximum width from the ten responses (i.e., the lower and upper tenth percentiles) for each IC and position, resulting in eight responses per condition per participant.
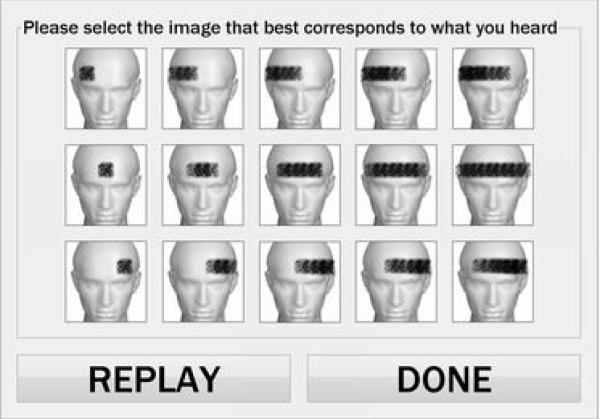
For Experiment IIIb, participants were asked to select which of 15 images most closely represented the width of the sound they heard (see Figure 3). After presentation of a stimulus, participants were presented with 15 100-pixel square images of the same mannequin in a 5-by-3 matrix with the forehead of the mannequin covered by a gray bar (made of visual noise) representing the ASW. Bars in the first column were 20×20 square, and in progressive columns were 20-pixel height rectangular objects of linearly increasing width from 40-100 pixels (see Figure 3). These images represented IC values of 1.0 to 0.6 in 0.1 increments based on the pilot responses of NH listeners to the first part of Experiment III (see Figure 7) and the source-width formula of Sato and Ando (2002). The top row were left (−30°) images; the middle row were center (0°) images; the bottom row were right (+30°) images. Five IC values were tested: 0.6-1.0 in increments of 0.1. The 15 combinations of position and IC were presented in randomized order for each of six trial blocks (i.e., a total of 90 trials). The first two blocks (i.e., the initial 30 trials) were considered practice trials and those responses were discarded from the results. Participants were allowed to replay any trial.
Figure 3.
User interface for Experiment IIIb, the closed-set identification task. Participants were asked to select the position (row) and width (column) of displayed image that best represented the stimulus they heard.
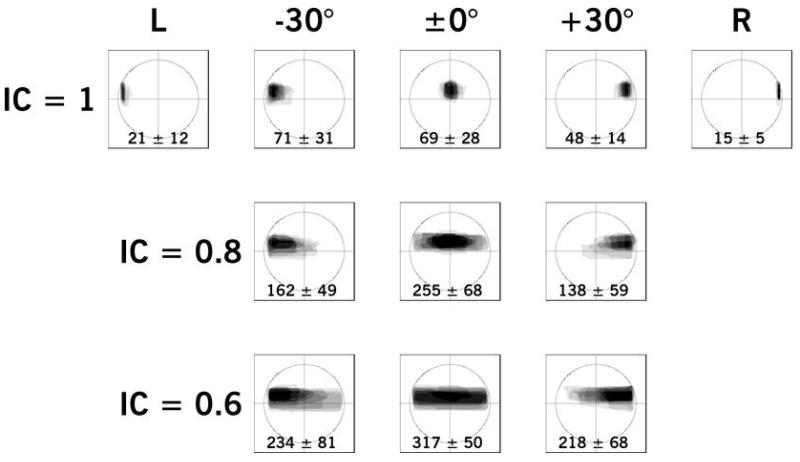
Figure 7.
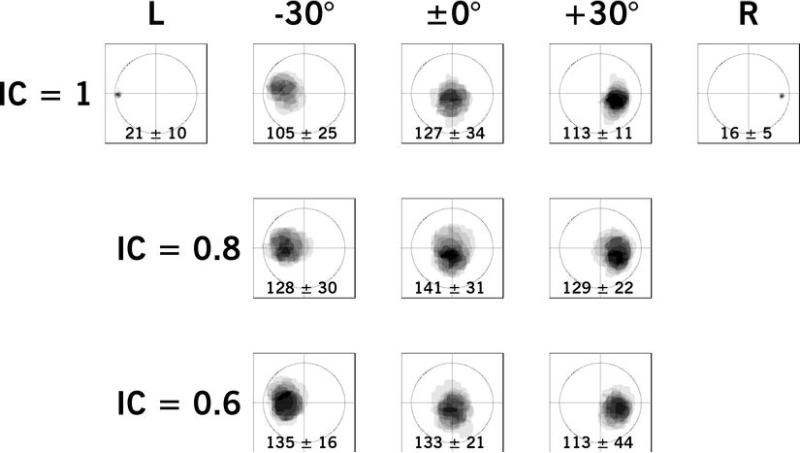
Example of Experiment III results for a younger NH participant, aged 38 years, BEA of 6.7 dB HL, showing aggregated images as a function of position (horizontal labels) and interaural coherence (vertical labels). Levels of gray indicate the frequency of response for that pixel. The mean and standard deviation of image widths relative to the head width is given at the bottom of each frame.
III. RESULTS
A. Experiment I
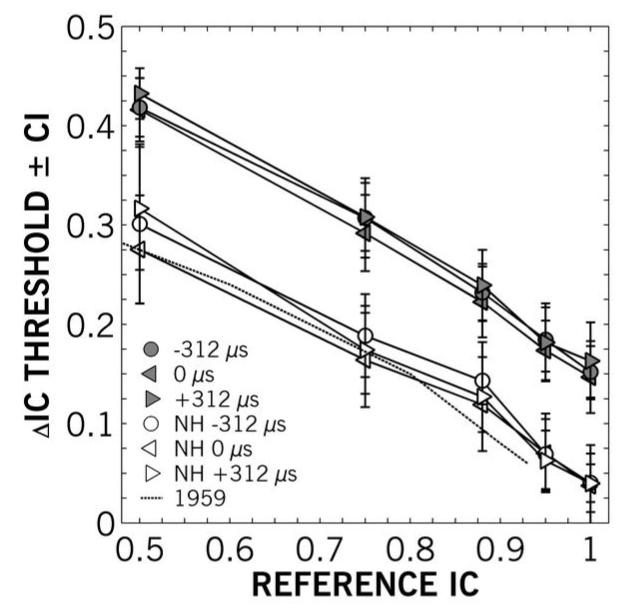
Figure 4 shows the mean ΔIC thresholds as a function of reference coherence and ITD for younger and older groups. The thresholds obtained from the younger normal-hearing group (open symbols in Figure 4) were not noticeably different from previous measures (dotted line; Pollack & Trittipoe, 1959), but the older group (filled symbols) was dramatically worse. An analysis of variance revealed statistically significant main effects of participant group [F(1, 315) = 253.0; p < 0.001] and reference IC [F(4, 315) = 168.1; p < 0.001], but no statistically significant interaction. There was no effect of added ITD [F(2, 315) = 1.07; p > 0.05]. This corroborates previous findings of Koehnke et al. (1995). For a source with a reference IC of 0.5, several older listeners showed a near complete inability to perform the task, barely discriminating noises with IC of 0.5 from those with zero coherence. There was a near-linear relationship of ΔIC on reference IC for younger listeners and several older listeners, though this linearity was not consistent across participants.
Figure 4.
Mean IC difference (ΔIC) thresholds as a function of reference IC for older (filled) and younger (open) participants at global interaural time differences of −312 (left triangle), 0 (circle) and +312 (right triangle) μs. The dashed line is average data from Pollack and Trittipoe (1959). Error bars show ±1 standard error. IC discrimination was significantly worse for older participants across reference ICs. There were no significant differences between ITDs for either age group.
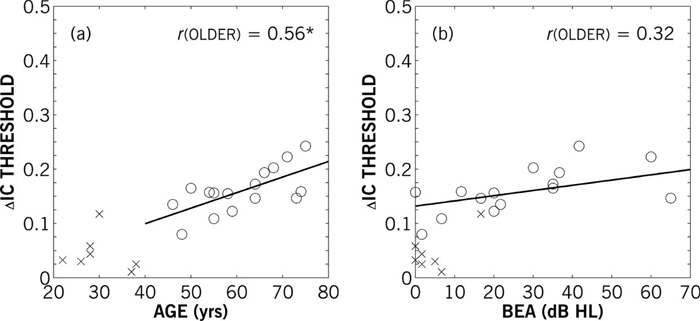
To better examine the effects of hearing loss and age on auditory source width discrimination, plots of individual thresholds against the diotic (IC = 1) reference as a function of age and better-ear VPTA are shown in Figures 5a and 5b, respectively. Adjusted partial Pearson product-moment correlation coefficients were calculated with regards to both age and better-ear VPTA, controlling VPTA and age, respectively) and adjusting for small sample size. Because of the clustering of the NH data (crosses in Figure 5) and potential bias in correlating across discrete groups, correlations and linear regressions were only computed for the older HI data. The adjusted partial correlation (r) for thresholds and age was statistically significant (r = 0.56; p < 0.05). None of the thresholds for the other (partial) reference coherence conditions were correlated with age (r0.95 = 0.14; r0.88 = −0.07; r0.75 = 0.17; r0.5 = −0.05; all p > 0.05). Hearing loss, as defined by participant’s better-ear VPTA, was not significantly correlated with ΔIC discrimination (r = 0.32; p > 0.05), as apparent in Figure 5b. Other threshold measures (e.g., low-frequency pure-tone thresholds, asymmetry) also did not bear any significant correlation with older HI ΔIC thresholds.
Figure 5.
Left panel (a) shows individual IC difference (ΔIC) thresholds for unity (1) reference IC as a function of participant age. Adjusted partial correlations (r) of thresholds and age controlling for better-ear four-frequency average hearing loss were statistically significant for the older HI participants (p < 0.05). The linear regression is shown for older (solid) participants. Right panel (b) shows individual ΔIC thresholds for unity (1) reference IC as a function of better-ear variable pure-tone threshold averages (BEA). Adjusted partial correlations of ΔIC thresholds and BEA controlling for age were not significant for the older HI participants. The linear regressions is shown for older HI participants.
B. Experiment II
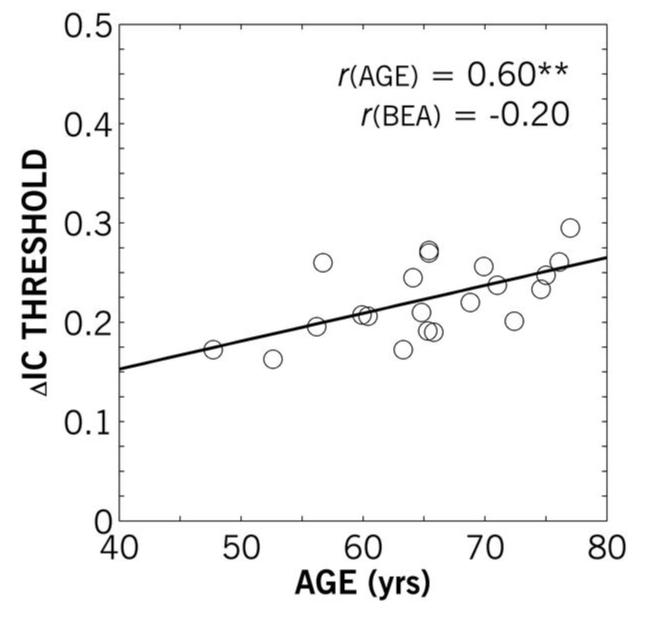
Experiment II examined further the significant correlation between age and IC discrimination against a diotic reference by recruiting participants across an age range similar to Experiment I but with similar hearing losses. For Experiment II, the average ΔIC threshold was 0.22, compared to 0.16 for the older participants in Experiment I. The individual thresholds as a function of age are shown in Figure 6. Like Experiment I, age and ΔIC threshold were significantly correlated (r = 0.60; p < 0.01), whereas better-ear VPTA (ranging only from 33.3-43.3 dB HL) was not. The linear-regression slope for threshold as a function of age in Experiment II was 0.0026, similar to Experiment I, where it was 0.0028.
Figure 6.
Individual IC difference (ΔIC) thresholds as a function of participant age for Experiment II. The adjusted partial correlation (r) of ΔIC thresholds and age controlling for BEA were statistically significant (p < 0.01); the correlation of ΔIC thresholds and BEA controlling for age were not significant. The linear regression of ΔIC threshold and age is shown.
C. Experiment III
Illustrative results for Experiment IIIa are shown in Figure 7 for a younger NH participant and in Figure 8 for an older HI participant. Each panel shows the aggregation of shapes for each condition with an overlay of axes and a circle with a diameter equivalent to the ear-to-ear distance of the mannequin image (360 pixels). The levels of gray indicate the frequency of response, so that the darkest portions were sketched the most often. The mean width and standard deviation is given at the bottom of each panel. Paired-comparison Student’s t-tests of the relative width of images showed statistically significant differences across all ICs and positions for the NH participant shown [t(7) = 2.69 – 31.68; all p < 0.05]. That is, stimuli decreased in width with increasing IC across positions for this participant. The only statistically significant difference in response widths for the HI participant shown was between ICs of 1.0 and 0.6 for stimuli presented at a simulated lateral position of −30° [t(7) = 3.28; p < 0.01]. All other comparisons in width were statistically insignificant for the HI participant shown.
Figure 8.
Example of Experiment III results for an older HI participant, aged 68 years, BEA of 48.3 dB HL, showing accumulated images as a function of position (horizontal labels) and interaural coherence (vertical labels). Levels of gray indicate the frequency of response for that pixel. The mean and standard deviation of image widths relative to the head width is given at the bottom of each frame.
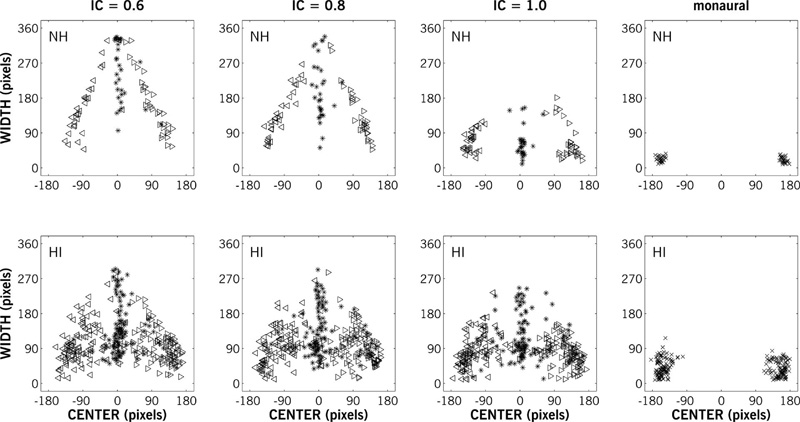
Figure 9 shows the widths and centers of all responses for NH and HI participants (top and bottom rows, respectively). The ear-to-ear extent of the mannequin head image was 360 pixels. The rightmost column shows responses for the monaural L/R stimuli; there is more variability in the (larger) pool of HI participant responses, but all images were narrow and placed near the ears (±180 pixels). The extent of the image clearly constrained the width drawn by participants, as the width of the images for −30° and +30° stimuli (left and right triangles, respectively) increased as the image moved towards center. This is clearest for the NH participants with less coherent (IC = 0.6 or 0.8) stimuli presented at simulated lateral positions of -30° and +30° stimuli (top left panels), which converge towards the center with increasing width. For HI participants compared to NH participants, there is a much broader range in the lateral center of images, especially for 0° stimuli. Compared to NH participants, the distribution of widths for HI participants appears to be relatively unaffected by IC.
Figure 9.
Response widths as a function of response centers in pixels for NH (n = 4) and HI (n = 16) participants (rows) and IC (columns) for stimuli with simulated lateral positions of −30° (left triangles), 0° (asterisks) and +30° (right triangles). The rightmost column shows response widths and centers for the monaural (L/R channel only) stimuli. The extent of the mannequin head (360 pixels) affected the response widths for ±30° stimuli. Response centers were more scattered and response widths were less affected by IC for HI relative to NH participants.
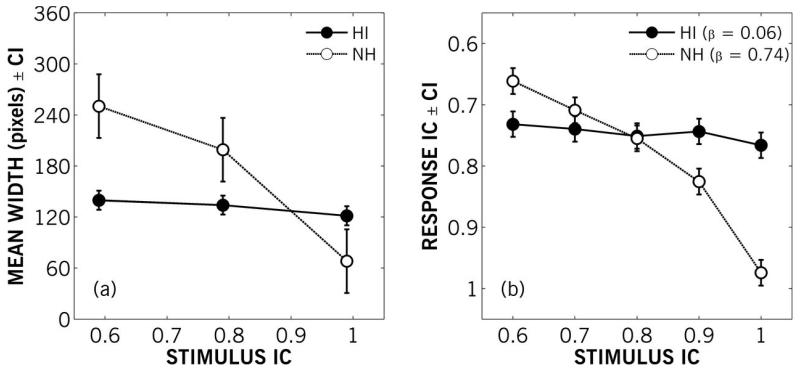
The average widths of the responses for NH and older HI groups for the 0° stimuli are shown in Figure 10a. The 95% confidence intervals shown in Figure 10a were computed from the subject-by-condition interaction term in a repeated measures analysis of variance. There was no statistically significant difference between mean relative width across IC values for HI listeners. There was no significant difference [t(3) = 2.24; p > 0.05] in the relative mean widths of partially coherent (IC of 0.6 and 0.8) stimuli for NH listeners, but these stimuli were drawn significantly wider than the diotic (IC of 1) stimuli [t(3) = 4.75 – 5.36; p < 0.01]. Comparing across groups, the mean relative width of diotic stimuli was significantly greater while the mean relative width of partially coherent stimuli was significantly smaller (p < 0.05) for HI listeners compared to NH listeners. Unlike the discrimination findings for Experiment I or II, there was no significant correlation between age and the width of responses for the older HI group.
Figure 10.
Left panel (a) shows mean results for Experiment IIIa: mean width in pixels of drawn responses by younger NH and older HI participants as a function of the interaural coherence of 0°-position stimuli. Error bars show 95% within-subject confidence intervals. Right panel (b) shows mean results for Experiment IIIb: mean response IC as a function of stimulus IC for younger NH and older HI participants. Error bars show 95% within-subject confidence intervals. For comparison with panel (a), the ordinate direction has been inverted, so broader images are at the top. Average linear-regression slopes (β) are given for both groups.
For Experiment IIIb – the identification task – response ICs were coded based on the IC value assigned to each image. Average response ICs were computed for each participant from their final four selections for each stimulus position (−30, 0 and +30°) and IC. There were no significant differences in selection across positions, so the responses ICs were averaged across position as well. The group average responses are shown in Figure 10b with 95% confidence intervals computed as above. For the more coherent stimuli, with ICs of 0.9 and 1, responses from the NH group represented significantly narrower sound images than responses from the HI group; for the least coherent stimuli (IC = 0.6), NH group responses represented significantly wider sound images than HI group responses (p < 0.05). While the NH group data did not match the assignations of IC to each image, which would have a linear-regression slope of 1, an analysis of variance showed the mean slope of NH participants (0.74) to be statistically significantly greater (p < 0.001) than the mean slope of HI participants (0.06). Furthermore, the mean slope of HI participants’ responses was not significantly different from zero. As the visual identification did not vary across these stimuli for the HI group, there was no significant correlation between older HI participants’ ages and visual-identification responses for any of the stimuli.
IV. DISCUSSION
A. Discrimination of ASW for the hearing-impaired and aged
Older HI participants had increased difficulty relative to younger NH participants in discriminating ΔIC for broadband signals. While the younger NH group was able to report a stimulus as wider than a fully coherent (IC = 1.0) stimulus when the IC decreased by 0.04, the older HI group reported a wider stimulus only when the IC decreased by between 0.16 (Experiment I) and 0.22 (Experiment 2). This deficit in discriminating ΔIC is actually a measure of ΔASW, as listeners were discriminating the difference in perceived width (cf. Keet, 1968). In previous studies of interaural cross-correlation discrimination with HI participants (Gabriel et al., 1992; Koehnke et al., 1995), several participants could not perform the task at all. Here, all participants could discriminate the apparent ASW based on interaural coherence, but simply not as well as younger NH participants (see Figure 4). Although the question in the current study – which stimulus was wider – differs from previous same/different IC tasks, the younger NH results were not significantly different from the Pollack and Trittipoe (1959) data.
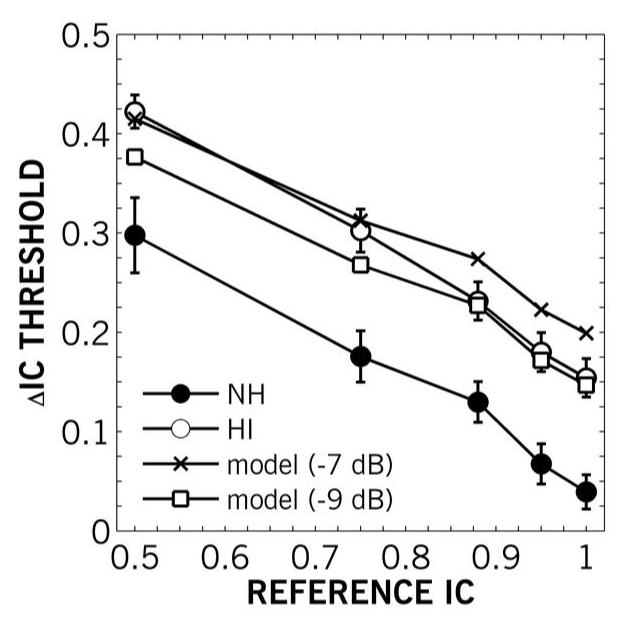
The HI thresholds in Experiment I were consistently worse than those of the NH participants. The gap between younger NH and older HI thresholds ranged only from 0.10 to 0.12 across reference IC values (see Figure 4). We hypothesized that the older HI data could thus be modeled from the NH data by adding independent noises (N1 & N2) attenuated by a to each channel of noises based on NH data (LNH, RNH) to reduce the IC (cf. the asymmetric three-generator method for generating noises; Hartmann & Cho, 2011).
where IC(LNH, RNH) = 1 – ΔICNH
Figure 11 shows the results of this model with attenuation values (a) of −7 and −9 dB compared with mean NH and HI data from Experiment I (Figure 4), collapsed across ITDs. This simple model describes the older HI results well with independent noise at −9 dB for highly coherent (IC = 0.88-1.0) stimuli, but underestimates thresholds for less coherent (IC = 0.5-0.75) stimuli. With independent noises added at −7 dB, the model describes older HI performance for less coherent stimuli but overestimates thresholds for the more coherent stimuli. This model, though, can only describe the mean data, as individual ASW discrimination performance varied nonlinearly across participants as a function of reference IC. One possible source for the independent noises in the above model is temporal jitter. Previous studies by Pichora-Fuller and Schneider (e.g., 1991) have shown increased temporal jitter in the aged that was linked to neither audibility nor ITD. Considering temporal jitter as independent attenuated noises, as in the model above, may allow more sophisticated models of spatial hearing to account for aging and impairment.
Figure 11.
Mean IC difference (ΔIC) thresholds as a function of reference IC for younger NH (filled circles) and older HI (open circles) collapsed across ITDs from Experiment I, and modeled older HI thresholds generated from noises based on NH thresholds mixed with independent noises attenuated by 7 dB (crosses) and 9 dB (open squares). The model describes the older HI thresholds well contingent on the independent-noise attenuation chosen.
The deficits in ASW discrimination for older HI individuals resemble similar difficulties in binaural masking level difference (BMLD) tasks. Gabriel et al. (1992) found that HI performance on an interaural cross-correlation discrimination task was similar to their BMLD performance. While the current study did not test BMLD performance, the relationship of group mean thresholds for ASW discrimination to reference IC (Fig. 4) is very similar to the relationship of BMLD thresholds to the masking noise interaural cross-correlation shown in a binaural masking model (van der Heijden & Trahiotis, 1997). Studies of the BMLD that have controlled for hearing threshold also found a reduction in performance with age (Grose et al., 1994; Strouse et al., 1998). Like other previous studies of diotic vs. dichotic detection (Babkoff et al., 2002; Grose & Mamo, 2010), the deficit for discriminating dichotic (partially coherent) against diotic stimuli in the current study was related to age and not pure-tone thresholds. But this correlation to aging, which was shown in Experiments I and II, was only statistically significant for discriminating partially coherent stimuli against a diotic reference, not for discriminating partially coherent stimuli from one another. That is, the effect of age appears to only affect the discriminability of punctate vs. diffuse sounds, as found in previous studies, and not diffuse vs. more diffuse sounds.
B. Perception of ASW for the hearing impaired and aged
There were no significant differences in relative ASW of the partially coherent stimuli (IC = 0.6 and 0.8) for NH participants. Similarly, Blauert and Lindemann (1986) found no difference for NH participants in the extent - the relative area - of images drawn for partially coherent pink noise (IC = 0.5 and 0.75). For the older HI participants in the current study who did sketch images, the results showed no significant changes in the relative width of any stimuli based on IC. The older HI group perceived the diotic stimuli as being broader than the younger NH group, but also perceived the less coherent stimuli as being narrower than the younger NH group. In Experiment IIIb – the identification task – groups exhibited the same pattern of results: the most incoherent (IC = 0.6) stimuli were rated on average significantly narrower by the older HI group than the younger NH group, and the more coherent stimuli (IC = 0.9 and 1.0) were rated significantly broader by the older HI group (Fig. 10). Several listeners did not indicate spatial images at all in Experiment IIIa. These listeners were able to complete Experiment IIIb with similar responses to other older HI participants. Perhaps sketch-specific instruction could have reduced variability, but in Merimaa and Hess (2004), training did not affect the intersubject variability of young listeners’ sketches of ASW.
While the results of Experiment I and II suggest that older individuals perceive more diffuse images than younger individuals, more direct testing of this percept in Experiments IIIa and IIIb suggests that older HI individuals are less sensitive to IC. The difference between the mean results of the two groups in Experiment I could be described by modeling temporal jitter as low-level noise, a byproduct of the aging auditory system (Pichora-Fuller & Schneider, 1991). In Experiment III, ASW decreased monotonically for younger NH listeners while ASW did not vary for older HI ones. This difference would necessitate a model that includes an internal constant representation of the stimulus that was, for the older participants, less punctate, based on their responses to coherent stimuli. It is possible that the interaction between age group and ASW seen in Experiment III (Fig. 10) could be due to differences in the perceptual definition of width. The older HI listeners could have heard differences – with greater difficulty, as exhibited in Experiments I and II – but not have attributed these differences to their individual concept of source width. If that was the case, however, there should have been far greater variance across older HI listeners than exhibited (i.e., the HI-group error bars in Figs 10a & 10b).
For the azimuthal localization of sound sources, bias is the angular distance between the actual location and the average location of the responses, whereas precision is the variability in the location of responses (cf. Hartmann, 1983; Seeber, 2002). Previous studies of localization have shown that precision, but not necessarily bias, decreases with age and impairment (see Sections 1.1 & 1.2). The results of the current study suggest this decrease in precision can be construed perceptually as generally diffuse sound images where there is no sharp peak in the neural representation (i.e., a reduced coherence). That is, the increased variability or scatter in sound localization could be related to the percept of more diffuse sources. These perceptual findings may place limits on the amount of benefit older HI individuals can expect from sound-source separation strategies or de-reverberation algorithms that attempt to create coherent sound sources with hearing prostheses.
The stimuli in the current study were presented entirely through headphones. Headphone presentation has allowed the current results to be compared to previous studies on both IC discrimination (e.g., Pollack & Trittipoe, 1959) and ASW perception (e.g., Blauert & Lindemann, 1986). ASW realistically varies, however, in rooms with interaural fluctuations due to early reflections (Rakerd & Hartmann, 2010). It would be of interest to see if the ASW insensitivity remains for sources presented in the free field. The deficit shown in these experiments may be a manifestation of the same mechanism as the decreased ability of the HI in reverberant environments to use early reflections for speech-intelligibility benefit (cf. Arweiler & Buchholz, 2011). This relation to reverberant speech-intelligibility deficits would need to be tested with early reflections directly controlling ASW.
C. Conclusions
The experiments reported here converge on one hypothesis: older HI individuals do not hear punctate images. They have clear deficits in judging the apparent ASW of a sound based on its IC. The discrimination data suggest that temporal jitter along the auditory pathway, which increases with age, could result in the poorer discriminability of ASW for older individuals. The image-sketching data, however, suggest that this increased temporal jitter only plays a role in reducing sensitivity to changes in interaural coherence, not necessarily making all sounds wider. In short, ASW insensitivity can have numerous repercussions for HI individuals. Since determining an individual’s sensitivity to source width could be done analogous to the comparison of lenses at the optometrist with a few token stimuli, it could be a valuable clinical tool for tempering expectation and steering the design of future hearing prostheses.
ACKNOWLEDGEMENTS
We would like to thank Associate Editor Michael Stone and two anonymous reviewers for their helpful comments. Portions of this research were presented at the British Society of Audiology Conference, Manchester, UK, September 2011, and the International Symposium on Hearing, Cambridge, UK, July 2012. The Scottish Section of IHR is supported by intramural funding from the Medical Research Council and the Chief Scientist Office of the Scottish Government.
Footnotes
It should be noted that this method of visual analogy is based on the oscilloscope demonstrations of Licklider and Dzendolet (1948) and behavioral work of Pollack (1960).
Clarkson (1981) identified the better-ear variable pure-tone average (VPTA), computed from the three highest (worst) thresholds, as the best single audiometric metric for identifying the degree of impairment.
For the one participant with a 4-kHz pure-tone threshold of 85 dB HL, the audibility of the narrowband noise component centered at 4 kHz was ensured prior to testing using the 4-kHz narrowband output of the audiometer.
PACS numbers: 43.66.Pn, 43.66.Sr
Contributor Information
William M. Whitmer, MRC Institute of Hearing Research (Scottish Section), Glasgow Royal Infirmary, Glasgow, G31 2ER, United Kingdom
Bernhard U. Seeber, MRC Institute of Hearing Research, University Park, Nottingham, NG7 2RD, United Kingdom
Michael A. Akeroyd, MRC Institute of Hearing Research (Scottish Section), Glasgow Royal Infirmary, Glasgow, G31 2ER, United Kingdom
VI. REFERENCES
- Akeroyd M, Summerfield Q. A binaural analog of gap detection. J Acoust Soc Am. 1999;105:2807–2820. doi: 10.1121/1.426897. [DOI] [PubMed] [Google Scholar]
- Ando Y, Kurihara Y. Nonlinear response in evaluating the subjective diffuseness of sound fields. J Acoust Soc Am. 1986;80:833–836. doi: 10.1121/1.393906. [DOI] [PubMed] [Google Scholar]
- Arweiler I, Buchholz J. The influence of spectral characteristics of early reflections on speech intelligibility. J Acoust Soc Am. 2011;130:996–1005. doi: 10.1121/1.3609258. [DOI] [PubMed] [Google Scholar]
- Best V, Kalluri S, McLachlan S, Valentine S, Edwards B, Carlile S. A comparison of CIC and BTE hearing aids for three-dimensional localization of speech. Int J Audiol. 2010;49:723–732. doi: 10.3109/14992027.2010.484827. [DOI] [PubMed] [Google Scholar]
- Blauert J, Lindemann W. Spatial mapping of intracranial auditory events for various degrees of interaural coherence. J Acoust Soc Am. 1986;79:806–813. doi: 10.1121/1.393471. [DOI] [PubMed] [Google Scholar]
- Blauert J, Brueggen M, Bronkhorst A, Drullman R, Reynaud G, Pellieux L, Krebber W, Sottek R. The AUDIS catalog of human HRTFs. J Acoust Soc Am. 103:3082(A). [Google Scholar]
- Boehnke S, Hall S, Marquardt T. Detection of static and dynamic changes in interaural correlation. J Acoust Soc Am. 2002;112:1617–1626. doi: 10.1121/1.1504857. [DOI] [PubMed] [Google Scholar]
- Clark J. Uses and abuses of hearing loss classification. ASHA. 1981;23:493–500. [PubMed] [Google Scholar]
- Dobreva M, O’Neill W, Paige G. The influence of aging on human sound localization. J Neurophysiol. 2011;105:2471–2486. doi: 10.1152/jn.00951.2010. [DOI] [PMC free article] [PubMed] [Google Scholar]
- Durlach N, Gabriel K, Colburn S, Trahiotis C. Interaural correlation discrimination, II: Relation to binaural unmasking. J Acoust Soc Am. 1986;79:1548–1557. doi: 10.1121/1.393681. [DOI] [PubMed] [Google Scholar]
- Edmonds B, Culling J. Interaural correlation and the binaural summation of loudness. J Acoust Soc Am. 2009;125:3865–70. doi: 10.1121/1.3120412. [DOI] [PubMed] [Google Scholar]
- Feng A, Jones D. Localization-based grouping. In: Wang D, Brown G, editors. Computational Auditory Scene Analysis. Wiley; New York: 2006. pp. 187–207. [Google Scholar]
- Fitzgibbons P, Gordon-Salant S. Auditory temporal processing in elderly listeners. J Am Acad Audiol. 1996;7:183–189. [PubMed] [Google Scholar]
- Gabriel K, Colburn S. Interaural correlation discrimination, I: Bandwidth and level dependence. J Acoust Soc Am. 1981;69:1394–1401. doi: 10.1121/1.385821. [DOI] [PubMed] [Google Scholar]
- Gabriel K, Koehnke J, Colburn S. Frequency dependence of binaural performance in listeners with impaired binaural hearing. J Acoust Soc Am. 1992;91:336–347. doi: 10.1121/1.402776. [DOI] [PubMed] [Google Scholar]
- Gardner W, Martin K. HRTF measurements of a KEMAR. J Acoust Soc Am. 1995;97:3907–3908. [Google Scholar]
- Grose J, Poth E, Peters R. Masking level differences for tones and speech in elderly listeners with relatively normal audiograms. J Speech Hear Res. 1994;37:422–428. doi: 10.1044/jshr.3702.422. [DOI] [PubMed] [Google Scholar]
- Grose J, Mamo S. Processing of temporal fine structure as a function of age. Ear Hear. 2010;31:755–760. doi: 10.1097/AUD.0b013e3181e627e7. [DOI] [PMC free article] [PubMed] [Google Scholar]
- Hartmann W. Localization of sound in rooms. J Acoust Soc Am. 1983;74:1380–1391. doi: 10.1121/1.390163. [DOI] [PubMed] [Google Scholar]
- Hartmann W, Cho Y. Generating partially correlated noise – A comparison of methods. J Acoust Soc Am. 2011;130:292–301. doi: 10.1121/1.3596475. [DOI] [PMC free article] [PubMed] [Google Scholar]
- Herman G, Warren L, Wagener J. Auditory laterlization: Age differences in sensitivity to dichotic time and amplitude cues. J Gerontol. 1977;32:187–191. [Google Scholar]
- de villiers Keet W. The influence of early lateral reflections on the spatial impression. Proceedings of the Sixth International Congress on Acoustics; Tokyo, Japan. 1968. pp. E2–4. [Google Scholar]
- Koehnke J, Culotta C, Hawley M, Colburn H. Effects of reference interaural time and intensity differences on binaural performance in listeners with normal and impaired hearing. Ear Hear. 1995;16:331–353. doi: 10.1097/00003446-199508000-00001. [DOI] [PubMed] [Google Scholar]
- Licklider J, Dzendolet E. Oscillographic scatterplots illustrating various degrees of correlation. Science. 107:121–124. doi: 10.1126/science.107.2770.121-a. [DOI] [PubMed] [Google Scholar]
- Lorenzi C, Gatehouse S, Lever C. Sound localization in noise in normal-hearing listeners. J Acoust Soc Am. 1999a;105:1810–1820. doi: 10.1121/1.426719. [DOI] [PubMed] [Google Scholar]
- Lorenzi C, Gatehouse S, Lever C. Sound localization in noise in hearing-impaired listeners. J Acoust Soc Am. 1999b;105:3454–3463. doi: 10.1121/1.424672. [DOI] [PubMed] [Google Scholar]
- Lüddemann H, Riedel H, Kollmeier B. Electrophysiological and psychophysical asymmetries in sensitivity to interaural correlation steps. Hear Res. 2009;256:39–57. doi: 10.1016/j.heares.2009.06.010. [DOI] [PubMed] [Google Scholar]
- Mason R, Brookes T, Rumsey F. Frequency dependency of the relationship between perceived auditory source width and the interaural cross-correlation coefficient for time-invariant stimuli. J Acoust Soc Am. 2005;117:1337–1350. doi: 10.1121/1.1853113. [DOI] [PubMed] [Google Scholar]
- May B, Kimar S, Prosen C. Auditory filter shapes of CBA/CaJ mice: Behavioral assessments. J Acoust Soc Am. 2006;120:321–330. doi: 10.1121/1.2203593. [DOI] [PubMed] [Google Scholar]
- Merimaa J, Hess W. Training of listeners for evaluation of spatial attributes of sound. Proceedings of the 117th Convention of Audio Engineering Society; San Francisco, California. 2004. Preprint 6237. [Google Scholar]
- Noble W, Byrne D. A comparison of different binaural hearing aid systems for sound localization in the horizontal and vertical planes. Br J Audiol. 1990;24:335–346. doi: 10.3109/03005369009076574. [DOI] [PubMed] [Google Scholar]
- Noble W, Byrne D, Ter-Horst K. Auditory localization, detection of spatial separateness, and speech hearing in noise by hearing impaired listeners. J Acoust Soc Am. 1997;102:2343–2352. doi: 10.1121/1.419618. [DOI] [PubMed] [Google Scholar]
- Pichora-Fuller M, Schneider B. Masking level differences in the elderly: A comparison of antiphasic and time-delay dichotic conditions. J Speech Hear Res. 1991;34:1410–1422. doi: 10.1044/jshr.3406.1410. [DOI] [PubMed] [Google Scholar]
- Plenge G. Über das Problem der Im-Kopf-Lokalisation. Acustica. 1972;26:241–252. [Google Scholar]
- Pollack I, Trittipoe W. Binaural listening and interaural noise correlation. J Acoust Soc Am. 1959;31:1250–1252. [Google Scholar]
- Pollack I. Identification of visual correlational scatterplots. J Exp Psych. 1960;59:351–360. doi: 10.1037/h0042245. [DOI] [PubMed] [Google Scholar]
- Rakerd B, Hartmann W. Localization of sounds in rooms, V: Binaural coherence and human sensitivity to interaural time difference in noise. J Acoust Soc Am. 2010:3052–3063. doi: 10.1121/1.3493447. [DOI] [PMC free article] [PubMed] [Google Scholar]
- Ross B, Fujioka T, Tremblay K, Picton T. Aging in binaural hearing begins in mid-life: evidence from cortical auditory-evoked responses to changes in interaural phase. J Neurosci. 2007;27:11172–11178. doi: 10.1523/JNEUROSCI.1813-07.2007. [DOI] [PMC free article] [PubMed] [Google Scholar]
- Sato S, Ando Y. Apparent source width (ASW) of complex noises in relation to the interaural cross-correlation function. J Temporal Design Arch Environ. 2002;2:29–32. [Google Scholar]
- Seeber B. A new method for localization studies. Acustica. 2002;88:446–450. [Google Scholar]
- Steinberg J. The relation between the loudness of a sound and its physical stimulus. Phys Rev. 1925;26:507–523. [Google Scholar]
- Simon H, Aleksandrovsky I. Perceived lateral position of narrow-band noise in hearing-impaired and normal-hearing listeners under conditions of equal sensation level and sound-pressure level. J Acoust Soc Am. 1997;102:1821–1826. doi: 10.1121/1.420089. [DOI] [PubMed] [Google Scholar]
- Stallings W, Gillmore G. A note on “accuracy” and “precision. J Educ Meas. 1971;8:127–129. [Google Scholar]
- Strouse A, Ashmead D, Ohde R, Grantham D. Temporal processing in the aging auditory system. J Acoust Soc Am. 1998;104:2385–2399. doi: 10.1121/1.423748. [DOI] [PubMed] [Google Scholar]
- van der Heijden M, Trahiotis C. A new way to account for binaural detection as a function of interaural noise correlation. J Acoust Soc Am. 1997;101:1019–1022. doi: 10.1121/1.418026. [DOI] [PubMed] [Google Scholar]
- Wiggins I, Seeber B. Dynamic-range compression affects the lateral position of sounds. J Acoust Soc Am. 2011;130:3939–3953. doi: 10.1121/1.3652887. [DOI] [PubMed] [Google Scholar]
- Yost W, Dye R, Sheft S. Interaural time difference processing of broadband and narrow-band noise by inexperienced listeners. J Acoust Soc Am. 2007;121:EL103–EL109. doi: 10.1121/1.2437841. [DOI] [PMC free article] [PubMed] [Google Scholar]


