Abstract
Cytosine methylation, an epigenetic modification of DNA, is a target of growing interest for developing high throughput profiling technologies. Here we introduce two new, complementary techniques for cytosine methylation profiling utilizing next generation sequencing technology: bisulfite padlock probes (BSPPs) and methyl sensitive cut counting (MSCC). In the first method, we designed a set of ~10,000 BSPPs distributed over the ENCODE pilot project regions to take advantage of existing expression and chromatin immunoprecipitation data. We observed a pattern of low promoter methylation coupled with high gene body methylation in highly expressed genes. Using the second method, MSCC, we gathered genome-scale data for 1.4 million HpaII sites and confirmed that gene body methylation in highly expressed genes is a consistent phenomenon over the entire genome. Our observations highlight the usefulness of techniques which are not inherently or intentionally biased in favor of only profiling particular subsets like CpG islands or promoter regions.
In DNA, the methylation of cytosine at CpG dinucleotides is a modification present in many eukaryotes1. CpG methylation can be inherited through DNMT1’s “maintenance methylation” of hemimethylated sites in newly synthesized DNA and plays a role in gene transcription, embryogenesis, cancer, and other human diseases2–4. For these reasons there has been growing interest in developing technologies for high-throughput cytosine methylation profiling. CpG methylation is generally studied by one of three techniques: bisulfite sequencing, methylation-sensitive restriction enzymes, and affinity purification. Bisulfite sequencing, which converts all unmethylated cytosines to uracil (which is later recognized as thymine), is the "gold standard" of methylation profiling but can be difficult to use due to the dramatic decrease in sequence specificity as most cytosines are converted5. Methylation sensitive enzymes preferentially cut DNA based on its methylation status (typically when the recognition site is unmethylated) and, although robust, this method is limited to profiling the enzyme's recognition sites6. More recently some studies have utilized affinity purification by using antibodies to pull down methylated DNA; because this method is based on the methylcytosine density in a region, it is more effective for profiling regions which have a higher density of CpGs that are potentially methylated7–9. All three of these methods have been combined with microarrays7, 9–15 or high throughput sequencing16–18 to create high throughput methylation profiles. Many of these have been limited by choice or by design to preferentially profiling CpG islands and/or gene promoters.
The rapidly decreasing costs of next generation sequencing makes it an attractive platform for adapting and developing new profiling methods. Although whole genome bisulfite sequencing has been used with Arabidopsis17, 18, for the much larger human genome it is prohibitively expensive. Here we introduce two new, complementary technologies for high throughput cytosine methylation profiling that both utilize massively parallel sequencing19, 20. One method, which is a targeted approach, uses padlock probes designed to target locations in bisulfite treated DNA. We demonstrate the usage of these bisulfite padlock probes (BSPPs) to specifically capture and accurately profile more than 7,000 CpG sites in the ENCODE pilot project regions21 in eight different human cell lines. The second method, which uses the methylation sensitive enzyme HpaII and is thus called methyl sensitive cut counting (MSCC), was used to create a genome-scale methylation profile of a single cell line. MSCC uses a library derived from all locations cut by HpaII to profile the methylation state of 1.4 million unique locations in the human genome.
Our methylation profiles reveal a pattern of gene body methylation in the highly expressed genes of human cell lines. This builds on growing evidence for gene-body methylation in mammals9, 10, 22 and shows it to be a general feature of all highly expressed genes in human cell lines. Our results also support prior observations that genes with promoters containing an intermediate level of CpG density have the highest expression-related differences in promoter methylation.
Results
Bisulfite padlock probe design, synthesis and processing
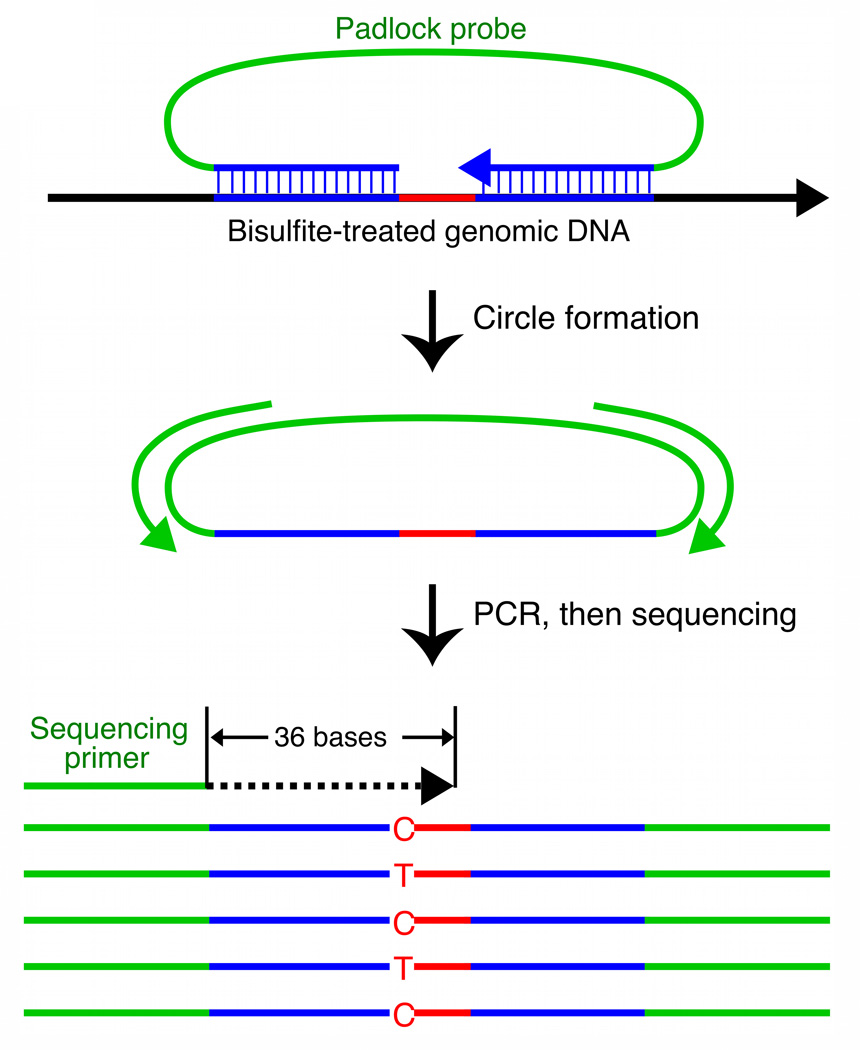
Our first technology, bisulfite padlock probes (BSPPs), is a targeted method that isolates selected locations for methylation profiling. Padlock probes are ~100 nucleotide DNA fragments designed to hybridize to genomic DNA targets in a horseshoe manner (Fig. 1a)23–25. The gap between the two hybridized, locus-specific arms of a padlock probe is polymerized and ligated to form a circular strand of DNA. These circles can then be amplified using the common "backbone" sequence that connects the two arms; this makes padlock probes highly multiplexable, with tens of thousands of probes used within a single reaction. The resulting libraries are then sequenced with a massively parallel sequencing system. We have successfully used padlock probes to specifically amplify 10,000 human exons25, and an over 10,000-fold improvement in capturing efficiency has been made (Li et al., submitted).
Figure 1. BSPP technology enabling accurate measurement of methylation levels.
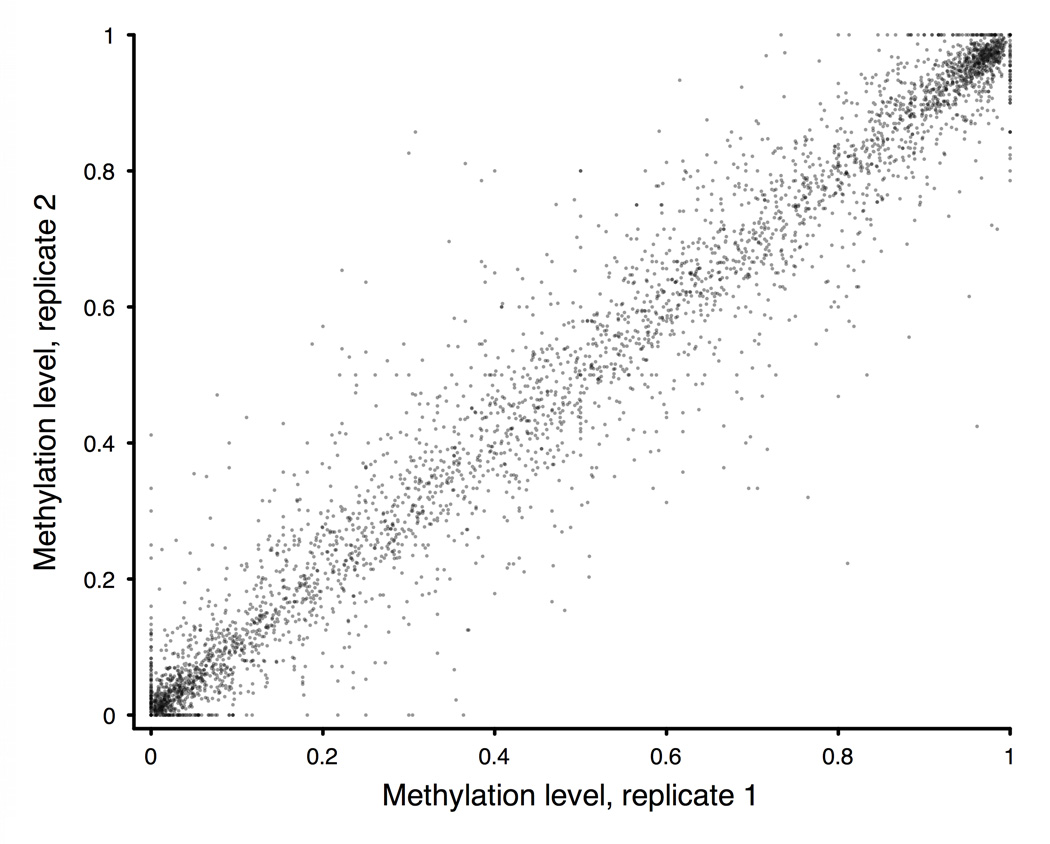
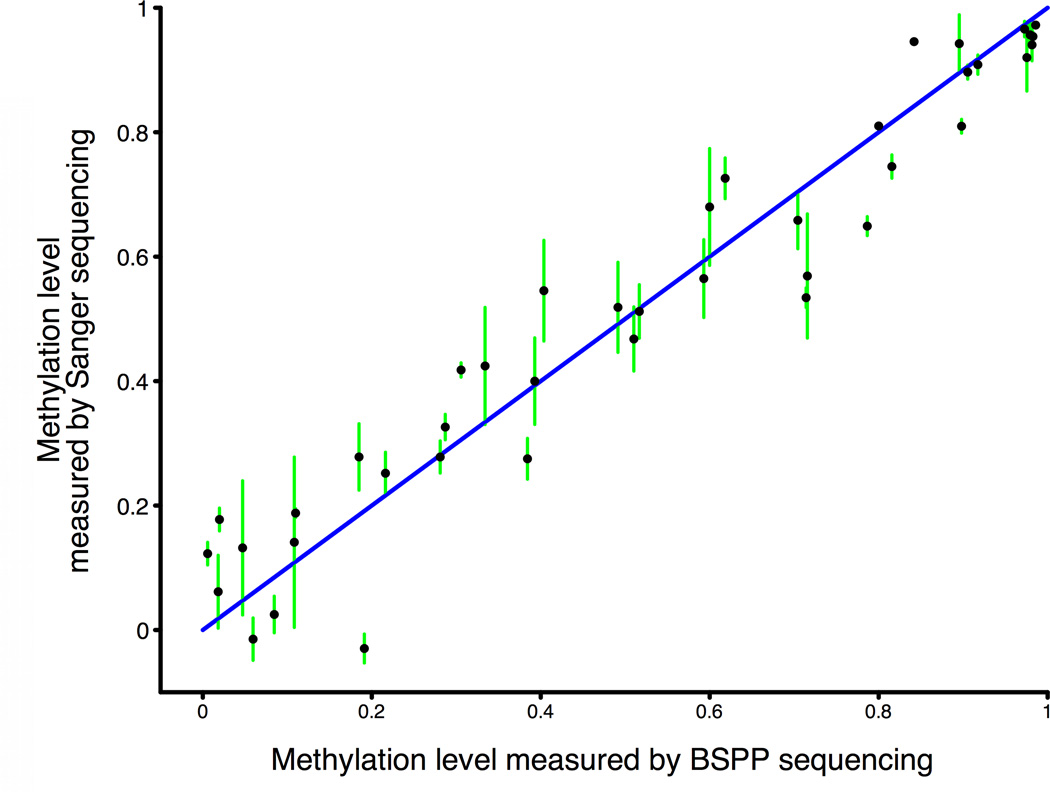
a, BSPP experimental scheme. Two hybridizing locus-specific “arms” (blue) are connected by a 50bp common “backbone” sequence (green). In this work, ~10,000 BSPPs were designed to target CpG sites in bisulfite-treated DNA with a CpG located at the 3' end of the 10 bp polymerized span (red). Circles were formed by addition of polymerase, dNTP, and ligase, and were subsequently amplified using the backbone sequence as primers. Sequencing was then performed using an Illumina Genome Analyzer with a primer matching the backbone sequence; 28 bases of arm sequence were read through before sequencing informative positions within the span (read lengths were 36 bases in total). b, Correlation of methylation level in the technical replicates (Pearson coefficient r = 0.965). c, Correlation of BSPP methylation with the methylation levels determined by bisulfite PCR followed by Sanger sequencing at 33 locations (r = 0.966). Error bars (in green) represent the standard deviation of methylation as measured by Sanger sequencing.
To apply padlock probes to profiling DNA methylation, we designed a probe set to target ~10,000 locations in a bisulfite-treated human genome (Supplementary Table 1). Bisulfite treatment converts all unmethylated cytosines to uracil, which is recognized as a thymine5. Probes were designed to target 10 base regions that contained at least one CpG for the simplicity of sequencing library construction (Fig. 1a); larger spans should be able to be captured as well25. Hybridizing arms flanking this span were designed to avoid CpGs because their methylation status (and sequence after bisulfite treatment) is unknown. This simplified the design, although it is also be possible to design probes that match all potential variants26. To avoid targeting unconverted DNA, one of the arms was required to have at least three non-CpG cytosines in the fifteen bases closest to the span.
Probes were chosen from within the ENCODE pilot project regions, which represent ~1% of the human genome and for which expression and chromatin immunoprecipitation (ChIP) data are available21. Rather than targeting promoter regions or CpG islands, we chose ~10,000 probes that best satisfied our design criteria scattered over all regions (Materials and Methods; Supplementary Table 2). Because we avoided CpGs in the hybridizing arms, these probes were actually biased against targeting CpG islands.
The probes, flanked with common primer sequences (“probe precursors”), were synthesized on a programmable microarray and cleaved into a single tube, as we previously described25. After PCR amplification, the probe precursors were subject to enzymatic processing to trim both primer ends (see Materials and Methods).
Performance of the BSPP assay
Our initial experiment used the BSPP set to investigate cytosine methylation in the GM06990 EBV-transformed B-lymphocyte cell line, a cell line also used in the ENCODE project21. The pool of ~10,000 BSPPs was hybridized with the bisulfite converted genomic DNA of GM06990 in a single reaction. After the circles were formed and subsequently amplified (Fig. 1a), we observed and isolated the expected band in the gel (Supplementary Fig. 1a). To check the specificity of the capturing, we cloned and sequenced individual library molecules – 99% (78/79) mapped to the intended target sites and were unique, illustrating the high specificity padlock probe technology can achieve despite the reduced genomic complexity after bisulfite conversion. We performed technical replicates of capturing followed by Illumina Genome Analyzer (formerly Solexa) sequencing. Although the probe observations varied widely, ~7,700 (80%) and ~6,400 (68%) sites were covered with at least 1 and 10 reads, respectively, for ~3 million reads derived from a single sequencing lane (Supplementary Fig. 1b, Supplementary Table 3). Nevertheless, both the numbers of probe observations (Supplementary Fig. 1c) and the inferred methylation levels (Fig. 1b) were highly correlated. Because of this, if reduced variance were desired, probes could be empirically divided into separate pools depending on their efficiencies26. To rule out the possibility of systemic bias, we performed traditional Sanger sequencing on 33 regions amplified from bisulfite treated DNA (Supplementary Table 4); the methylation levels determined by this method were highly correlated with the BSPP-determined methylation (Fig. 1c).
Methylation levels were bimodally distributed with most sites <20% or >80% methylated (Supplementary Fig. 2), which is consistent with previous reports27. In addition, CpGs in close proximity are known to be often co-methylated27. To investigate if co-methylation occurs at the single molecule level, we took advantage of the clonal feature of the Illumina Genome Analyzer sequencing. We found that, within probes spanning more than one CpG, sites with intermediate methylation levels (between 20% and 80%) had a positive correlation between the methylation states of neighboring CpGs on individual strands (Supplementary Fig. 3).
Correlating methylation with transcription and histone modification in ENCODE regions
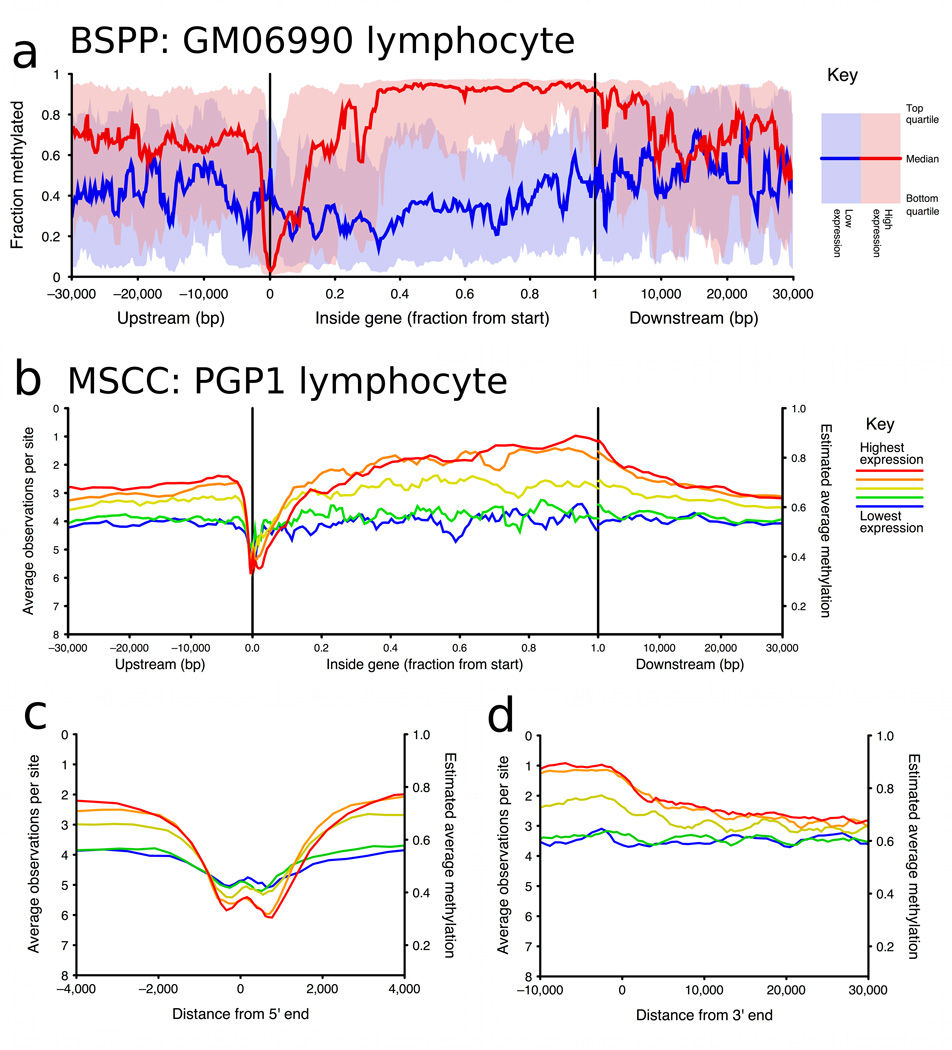
To explore the relationship between methylation and gene expression levels in the promoter region and elsewhere in the gene, we used ENCODE project gene expression data for the same cell line (GM06990) to split genes into two equal groups: “highly expressed” and “lowly expressed” genes. For each group we plotted median cytosine methylation against gene position (Fig. 2a). In the highly expressed genes we saw a pattern of low methylation in the promoter region and high methylation in the rest of the gene body. The lowly expressed genes had moderate methylation in both promoter and gene body regions.
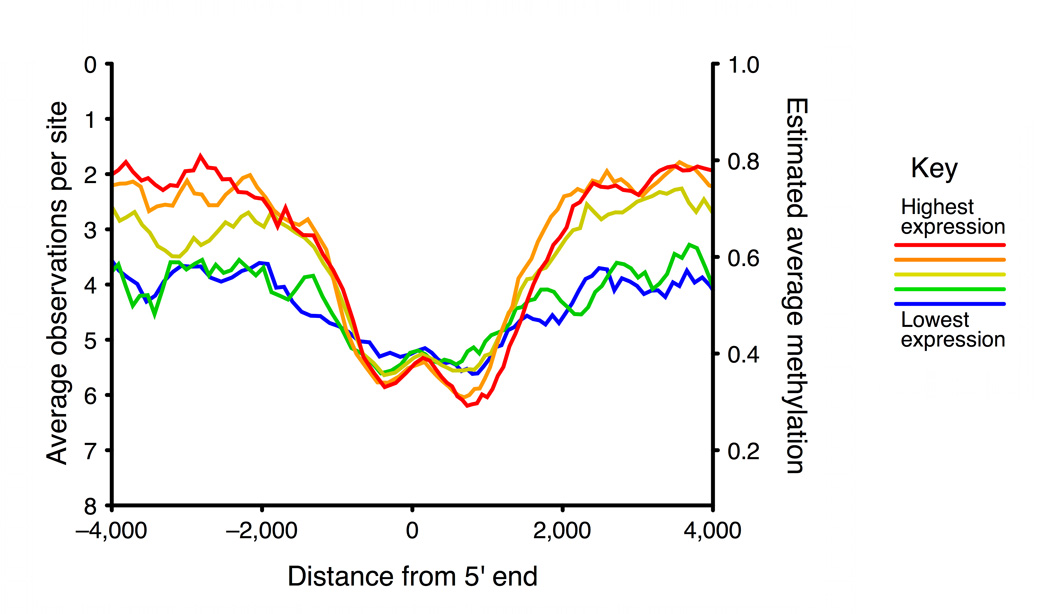
Figure 2. Methylation vs gene positions, split by gene expression level.
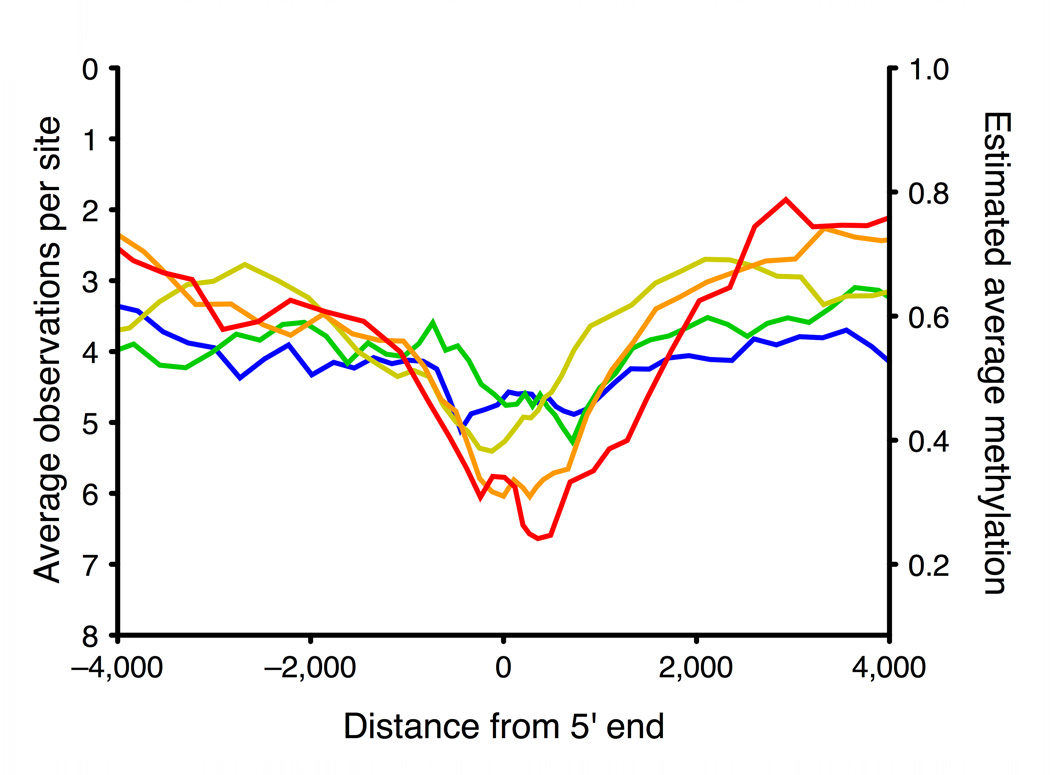
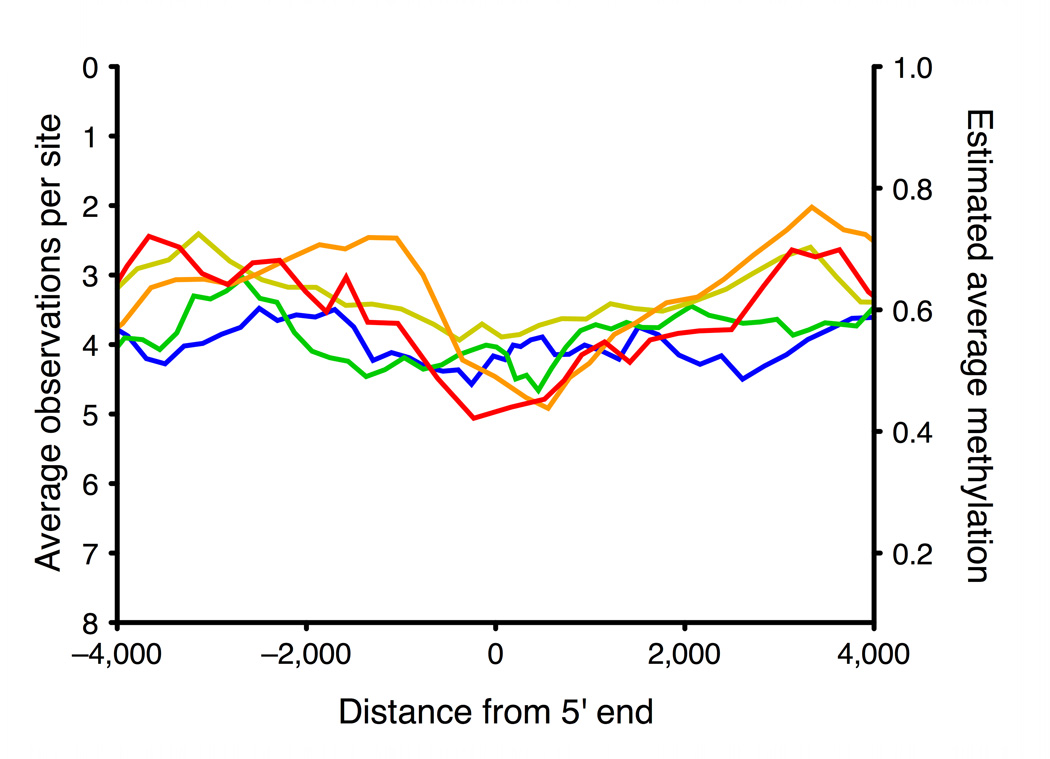
a, Running median methylation vs. gene position for high and low expression genes in ENCODE pilot regions of the GM06990 cell line (based on BSPP data). b–d are based on MSCC data and share the same key. b, Running average MSCC HpaII observations vs. gene position for all genes in the PGP1 EBV-transformed lymphoblastoid cell line, and split into five groups based on expression level. Contribution of each MSCC data point was normalized for local CpG density, MspI control counts and, for sites within the gene, for gene length. c, Running average methylation vs. position relative to transcription start site (TSS). d, Running average methylation vs. position relative to transcriptional end of genes (for genes at least 15kb in length).
Cytosine methylation is an epigenetic feature that may interact with other epigenetic features such as histone modifications. To look for correlations between DNA methylation and histone modification we compared available ChIP data21 with our methylation data obtained from the same cell line. We found cytosine methylation was correlated with H3K36 methylation and anticorrelated with H3K27 methylation (Supplementary Fig. 4). These correlations probably reflect the distribution of our probes, half of which fell within gene bodies (only 5% were within 1kb of transcription start sites). The correlations are consistent with the gene-body pattern of the histone modifications: H3K36 methylation is higher in the gene-body of highly expressed genes, while H3K27 is high in the gene-body of lowly expressed genes28.
BSPP profiling of cell lines from the Personal Genome Project
Our methylation profiling methods are, in part, developed as a pilot for studying epigenomics within the context of the Personal Genome Project (PGP), a program that hopes to deeply explore the relationship between genotype and phenotype through collection of multi-faceted biological information for individuals registered within the project29. To explore how methylation patterns vary between different cell types and different individuals, we applied the ENCODE BSPP set to several cell lines from the PGP: PGP1 and PGP9 EBV-transformed B-lymphocytes, PGP1 and PGP9 fibroblasts, and induced pluripotent stem cells (iPS) derived from PGP1 and PGP9 fibroblasts. Consistent with previous studies27, the methylation patterns of lymphoblast lines derived from different individuals were highly correlated (r = 0.85, Supplementary Fig. 5a), while the correlation between fibroblast and lymphoblast cells from the same individual was much lower (r = 0.63, Supplementary Fig. 5b). The PGP1 and two independent PGP9 iPS cell lines were hypermethylated in the ENCODE regions of ~400 genes, compared to the fibroblast line they were derived from (Supplementary Figs. 2f, 2g, 2h, 5c and 5d). This may be a general phenomenon, although further investigation is needed as we surveyed a limited set of locations and cell culturing can affect global methylation levels16. Using gene expression data that we generated, we observed that the phenomenon of gene body methylation in highly expressed genes was repeated in the PGP lymphoblast and fibroblast cell lines (Supplementary Fig. 6).
Methyl sensitive cut counting assay
Our second technology, methyl sensitive cut counting (MSCC), is a whole genome methylation profiling method. MSCC queries the sensitivity of all CCGG sites within the genome to HpaII, a methylation sensitive restriction enzyme that cuts unmethylated CCGG sequences. Methylation sensitive restriction enzymes are a common tool for studying methylation: these enzymes typically have a recognition site that contains a CpG dinucleotide and are blocked from cutting if that site is methylated6. The MSCC assay is not limited to using HpaII – it could be used with other methylation sensitive restriction enzymes to profile other, non-overlapping genome-scale sets of CpGs (Supplementary Table 5). These sets could be combined to created denser genome-scale profiles.
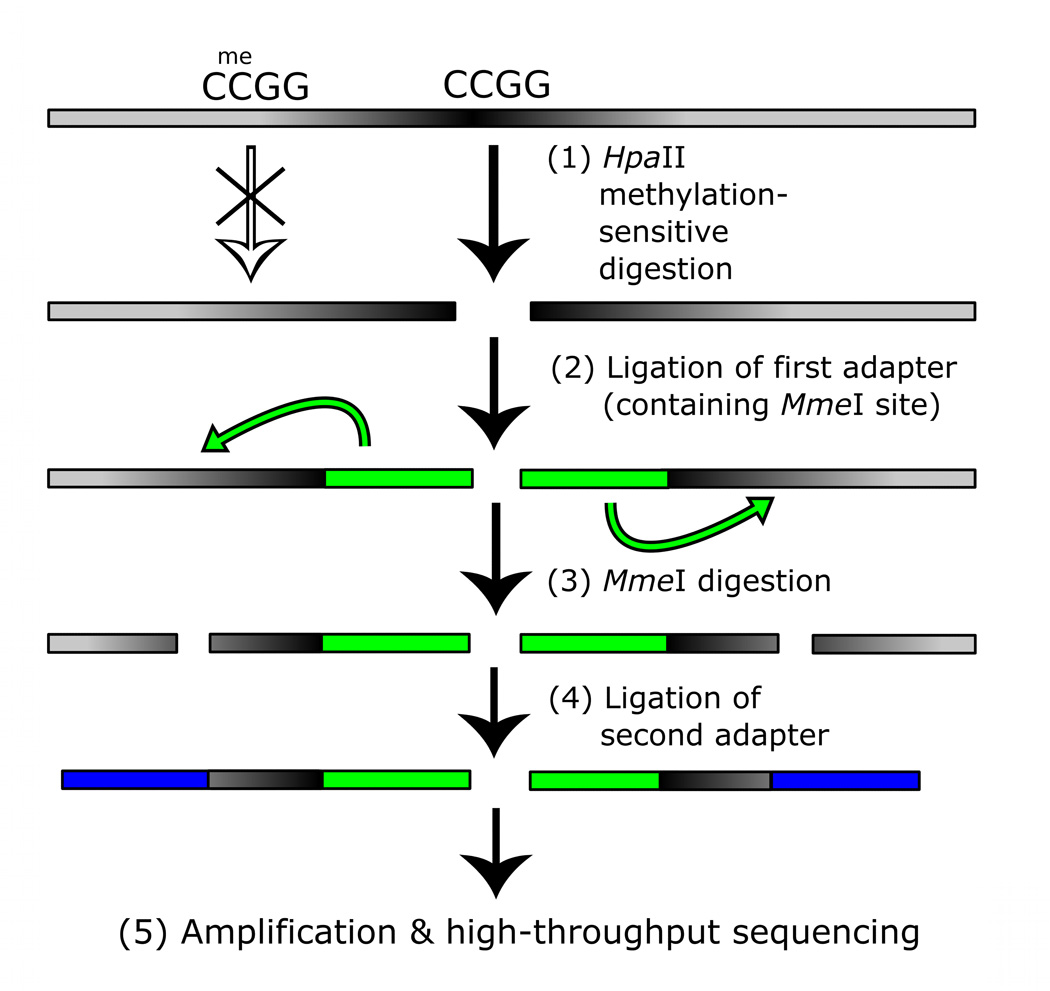
With MSCC, no choice is made for which sites are targeted – all uniquely identifiable HpaII sites are profiled. HpaII sites have a distribution similar to the distribution of all CpG dinucleotides (Supplementary Table 2), making them a good target for relatively unbiased genome-scale profiling. By generating a library of tag fragments from all cut locations and then using massively parallel sequencing to gather millions of observations of these, we can infer the methylation level by the number of times a site is observed (Fig. 3a). Sites with many vs. no reads are inferred to have low or high methylation levels, respectively. A control library was also constructed by replacing HpaII with a methylation insensitive isoschizomer, MspI. This is an additional cost, however, and our data indicates the the HpaII library alone is highly correlated with methylation at individual sites (see below).
Figure 3. MSCC technology allowing accurate estimate of methylation levels.
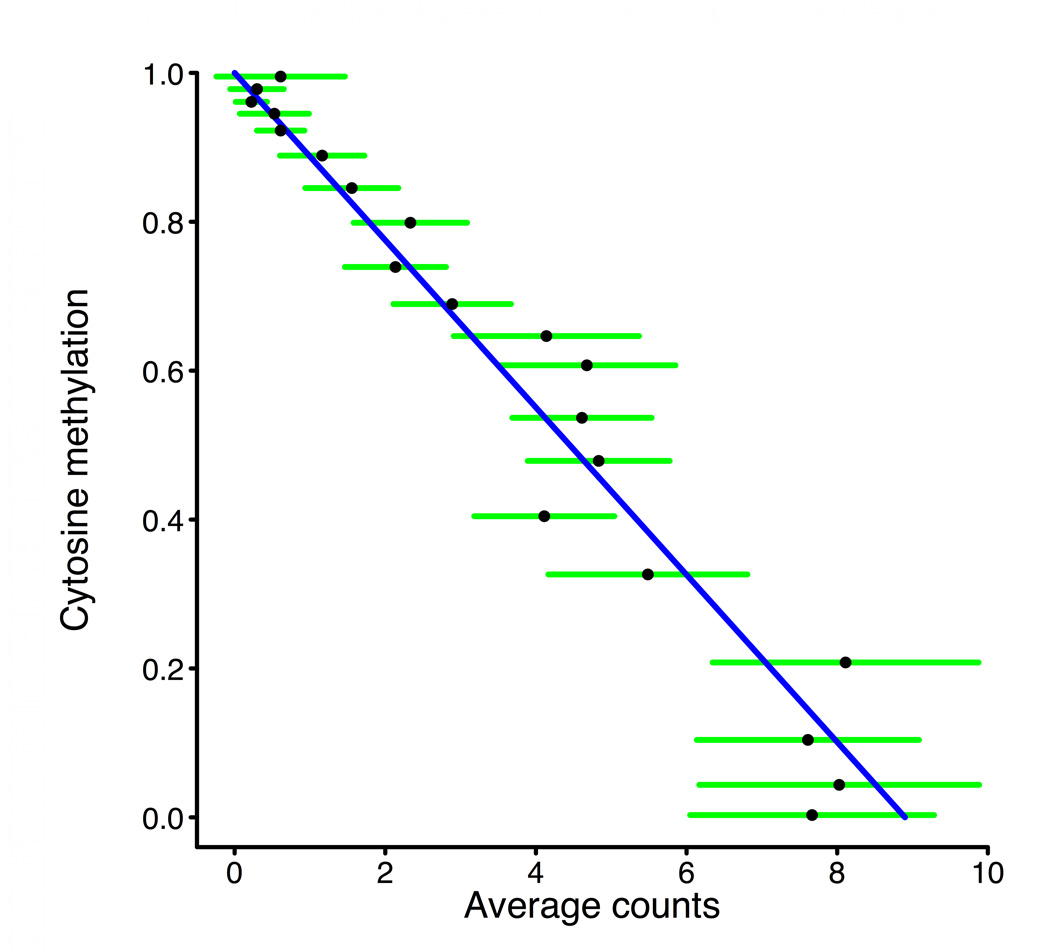
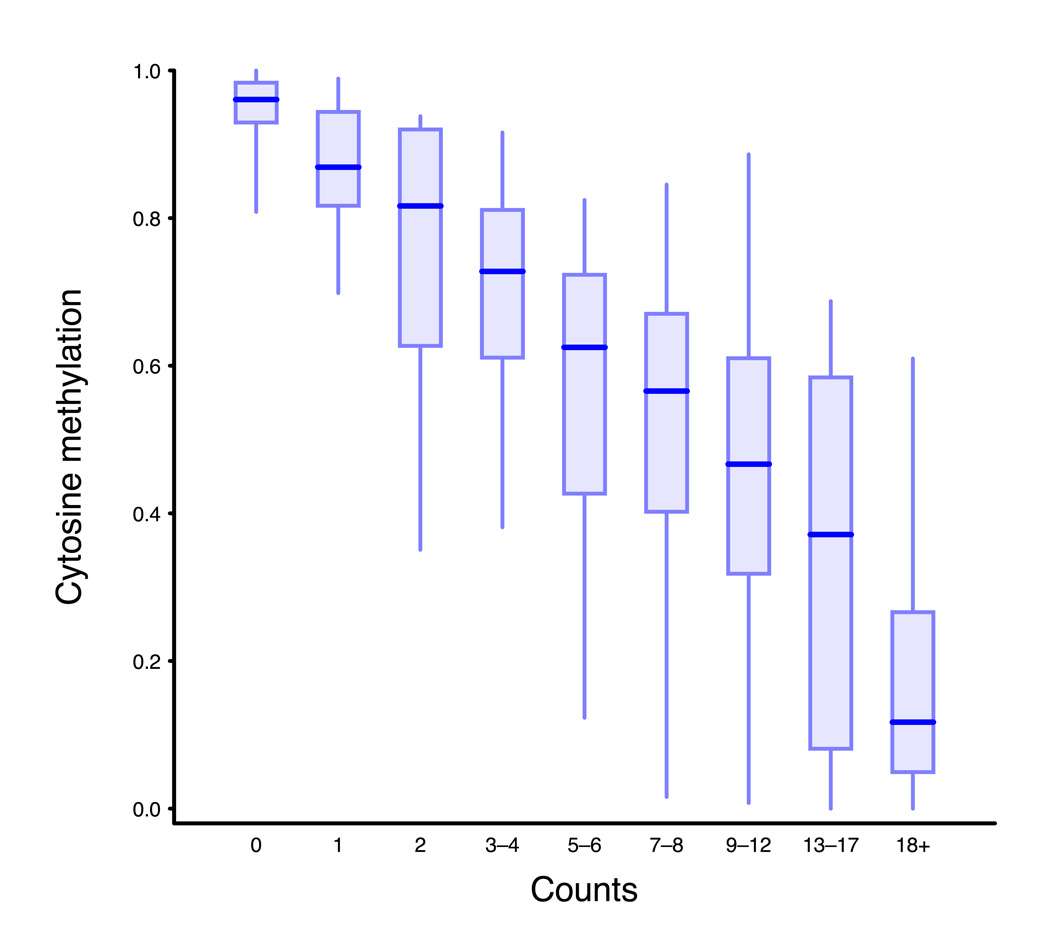
a, Scheme of generation of a methyl sensitive cut site library. (1) HpaII digestion cuts genomic DNA at all unmethylated CCGG sites only; (2) The first adapter containing an MmeI recognition site is ligated; (3) MmeI digestion cuts into the unknown genomic sequence to produce an 18–19 bp tag; (4) A second adapter is added by ligation; (5) The library is amplified and sequenced. The number of reads for a given site is correlated with the amount of digestion that occurs there and thus an indication of methylation level. b, BSPP methylation vs. MSCC counts data was grouped according to the BSPP-determined methylation levels into 20 bins, with each bin containing an equal number of data points. The mean number of counts (black points) is linearly related to the mean methylation of a bin (blue best fit line is shown). Green error bars represent the 95% confidence interval based on the standard error of the mean for bin. c, Summed MSCC counts for paired tag sites was binned according to show how well individual sites predict methylation. Horizontal bars represent median methylation as determined by BSPP, boxes represent the quartiles, and whiskers mark the 5th and 95th percentiles.
The human genome contains 2.3 million HpaII sites and each of these, if cut, can generate two possible library tags. Of the 4.6 million possible tag sequences, we considered about half (2.3 million) as sufficiently unique for use in profiling – they have more than one base difference when compared to any other possible sequence. Of the 2.3 million tags, 888,455 are from sites with two unique tags (“paired tags”) and 528,977 from sites with a single unique tag. These combine to a total of 1,417,432 CpG sites that are profiled with this method (Supplementary Table 6). Nearly half of these sites occur within genes (>18,000 genes have at least one site within them), 3.4% are within 1kb of the transcription start site (>10,000 genes have at least one site in this region), and 13.5% are within CpG islands (90% of CpG islands have at least one site within them) (Supplementary Table 2).
Methylation level accurately measured by MSCC profiling
We produced an MSCC HpaII library and MspI control library for the PGP1 EBV-transformed B-lymphocyte cell line, for which we also had BSPP and gene expression data. Libraries were sequenced with an Illumina Genome Analyzer and matched to a list of all possible tag sequences (Supplementary Table 7). We performed two technical replicates of the HpaII library that, although subject to variance according to the Poisson distribution, showed a high correlation in the number of observations for each site (r = 0.82, Supplementary Fig. 7). Because we had BSPP data for the same sample we were able to compare the methylation levels determined by BSPPs to MSCC HpaII data for 381 sites (726 individual tags) (Supplementary Fig. 8). When data is binned according to the BSPP-determined methylation levels, the average number of counts for each bin is linearly related to its methylation level (Fig. 3b). We used this to estimate average methylation levels when counts for multiple sites are averaged. BSPP methylation data can also be used to estimate methylation levels for individual sites based on MSCC HpaII counts (Fig. 3c and Supplementary Fig. 9).
MSCC counts have more noise for sites with higher levels of cutting. As a result, it is more accurate at distinguishing moderate methylation from high methylation than it is for distinguishing moderate methylation from low methylation, although deeper sequencing coverage should improve accuracy (Supplementary Table 8). In addition, preliminary data suggest that the accuracy can be improved by sequencing an “inverse library” of methylated CCGG sites, which is constructed by (1) dephosphorylating HpaII-digested fragment ends, (2) MspI digestion, and (3) ligation of MmeI-containing adapter to generate sequencing tags (Supplementary Fig. 10). In the following analyses, however, we only used the MSCC HpaII data generated from three lanes of Illumina sequencing.
Comparison of MSCC methylation data with gene expression levels and promoter types
Compared to BSPP, which analyzed several thousand data points covering ~400 genes, the MSCC technology covered 1.4 million sites distributed over the entire genome, allowing us to examine the relationship between gene expression and cytosine methylation more thoroughly. We split genes into five equal groups based on their expression levels and plotted the running average of MSCC observations vs. gene position for each (Figs. 2b, 2c, and 2d). We observed a similar pattern of low promoter methylation and high gene body methylation in high expression genes as we did in the BSPP assays (Fig. 2b; Supplementary Fig. 6a). Previous studies have indicated that gene expression may require low methylation extending several hundred bases into the gene30; consistent with this, we observed that highly expressed genes have low methylation extending to around +1kb with a valley at around 600–700 bp from the transcriptional start site (Fig. 2c). In addition, our data shows another valley upstream of transcription start. The pair of valleys is similar to the double peaks observed in H3K4 methylation and other histone modifications28 and to recent findings of bidirectional transcription at gene promoters31. At the 3’ end, highly expressed genes appear to have increased methylation running up to the end of the gene (Fig. 2d).
Previous experiments have indicated that the relationship between promoter methylation and gene expression is related to the CpG density of the promoter32. To examine this, we divided promoters into three types according to CpG content: high CpG promoters (HCPs), low CpG promoters (LCPs), and intermediate CpG promoters (ICPs). Our results, which are consistent with previous observations, provide quantitative averaged profiles of methylation vs. position for each promoter type. Although subtle expression related differences exist, on average HCPs have lower methylation (Fig. 4a) while LCPs have higher methylation (Fig. 4c) regardless of gene expression level. Our results also show that the largest expression related differences in promoter methylation are found in ICPs (Fig. 4b).
Figure 4. Promoter CpG density and methylation vs. gene expression.
a, High CpG promoters (HCP, 65% of all promoters) tend to have low methylation regardless of expression (65% of promoters). b, Intermediate CpG promoters (ICP, 16% of promoters) tend to have low methylation when highly expressed and high methylation when lowly expressed. c, Low CpG promoters (LCP, 28% of promoters) tend to have high methylation regardless of gene expression.
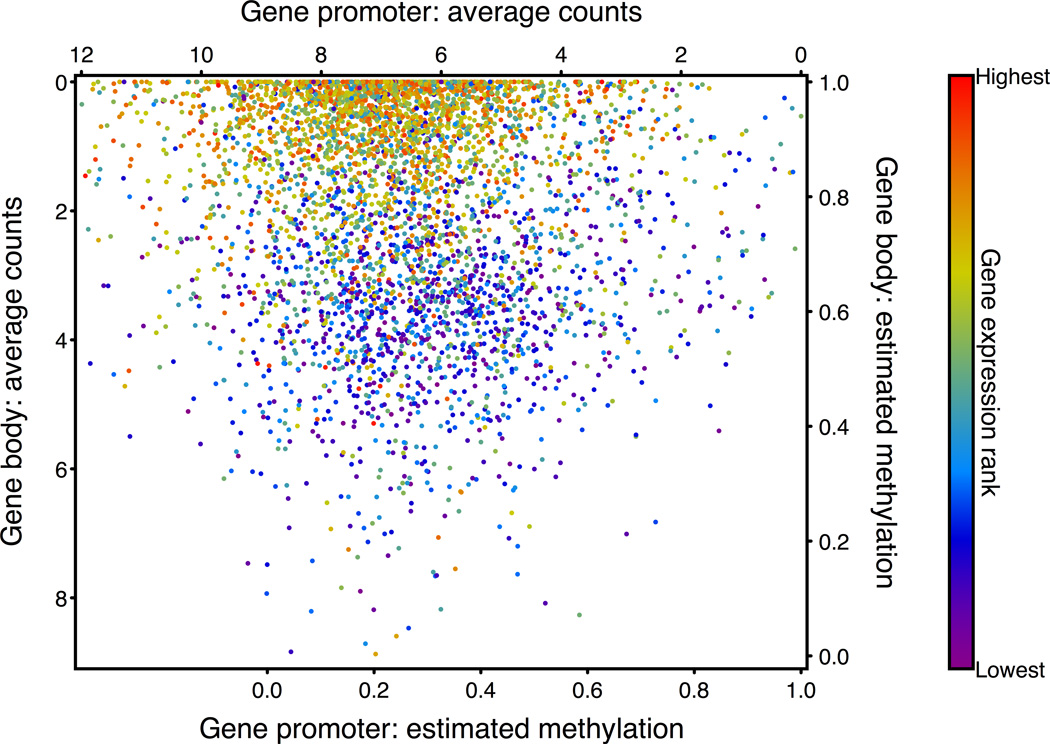
To explore how methylation information was correlated with gene expression on the level of individual genes we compared the gene promoter methylation and gene body methylation of individual genes. According to these two metrics, genes formed two clusters that corresponded to high and low expression levels (Fig. 5). This figure shows that the average gene body methylation differences observed between highly and lowly expressed genes reflects a consistent phenomenon rather than a subset of genes containing hypermethylated or hypomethylated gene bodies.
Figure 5. Methylation profiles of individual genes.
Individual genes are plotted according to the average MSCC HpaII counts found in the promoters (horizontal axis, −400 to +1000 relative to start) and gene bodies (vertical axis, between the gene end and +2000 relative to start). The color of each point reflects the expression level of that gene and points were plotted in a random order to avoid artifacts produced by non-random overlaps. Only genes with at least 10 data points in each region were used.
Discussion
The rapid development of cheaper, massively parallel sequencing technologies33 is opening the way for new strategies for studying biological processes34–36, including epigenetic features like DNA methylation16–18. These methods are making high throughput sequencing a convergent platform that is increasingly available, and the digital aspect of sequencing makes techniques inherently more quantitative, accurate and reproducible. BSPP and MSCC are two complementary methods that take advantage of the power of new sequencing technologies to profile cytosine methylation at single-base resolution in targeted and genome-scale surveys.
In contrast to other restriction enzyme based profiling methods10, 11, 15, MSCC does not undergo size selection and so, by design, its efficiency and accuracy for profiling each site is not influenced by local sequence characteristics (e.g., recognition site density). MSCC also takes advantage of high throughput sequencing technology, which is rapidly dropping in cost, and becomes more accurate when more sequencing is performed. Reduced representation bisulfite sequencing (RRBS) is another method using massively parallel sequencing to profile methylation at a subset of sites16. However, it cannot be designed to target specific segments (as BSPP can) and is biased by profiling a scattered set of genomic segments with high CpG density (unlike MSCC, which is less biased and more evenly distributed).
Gene body methylation has been observed in Arabidopsis12, 13, 17, 18, where it is associated with active genes. In mammals there have long been known some genes for which methylation inside the gene was positively correlated to expression37, and there is now growing evidence for this being a general phenomenon. Gene body methylation has been observed in the active human X chromosome when compared to the inactive X10, hypomethylated sites in the gene body have been associated with low expression genes in cancer cell lines22, and methylated of CpG-rich sites in gene bodies have been associated with higher gene expression in human B cells9. A general phenomenon of gene body methylation in highly expressed genes is strongly supported by our data from both BSPP and MSCC assays. Gene body methylation has been hypothesized to suppress spurious initiation of transcription within active genes in Arabidopsis12, 13 and a similar function may exist in mammals1.
CpG islands and promoters have been the preferred target of many studies and have, in the past, guided the design of many methylation profiling experiments14, 16, 32, 38. In light of our observation of gene body methylation, of differential methylation in ICPs32, and of other evidence for differential methylation in regions outside CpG islands and promoters15, less biased profiling methods are powerful in that they help us discover aspects of methylation that might otherwise have been missed. As DNA sequencing costs drop, tools like BSPP and MSCC can be readily applied to study the epigenomic changes associated with developmental stages, environmental changes, and disease states.
Materials and Methods
Cell lines, RNA and genomic DNA, expression profiling, and bisulfite treatment
Genomic DNA of GM06990 (a HapMap/ENCODE sample) was obtained from Corriell Cell Repository. With the approval of Harvard Medical School’s Institutional Review Boards, blood and skin biopsies were obtained from donors of the Personal Genome Project. The EBV-transformed B-lymphocyte cell lines and the derivative genomic DNA for donors PGP1 (GM20431) and PGP9 (GM21833) were generated and acquired from Coriell Cell Repository. Genomic DNA obtained directly from Corriell was used for methylation analysis of these lines, cultured cell lines were used for gene expression profiling. The primary fibroblast lines for PGP1 and PGP9 was generated by and obtained from Brigham Women’s Hospital. The cultured cell line was used for both genomic DNA and gene expression profiling.
The PGP1 iPS line and two PGP9 iPS cell lines were derived by infecting primary human fibroblasts of PGP1 and PGP9 with highly concentrated retroviral OCT3, KLF4, SOX2 and c-MYC particles39. The infected cells were trypsinized onto a feeder layer after 4 days and maintained in hES median (KO-DMEM (Invitrogen), 20% KO-SR (Invitrogen), 1X L-glutamine (Gibco), 1× MEM NEAA (Gibco), 1× pen/strep (Gibco), 55µM mercaptoethanol and 10 ng/ml bFGF). The iPS colonies were identified by their characteristic morphology after 3–4 weeks.
Immortalized lymphocytes were cultured in RPMI-1640 medium (Invitrogen) with 10% FBS (Invitrogen) and 2mM L-Glutamine (Invitrogen). Primary fibroblasts were cultured in DMEM/F12 medium (Invitrogen) with 15% FBS and 10 ng/µl EGF. Human iPS cell lines were grown on a feeder layer of mouse embryonic fibroblasts (Global Stem) in hES media, and mechanically separated from mouse cells prior to DNA/RNA extraction.
Genomic DNAs and total RNAs were extracted with AllPrep DNA/RNA/Protein Mini Kit (Qiagen). RNA gene expression profiling was done using Illumina’s bead array technology through the service provided by Harvard Partner Center for Genetics and Genomics. Bisulfite treatment was performed using the EZ DNA Methylation-Gold Kit (Zymo Research). Typical yield was 50–75% after bisulfite conversion.
Bisulfite padlock probe design and synthesis
Files for genomic sequence for the ENCODE pilot project regions was obtained from UCSC. Potential locations were chosen from nonrepetitive sequence containing 10 bases with a 5’ CpG flanked by least 20 bases of CpG-free flanking sequence on each side. Flanking “arm” sequences were designed for either bisulfite-treated strand, up to 28 bases in length, avoiding CpGs and targeting a Tm range of 50–55°C. The “ligation arm” was required to contain at least 3 non-CpG cytosines, and a guanine content of at least 20% was required of both arms. Probes were then selected to optimize uniqueness measurements based on 15mer frequencies and BLAST searches for near matches. To avoid self-hybridization, no overlap between probes was allowed in the final set. Final probe sequences were 106bp in length: two arms 28bp long (random sequence to 28bp if necessary) and a 50bp common “backbone” sequence. The final set of 9,552 probe sequences and locations as well as number of observations and methylation estimates from each sample is provided in Supplementary Table 1.
Probes were synthesized using a programmable microarray (Agilent technologies) as 150bp oligos containing common end sequences. These were cleaved off and collected in a single tube with an estimated concentration of 0.18 fmol/species. To amplify, we took 1% of the oligos and performed real time PCR, monitoring the amplicon in a 100µl reaction assembled with Platinum Taq supermix, 50pmol of each primer, and 0.5× SYBR green. One of the primers was designed to contain phosphorothioates between the first four 5’ bases and a 3’ uracil. The other primer contained the sequence “GATC” at the 3’ end. The PCR program was: 95°C for 5 min, 15 cycles of 95°C 30 sec / 58°C 1 min / 72°C 1 min, and finally 72°C for 5 min. The PCR product was purified with Qiagen PCR purification kit and quantified. Using a 96-well plate, a total of 9.6 ml PCR reaction was set up with 25 fmol template along with Platinum Taq supermix, 4.8 nmol of each primer, and 0.5× SYBR Green. The same PCR program was used. PCR products were there purified by phenol:chloroform followed by Qiagen PCR purification kit and a total of 37 µg of DNA was obtained.
The PCR product was split into eight reactions with 10 units of lambda exonuclease (NEB) in 1× lambda exonuclease reaction buffer and incubated at 37°C 45 min then 75°C 15 min. After being purified with QiaQuick coloumns the ssDNA was quantified with Nanodrop to be 33 ng/µl in 200 µl total. This was split into four tubes, each of which was assembled with 50 µl of ssDNA (33 ng/µl), 6 µl of 10× DpnII reaction buffer, and 2 µl of 100 uM “guide oligo” designed to hybridize to the 3’ end of the ssDNA and ending in “GATCNN”. The mixture was heated to 95°C for 5 min, followed by a ramp to 60°C at 0.1C / sec, 60C for 10 min, then 37C for 1 min. Into each tube, 5 µl of DpnII (10 units/µl) (NEB) and 5 µl of USER enzyme (1 unit/µl) (NEB) were added and these were incubated at 37°C for 3 hours. The final product was loaded into 6% TBE Urea precast polyacrylamide gels (Invitrogen) and the desired band was cut and purified. The final concentration of padlock probes was quantified on a gel to be 9 ng/µl, which is 257 nM (27 pM for each of 9,552 species).
CpG padlock capturing and sequencing library construction
1 µg (~ 0.5 amol of haploid) bisulfite-treated genomic DNA was assembled in a 15 µl reaction with 1× Ampligase buffer and 33.5 ng (~ 1 pmol) of probes. The reaction was incubated at 95°C for 10 min, ramped to and held at 64°C for 5 hours, then 65°C for 5 hours, then 60°C for 24 hours. At 60°C we added the gap filling and sealing mix: 2 µl of Ampligase storage buffer containing 0.5 pmol of dNTPs, 2 units Taq Stoffel fragment (Applied Biosystems), and 2.5 units Ampligase (Epicenter). The reaction was then incubated at 60°C for 2 hours, then cycled 5 times with 95°C for 2 min / 60°C for 5 hours. The temperature was then lowered to 37°C and 2 µl of Exonuclease I (20 units/µl) (USB) and 2 µl Exonuclease II (200 units/µl) (USB) were added. The reaction was incubated at 37°C for 2 hours followed by 94°C for 5 min.
The circularized probes were amplified using primers matching the backbone sequences in two 100 µl reactions containing 10 µl of the above reaction product, 50 µl of 2× iQ SYBR Green supermix (Bio-Rad), and 40 pmol each primer. Real time PCR was used to monitor the reaction, which used this program: 96°C 3 min, 5 cycles of 96°C 15 sec / 60°C 30 sec / 72°C 30 sec, then 13 cycles of 96°C 15 sec / 72°C 1 min / 72°C 1 min, then 72°C for 5 min. A 6% TBE polyacrylamide gel was used to purify the band containing the final library molecules.
BSPP library sequencing and analysis
Libraries were diluted to 10 nM and each was sequenced with one lane of an Illumina Genome Analyzer. Reads were matched with BLAST to a custom database containing the predicted reads, with CpG cytosines replaced with “N”, and accepted only if they had no mismatches in the 10 bp span (except the masked CpG cytosines) and not more than three mismatches elsewhere. Methylation was determined by the number of “C” reads out of all reads for a given location.
To validate methylation levels determined by padlock probes we designed primers targeting 33 of the profiled locations in bisulfite treated DNA, performed PCR amplification and Sanger sequencing of the PCR product. The methylation level of each site was determined using the ratio of “T” peak at the target location compared to neighboring non-CpG “T” peaks, with peak height determined using PeakPicker software40. This is similar to the principle applied in the commercially available software ESME41. Because we performed multiple sequencing reactions and from both directions, multiple estimates were combined to get the average and standard deviation values we plotted for each site.
RNA expression data was gathered using the ENCODE project PolyA+ RNA signal track downloaded from UCSC. Using scores for regions annotated as exons by RefGene, median values were taken to represent gene expression level. To construct average gene graphs, each methylation data point was assigned position information according to its location relative to nearby genes: a fractional value if within a gene, or bp if upstream or downstream. The running median and quartiles were plotted.
Histone modification data was acquired from Sanger ChIP data downloaded from UCSC. To look for correlations, raw ChIP scores vs. methylation were plotted along with the running median and quartiles. Gene profiles of histone modifications were also created as done for methylation data.
Methyl sensitive cut counting (MSCC) library creation
Two custom adapters were created for MSCC, each composed of two oligonucleotides ordered from IDT. “Adapter A” contains an 5’ MmeI recognition site and 5’ CG overhang, “adapter B” contains a 3’ NN overhang.
To construct the MSCC HpaII library, 2 µg of PGP 1 lymphocyte gDNA were assembled into a 100 µl reaction with 20 units HpaII (NEB) in 1× NEBuffer 1, incubated at 37°C 2 hours, then 65°C 20 min. To this was added 1.66 µl of 10 µM adapter A, 12 µl 10 mM ATP, and 120 units T4 DNA ligase (NEB). This was incubated at 16°C 4 hours, then 65°C 15 min. Ethanol precipitation was performed and DNA was resuspended to 50 µl with a reaction mixture containing 8 units Bst DNA polymerase fragment (NEB), 200 µM dNTP, and 1× thermopol buffer (NEB). This was incubated at 50°C for 20 min, then 85°C for 20 min. Ethanol precipitation was performed again, and the pellet was resuspended to 50ul with a reaction mixture containing 2 units MmeI (NEB), 50 µM SAM and 1× NEBuffer 4. This was incubated at 37°C for 2 hours, then 80°C for 20 min. To this was added 1.66 µl of 10 µM adapter B, 6 µl 10mM ATP, and 3 µl T4 DNA ligase, and the mixture was incubated at 16°C for 4 hours, then 65°C for 15 min.
The mixture was run on a 6% non-denaturing TBE polyacrylamide gel (Invitrogen) and the target band at ~140 bp was purified. PCR was then performed on ~80% of this purified sample using primers matching the sequences of adapter A and adapter B. The assembled mixture was 100 µl containing 500 nM of each primer, 200 µM dNTPs, 1× HF buffer and 2 units iProof (Bio-Rad) and run with the cycle: 98°C for 30 sec, 8 cycles of 98°C 10 s / 67°C 15s / 72°C 15s, then 72°C for 5 min. PCR product was purified with QiaQuick PCR clean-up kit.
The MspI control library was constructed in the same manner as the HpaII library, with the following changes: (1) in the first step 40 units of MspI (NEB) were used in place of HpaII and NEBuffer 2 was used instead of NEBuffer 1; and (2) no amplification was done after gel purification.
The “inverse library” was constructed in this manner: HpaII digestion was performed as done in the HpaII library. After this, 10 units Antarctic Phosphatase (NEB) and 11ul 10× Antarctic Phosphatase Buffer (NEB) were added to the mixture, which was then incubated at 37°C for 1 hour, and 65°C for 15 min. DNA was purified with phenol:chloroform followed by ethanol precipitation. The DNA was then resuspended and treated in the same manner as the MspI control library.
MSCC sequencing and read placement
In total, three lanes of sequencing were performed using an Illumina Genome Analyzer: two for the first technical replicate and one for the second technical replicate. These reads each contained sequence from the adapters and an 18–19 bp “tag” derived from genomic sequence.
To match sequences, a list of all possible tags was created from all CCGG sites in the human genome (hg18, downloaded from UCSC). Tags were considered “unique” (later used for profiling) if no identical or single-mismatch tags existed, the neighboring HpaII site was at least 40bp distant, and there were no conflicting MmeI recognition sites. An in house program was used to find all tag matches within 0, 1, or 2 single base distances. Reads were accepted if they were an exact match and no single mismatches could be made, or if there was no exact match, a single mismatch and no double mismatch matches existed. The number of times a particular location was matched by a read is it’s “counts” or “observations”, and these are provided in Supplementary Table 7.
MSCC data analysis
To validate MSCC data we compared it with BSPP data collected for a set of 381 shared CpG locations (726 total tags) to get “counts vs. methylation” information. These data points were binned according to methylation to form 20 bins with 36 or 37 data points each and the average counts vs. average methylation was plotted. We expect average counts to be linearly related to methylation with the equation: methylation = a * counts – 1. A best fit for this equation to the average data points was produced with a = −0.1124. This was used to infer methylation when plotting average counts information.
Positions relative to genes for each MSCC site were calculated as before, using the RefGene list from UCSC. For multiple possible starts/ends, only the first entry was used. Using expression data genes were split into five equally sized groups based on gene expression levels. Running averages of MSCC counts were made for each graph: an interval of 5000 data points for Fig. 2b, an interval of 5000 data points and 500bp minimum window size for 2c and 2d and 500 data points with 500bp minimum and 2000bp maximum windows for Fig. 3. Counts were normalized for local CpG density (surrounding 200bp), for MspI control library counts, and, for the in-gene locations in Fig. 2b, for gene length.
To analyze promoters based on CpG density, promoters were split into three types based on CpG density. Looking within the interval of −0.5kb to +2kb relative to transcription start (based on refGene annotation): high CpG promoters (HCPs) contain a 500bp interval with a GC content of at least 0.55 and a CpG observed/expected ratio of at least 0.75, low CpG promoters (LCPs) contained no 500bp interval with a CpG observed/expected ratio of at least 0.48, and all remaining promoters were defined as intermediate CpG promoters (ICPs). Of 17,546 promoters analyzed, 11,445 (65%) were defined as HCP, 2,849 (16%) were defined as ICP, and 3,252 were defined as LCP (28%).
Methylation profiles for individual genes were created by finding average MSCC counts in the promoter region (defined as −400 to +1000bp) and in the gene body (defined as +3000bp to the end). Only genes with at least 10 MSCC data points in each region were plotted.
Supplementary Material
Acknowledgements
We thank Kun Zhang for discussion throughout this work; Wei Lin for help with computational design; Andrew Chess and Ravid Straussman for discussion and critical reading of the manuscript; Harvard Biopolymers Facility for Solexa sequencing; and Harvard Partners Center for Genetics and Genomics for gene expression profiling. This work was supported by the NHGRI-Centers of Excellence in Genomic Science (to G.M.C.).
Footnotes
Author Contributions
M.P.B., J.B.L., and G.M.C. conceived the study, designed the research and wrote the manuscript. M.P.B. and J.B.L. performed experiments and data analysis. Y.G. and B.X. carried out initial Solexa sequencing. J.L. helped with culturing cell lines and isolating DNA/RNA. E.L. synthesized the padlock oligos. I.-H.P. and G.Q.D. generated the iPS cell lines.
Completing Interests Statement
E.L. is an employee of Agilent Technologies, and G.M.C. is involved in 8 next generation sequencing companies.
References
- 1.Suzuki MM, Bird A. DNA methylation landscapes: provocative insights from epigenomics. Nat Rev Genet. 2008;9:465–476. doi: 10.1038/nrg2341. [DOI] [PubMed] [Google Scholar]
- 2.Goll MG, Bestor TH. Eukaryotic cytosine methyltransferases. Annu Rev Biochem. 2005;74:481–514. doi: 10.1146/annurev.biochem.74.010904.153721. [DOI] [PubMed] [Google Scholar]
- 3.Feinberg AP, Tycko B. The history of cancer epigenetics. Nat Rev Cancer. 2004;4:143–153. doi: 10.1038/nrc1279. [DOI] [PubMed] [Google Scholar]
- 4.Jiang YH, Bressler J, Beaudet AL. Epigenetics and human disease. Annu Rev Genomics Hum Genet. 2004;5:479–510. doi: 10.1146/annurev.genom.5.061903.180014. [DOI] [PubMed] [Google Scholar]
- 5.Clark SJ, Harrison J, Paul CL, Frommer M. High sensitivity mapping of methylated cytosines. Nucleic Acids Res. 1994;22:2990–2997. doi: 10.1093/nar/22.15.2990. [DOI] [PMC free article] [PubMed] [Google Scholar]
- 6.Bird AP, Southern EM. Use of restriction enzymes to study eukaryotic DNA methylation: I. The methylation pattern in ribosomal DNA from Xenopus laevis. J Mol Biol. 1978;118:27–47. doi: 10.1016/0022-2836(78)90242-5. [DOI] [PubMed] [Google Scholar]
- 7.Keshet I, et al. Evidence for an instructive mechanism of de novo methylation in cancer cells. Nat Genet. 2006;38:149–153. doi: 10.1038/ng1719. [DOI] [PubMed] [Google Scholar]
- 8.Cross SH, Charlton JA, Nan X, Bird AP. Purification of CpG islands using a methylated DNA binding column. Nat Genet. 1994;6:236–244. doi: 10.1038/ng0394-236. [DOI] [PubMed] [Google Scholar]
- 9.Rauch TA, Wu X, Zhong X, Riggs AD, Pfeifer GP. A human B cell methylome at 100-base pair resolution. Proc Natl Acad Sci U S A. 2009;106:671–678. doi: 10.1073/pnas.0812399106. [DOI] [PMC free article] [PubMed] [Google Scholar]
- 10.Hellman A, Chess A. Gene body-specific methylation on the active X chromosome. Science. 2007;315:1141–1143. doi: 10.1126/science.1136352. [DOI] [PubMed] [Google Scholar]
- 11.Khulan B, et al. Comparative isoschizomer profiling of cytosine methylation: the HELP assay. Genome Res. 2006;16:1046–1055. doi: 10.1101/gr.5273806. [DOI] [PMC free article] [PubMed] [Google Scholar]
- 12.Zhang X, et al. Genome-wide high-resolution mapping and functional analysis of DNA methylation in arabidopsis. Cell. 2006;126:1189–1201. doi: 10.1016/j.cell.2006.08.003. [DOI] [PubMed] [Google Scholar]
- 13.Zilberman D, Gehring M, Tran RK, Ballinger T, Henikoff S. Genome-wide analysis of Arabidopsis thaliana DNA methylation uncovers an interdependence between methylation and transcription. Nat Genet. 2007;39:61–69. doi: 10.1038/ng1929. [DOI] [PubMed] [Google Scholar]
- 14.Bibikova M, et al. High-throughput DNA methylation profiling using universal bead arrays. Genome Res. 2006;16:383–393. doi: 10.1101/gr.4410706. [DOI] [PMC free article] [PubMed] [Google Scholar]
- 15.Irizarry RA, et al. The human colon cancer methylome shows similar hypo- and hypermethylation at conserved tissue-specific CpG island shores. Nat Genet. 2009;41:178–186. doi: 10.1038/ng.298. [DOI] [PMC free article] [PubMed] [Google Scholar]
- 16.Meissner A, et al. Genome-scale DNA methylation maps of pluripotent and differentiated cells. Nature. 2008;454:766–770. doi: 10.1038/nature07107. [DOI] [PMC free article] [PubMed] [Google Scholar]
- 17.Lister R, et al. Highly integrated single-base resolution maps of the epigenome in Arabidopsis. Cell. 2008;133:523–536. doi: 10.1016/j.cell.2008.03.029. [DOI] [PMC free article] [PubMed] [Google Scholar]
- 18.Cokus SJ, et al. Shotgun bisulphite sequencing of the Arabidopsis genome reveals DNA methylation patterning. Nature. 2008;452:215–219. doi: 10.1038/nature06745. [DOI] [PMC free article] [PubMed] [Google Scholar]
- 19.Bentley DR, et al. Accurate whole human genome sequencing using reversible terminator chemistry. Nature. 2008;456:53–59. doi: 10.1038/nature07517. [DOI] [PMC free article] [PubMed] [Google Scholar]
- 20.Shendure J, et al. Accurate multiplex polony sequencing of an evolved bacterial genome. Science. 2005;309:1728–1732. doi: 10.1126/science.1117389. [DOI] [PubMed] [Google Scholar]
- 21.Birney E, et al. Identification and analysis of functional elements in 1% of the human genome by the ENCODE pilot project. Nature. 2007;447:799–816. doi: 10.1038/nature05874. [DOI] [PMC free article] [PubMed] [Google Scholar]
- 22.Shann YJ, et al. Genome-wide mapping and characterization of hypomethylated sites in human tissues and breast cancer cell lines. Genome Res. 2008;18:791–801. doi: 10.1101/gr.070961.107. [DOI] [PMC free article] [PubMed] [Google Scholar]
- 23.Nilsson M, et al. Padlock probes: circularizing oligonucleotides for localized DNA detection. Science. 1994;265:2085–2088. doi: 10.1126/science.7522346. [DOI] [PubMed] [Google Scholar]
- 24.Hardenbol P, et al. Multiplexed genotyping with sequence-tagged molecular inversion probes. Nat Biotechnol. 2003;21:673–678. doi: 10.1038/nbt821. [DOI] [PubMed] [Google Scholar]
- 25.Porreca GJ, et al. Multiplex amplification of large sets of human exons. Nat Methods. 2007;4:931–936. doi: 10.1038/nmeth1110. [DOI] [PubMed] [Google Scholar]
- 26.Deng J, et al. Digital DNA methylation analysis of stem cell reprogramming by targeted bisulfite sequencing. Nat Biotechnol. 2009;27 doi: 10.1038/nbt.1530. unknown. [DOI] [PMC free article] [PubMed] [Google Scholar]
- 27.Eckhardt F, et al. DNA methylation profiling of human chromosomes 6, 20 and 22. Nat Genet. 2006;38:1378–1385. doi: 10.1038/ng1909. [DOI] [PMC free article] [PubMed] [Google Scholar]
- 28.Barski A, et al. High-resolution profiling of histone methylations in the human genome. Cell. 2007;129:823–837. doi: 10.1016/j.cell.2007.05.009. [DOI] [PubMed] [Google Scholar]
- 29.Church GM. The personal genome project. Mol Syst Biol. 2005;1 doi: 10.1038/msb4100040. 2005 0030. [DOI] [PMC free article] [PubMed] [Google Scholar]
- 30.Appanah R, Dickerson DR, Goyal P, Groudine M, Lorincz MC. An unmethylated 3' promoter-proximal region is required for efficient transcription initiation. PLoS Genet. 2007;3:e27. doi: 10.1371/journal.pgen.0030027. [DOI] [PMC free article] [PubMed] [Google Scholar]
- 31.Buratowski S. Transcription. Gene expression--where to start? Science. 2008;322:1804–1805. doi: 10.1126/science.1168805. [DOI] [PMC free article] [PubMed] [Google Scholar]
- 32.Weber M, et al. Distribution, silencing potential and evolutionary impact of promoter DNA methylation in the human genome. Nat Genet. 2007;39:457–466. doi: 10.1038/ng1990. [DOI] [PubMed] [Google Scholar]
- 33.Shendure J, Ji H. Next-generation DNA sequencing. Nat Biotechnol. 2008;26:1135–1145. doi: 10.1038/nbt1486. [DOI] [PubMed] [Google Scholar]
- 34.Schuster SC. Next-generation sequencing transforms today's biology. Nat Methods. 2008;5:16–18. doi: 10.1038/nmeth1156. [DOI] [PubMed] [Google Scholar]
- 35.Mardis ER. Next-generation DNA sequencing methods. Annu Rev Genomics Hum Genet. 2008;9:387–402. doi: 10.1146/annurev.genom.9.081307.164359. [DOI] [PubMed] [Google Scholar]
- 36.Kahvejian A, Quackenbush J, Thompson JF. What would you do if you could sequence everything? Nat Biotechnol. 2008;26:1125–1133. doi: 10.1038/nbt1494. [DOI] [PMC free article] [PubMed] [Google Scholar]
- 37.Jones PA. The DNA methylation paradox. Trends Genet. 1999;15:34–37. doi: 10.1016/s0168-9525(98)01636-9. [DOI] [PubMed] [Google Scholar]
- 38.Illingworth R, et al. A novel CpG island set identifies tissue-specific methylation at developmental gene loci. PLoS Biol. 2008;6:e22. doi: 10.1371/journal.pbio.0060022. [DOI] [PMC free article] [PubMed] [Google Scholar]
- 39.Park IH, Lerou PH, Zhao R, Huo H, Daley GQ. Generation of human-induced pluripotent stem cells. Nat Protoc. 2008;3:1180–1186. doi: 10.1038/nprot.2008.92. [DOI] [PubMed] [Google Scholar]
- 40.Ge B, et al. Survey of allelic expression using EST mining. Genome Res. 2005;15:1584–1591. doi: 10.1101/gr.4023805. [DOI] [PMC free article] [PubMed] [Google Scholar]
- 41.Lewin J, Schmitt AO, Adorjan P, Hildmann T, Piepenbrock C. Quantitative DNA methylation analysis based on four-dye trace data from direct sequencing of PCR amplificates. Bioinformatics. 2004;20:3005–3012. doi: 10.1093/bioinformatics/bth346. [DOI] [PubMed] [Google Scholar]
Associated Data
This section collects any data citations, data availability statements, or supplementary materials included in this article.


