Abstract
The image on the retina may move because the eyes move, or because something in the visual scene moves. The brain is not fooled by this ambiguity. Even as we make saccades, we are able to detect whether visual objects remain stable or move. Here we test whether this ability to assess visual stability across saccades is present at the single-neuron level in the frontal eye field (FEF), an area that receives both visual input and information about imminent saccades. Our hypothesis was that neurons in the FEF report whether a visual stimulus remains stable or moves as a saccade is made. Monkeys made saccades in the presence of a visual stimulus outside of the receptive field. In some trials, the stimulus remained stable, but in other trials, it moved during the saccade. In every trial, the stimulus occupied the center of the receptive field after the saccade, thus evoking a reafferent visual response. We found that many FEF neurons signaled, in the strength and timing of their reafferent response, whether the stimulus had remained stable or moved. Reafferent responses were tuned for the amount of stimulus translation, and, in accordance with human psychophysics, tuning was better (more prevalent, stronger, and quicker) for stimuli that moved perpendicular, rather than parallel, to the saccade. Tuning was sometimes present as well for nonspatial transaccadic changes (in color, size, or both). Our results indicate that FEF neurons evaluate visual stability during saccades and may be general purpose detectors of transaccadic visual change.
Introduction
Primates use saccadic eye movements to redirect their foveas to visual objects. Although beneficial in extending the range of high-acuity vision, saccades pose problems to the central visual system. One problem is the ambiguity of retinal image displacement. When an image projected onto the retina (Fig. 1A, left) undergoes translation (Fig. 1A, right), visual neurons throughout the brain detect new stimuli. In our illustration, the stimulus in a neuron's receptive field (RF) changes from a blur to a flower. Such a change may occur because the scene moves while the eyes are stable (Fig. 1B1), because the scene moves while the eyes move (Fig. 1B2), or because the scene remains stable while the eyes move (Fig. 1B3). Retinal information may be insufficient to identify the cause of the visual change. The central visual system, however, receives additional information that may help to resolve the ambiguity: internal signals about saccades, i.e., corollary discharge (Sommer and Wurtz, 2002, 2006, 2008).
Figure 1.
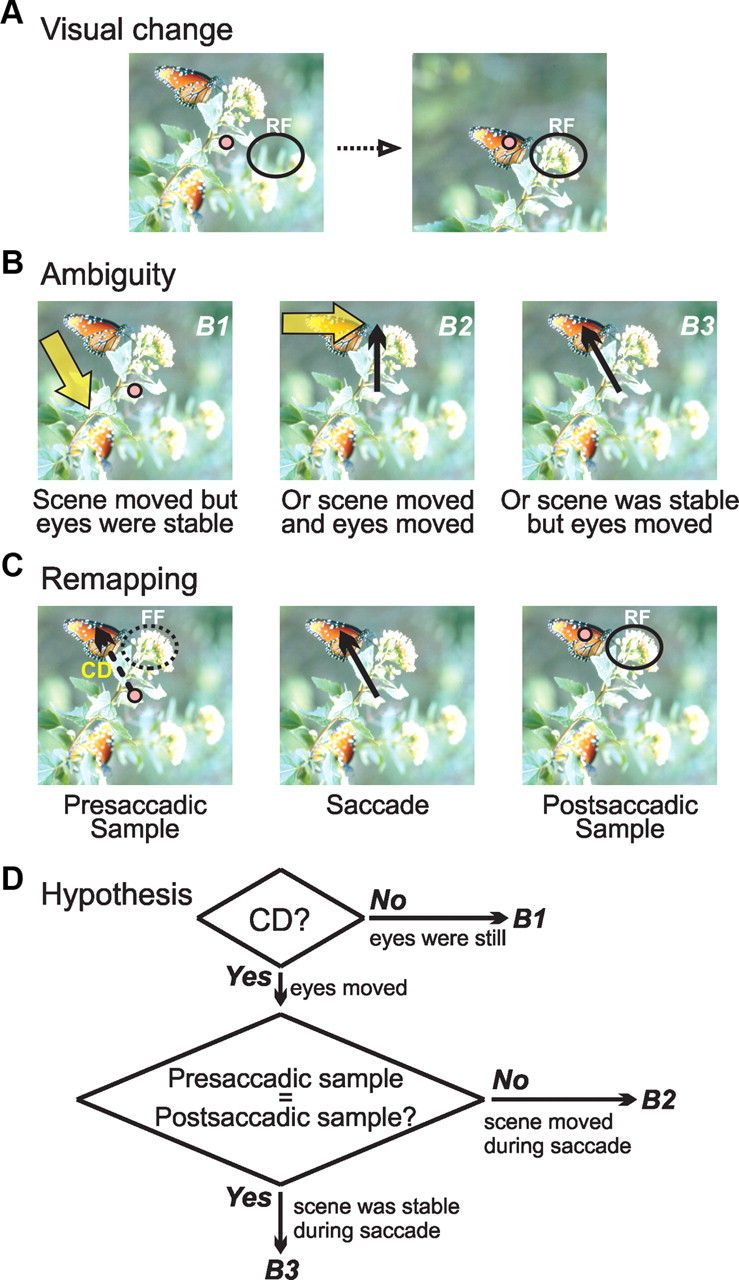
Disambiguating the reasons for image translation on the retina. A, Visual change in a neuronal RF resulting from image translation on the retina. B, Because both the eyes and scene may move, the underlying cause of the visual change is ambiguous. B1, The change may have been caused solely by movement in the scene, e.g., a gust of wind that brought the flower and butterfly down to the level of fixation. B2, Or it may have been attributable to a gust of wind from the left plus a saccade to the flower. B3, Or it may have been caused solely by a saccade (to the butterfly). C, Presaccadic remapping in the central visual system. Using corollary discharge (CD), a neuron that remaps will sample the same region of the visual scene before a saccade [in the future field (FF)] and after the saccade (in the RF). D, Hypothetical algorithm for disambiguating the cause of visual change using corollary discharge and presaccadic remapping. Outcomes B1, B2, and B3 refer to the potential causes of retinal image translation shown in B. Our study tests a central prediction of this hypothesis: that neurons report whether visual objects remain stable, or move, during a saccade.
Some visual neurons are known to be influenced by corollary discharge (Fig. 1C). Just before a saccade, they become visually sensitive at a future field location (Fig. 1C, left), the portion of space that the RF will occupy after the saccade (Duhamel et al., 1992; Umeno and Goldberg, 1997, 2001; Nakamura and Colby, 2002). Once the saccade is made (Fig. 1C, middle), the future field becomes the RF (Fig. 1C, right). Critically, the future field and the RF sample the same region of absolute visual space.
Corollary discharge and presaccadic remapping could help disambiguate the cause of retinal image translation (Fig. 1D). If the translation occurred in the absence of corollary discharge, the scene must have moved while the eyes were stable (Fig. 1D, the B1 outcome). If the translation was accompanied by corollary discharge, neurons that remap could determine whether the presaccadic sample (in the future field) matches the postsaccadic sample (in the RF). If the samples differ, the scene must have moved in addition to the eyes (Fig. 1D, the B2 outcome). If the samples match, the scene must have remained stable while the eyes moved (Fig. 1D, the B3 outcome).
The overall hypothesis of Figure 1D contains a central prediction: neurons report whether a stimulus remains stable, or moves, as a saccade is made. If neurons fail to do this, the hypothesis could be rejected outright. We tested this prediction in the frontal eye field (FEF), an area well positioned to assess visual stability across saccades. It contains visual neurons, including those that remap (Umeno and Goldberg, 1997, 2001), and it receives corollary discharge from the midbrain (Sommer and Wurtz, 2006). We found that FEF neurons do report whether visual stimuli remain stable or move across saccades. Unexpectedly, we also found that they report changes in stimulus features (color, size, or both). Our data support the hypothesis of Figure 1D and suggest that FEF neurons play a wide-ranging role in monitoring the continuity of elements in the visual scene while saccades are made.
Materials and Methods
Surgery.
In two monkeys (Macaca mulatta; one male and one female), we implanted scleral search coils for measuring eye position, recording chambers for accessing FEF, and a post for immobilizing the head during recording experiments. Details were provided previously (Sommer and Wurtz, 2000). The location of FEF was determined stereotaxically and verified with physiological criteria: the recording of saccade-related neurons and the evocation of saccades at <50 μA threshold (Bruce and Goldberg, 1985). All procedures were approved by the Institutional Animal Care and Use Committee at the University of Pittsburgh, where these experiments were performed.
Behavioral tasks.
During recording sessions, a monkey sat in a primate chair facing a tangent screen onto which visual stimuli were backprojected from an LCD projector. Single neurons were recorded extracellularly in the FEF with tungsten microelectrodes (FHC). Once a neuron was isolated, we characterized its activity, including the location and extent of its response field, using several visual–saccadic tasks (for details, see Crapse and Sommer, 2009). Then we screened neurons for a visual response using the memory-guided saccade task. A monkey fixated a spot for 500–800 ms, a target flashed at the center of the response field for 50 ms, and the monkey was required to maintain fixation. After a 500–1000 ms delay period, the fixation spot disappeared, which was the cue to move. The monkey made a saccade to the remembered target location and received liquid reward 500 ms later.
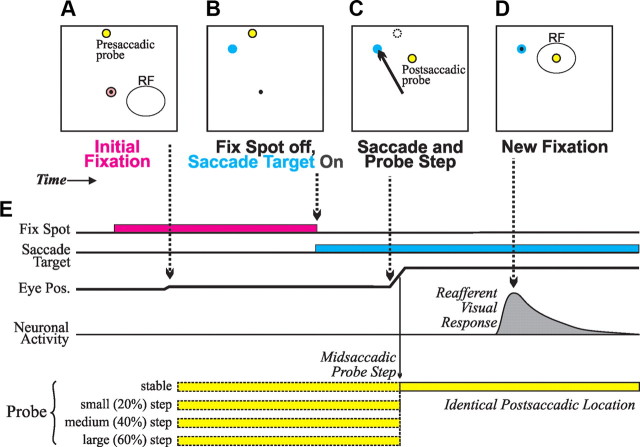
If a neuron exhibited visual activity in the memory-guided task, as indicated by real-time rasters and spike density functions (verified later, off-line, as described below; see Data analysis), we had the monkey perform the primary task for this study, the saccadic translation task (Fig. 2). The monkey fixated a spot of light and, after a delay of 200 ms, a visual probe appeared on the screen at a presaccadic location that varied by trial type but was always outside of the RF. After an additional random delay (200–1000 ms), the fixation point disappeared and a saccade target appeared (typically 28–30° away), cueing the monkey to make a saccade to the target. During the saccade, the visual probe stepped by a small, medium, or large amount (respectively, 20, 40, or 60% of the fixation point-saccade target distance) or remained stable (0% translation). In all cases, the postsaccadic probe location was at the center of the neuron's postsaccadic RF. Saccades to the probe were prohibited, and if they occurred, the trial was aborted and not analyzed.
Figure 2.
Saccadic translation task. A–D, Diagrams of task events. E, Time line of task events. Dotted arrows connect task events in A–D to the relevant points on the time line. To summarize, a monkey fixated a spot, and shortly thereafter, a presaccadic probe appeared outside of the RF. After a few hundred milliseconds, the fixation spot disappeared and a saccade target appeared (presaccadic probe was still present). The monkey made a saccade to the target, and, during the saccade, the probe remained stable or stepped a varying distance (“small”, “medium”, and “large” steps were, respectively, 20, 40, and 60% of the fixation spot-saccade target distance). In every trial, the probe was identical after the saccade: it was always at the center of the postsaccadic RF. The presence of the postsaccadic probe in the RF elicited a reafferent visual response, which was the focus of our neuronal analyses. See text for other details of the task.
The default direction for the saccade from fixation point to saccade target was horizontal into the ipsilateral hemifield. This direction worked well for RFs confined to the contralateral upper or lower quadrant, but we adjusted the direction if necessary. If an RF overlapped onto the contralateral horizontal meridian, for example, an oblique ipsiversive saccade direction was chosen to keep probe locations away from the saccade's trajectory. In general, saccade direction was chosen with four task constraints in mind: (1) the saccade amplitude (thus duration) had to be large enough to permit ample time for intrasaccadic visual change; (2) all of the presaccadic probe stimuli had to be out of the RF; (3) all stimuli had to be on the screen; and (4) the probe locations had to be as distant as possible from the saccade's trajectory.
We measured the exact timing of all visual events using a photodiode on the screen that monitored the appearance of a visual spot (not visible to the monkey) that accompanied every visual event in the task. Using the photodiode information and the 1 ms temporal resolution of the scleral search coil, we determined that all intrasaccadic probe changes occurred in midflight of the saccades, approximately two-thirds toward their completion (overall: mean, 68.9% into saccade duration; SD, 16.1%).
A subset of the neurons tested on the saccadic translation task was also tested on a fixation control task, for the purpose of testing an alternative explanation for our data. In this control task, the monkey fixated a spot of light for 200 ms, at which point a probe appeared on the screen. The probe's initial position relative to the center of the RF (0, 6, 12, or 18°) corresponded to the probe's initial position relative to the center of the future field during the saccadic translation task (0, 20, 40, or 60% of a 30° saccade). After an additional delay, the probe stepped to a new location located at the center of the RF. Then, after a final delay (500 ms), the monkey received a liquid reward.
We used a featural change task to test whether FEF neurons are generalized change detectors. This task was the same as the saccade translation task (Fig. 2), except that the probe always remained stable during the saccade. The probe's color, size, or both, could change intrasaccadically, however. The presaccadic probe was green for color change trials and 1.5° square for size change trials. The postsaccadic probe was identical for all trials, white and 0.6° square. We used four trial types: a no-change condition (presaccadic probe was white and 0.6° square), a color change condition that involved only a change in hue from green to white (with size continuously 0.6° square), a size change condition that involved only a diminution from 1.5 to 0.6° square (with color continuously white), and a color plus size condition that involved both of the featural changes (from green and 1.5° square to white and 0.6° square). Green was created by maximizing the green output of the projector and minimizing the red and blue outputs, and white was created by maximizing all the projector outputs; hence, color changes involved a luminance change as well.
Data analysis.
In a preliminary analysis, we verified that visual responses were significant and categorized neurons as visual or visuomovement cells (Bruce and Goldberg, 1985) based on activity elicited during the memory-guided task (Sommer and Wurtz, 2000). For each neuron, we used spike counts to find the average firing rates during a 100 ms visual epoch (50–150 ms after probe onset), a 100 ms movement epoch (−50 to 50 ms relative to saccade onset), and a 300 ms baseline epoch immediately preceding probe onset. Significance was assessed with an ANOVA (p < 0.01 criterion) followed by multiple comparison tests (p < 0.05 criteria). For neurons that passed the ANOVA test, those with visual activity, but not movement activity, that significantly exceeded baseline were considered visual cells. Neurons for which both the visual and movement activity significantly exceeded baseline activity were considered visuomovement cells.
Our main analyses focused on reafferent visual responses elicited during the saccadic translation task. We used two main approaches to quantify reafferent response properties. The first approach was to use spike counts to quantify average firing rates in an epoch from −50 to 150 ms relative to saccade end. The second approach was to convert the spike counts to continuous spike density functions (Gaussian, σ = 10 ms) to study the time course of modulation.
Using the epoch-based approach, for each neuron we found the reafferent visual response elicited by each trial condition (e.g., the step sizes in the saccadic translation task). A neuron had significant tuning if its reafferent visual responses varied across conditions (ANOVA, p < 0.05). Using the maximum and minimum reafferent visual responses elicited across the trial conditions, we measured a neuron's depth of tuning with the index (maximum firing rate − minimum firing rate)/(maximum firing rate).
Neurons exhibited a variety of tuning profiles (ramped up or down, concave or convex, or hybrid, as described in Results). For each neuron, we quantitatively described its tuning profile by generating two indices that described the extent to which it was ramped or curved. The ramp index quantified the degree of monotonic rise or fall in the reafferent visual response as a function of translation using the following contrast ratio: (40 + 60%) − (0 + 20%)/(0 + 20 + 40 + 60%). The values refer to the reafferent visual responses elicited in the stable condition (0% translation) and the small (20%), medium (40%), and large (60%) step-size conditions (see above, Behavioral tasks, for an explanation of percentages). The ramp index ranged from −1 (steadily decreasing firing rates for larger translations) to 1 (steadily increasing firing rates for larger translations). The curvature index was a contrast ratio of the average firing rates of the four conditions arranged in the following order: (20 + 40%) − (0 + 60%)/(0 + 20 + 40 + 60%). This index ranged from −1 (completely convex, i.e., maximal firing rates for extreme translations but none for intermediate translations) to +1 (completely concave, i.e., maximal firing rates for intermediate translations but none for extreme translations).
To analyze shape (or breadth) of tuning, we averaged the tuning curves. Because of the wide variety of tuning profiles, we could not just perform a straightforward averaging of firing rates across conditions. Instead, for each neuron we ranked the conditions according to the reafferent visual responses they elicited, from 1 (maximum) to 4 (minimum). This yielded a “rank tuning curve” for each neuron, which preserves information about shape of tuning even though it discards information about what the tuning represents in terms of trial conditions. We then found the average rank tuning curves across the neurons. One caveat is that ranking, by definition, yields the appearance of tuning. Therefore, we determined the chance levels of tuning expected from ranking using a bootstrap procedure on shuffled trials. For each neuron, we pooled all trials from the four conditions and randomly assigned each trial with replacement to one of four categories. The number of random assignments per category corresponded to the average number of collected data trials across the four original test conditions. After random assignment, we computed the mean firing rates for each category and ranked them. We repeated this procedure 1000 times to generate four rank bootstrapped means and SEs. These were then compared with the four test means and SEs.
The second main analysis method was to rely on spike density functions of activity to study the timing of reafferent visual responses. Our goals were to determine when tuning first emerged, relative to saccade termination, and for how long it lasted. We performed a sliding ANOVA on the spike density functions across all four trial conditions for each neuron. An ANOVA test was performed, and a p value was generated, at every 1 ms time point. For tuning onset time to be considered significant, we imposed the condition that significant modulation (p < 0.05) had to persist for at least 20 ms.
Finally, we tested for differences in firing rate that may accompany differences in saccadic endpoint. For each neuron and translation amount (four step sizes per neuron), we found the mean and variance of the saccade endpoints along the longest saccade dimension. We then defined a spatial window of inclusion defined relative to the mean with a total width equal to two times the variance. Reafferent visual responses (epoch method) were averaged for endpoints falling within and outside of the window. Effects of endpoint locations on reafferent visual responses were examined using linear regression.
All data were statistically analyzed using conventional parametric and nonparametric tests, with p < 0.05 as the criterion for significance unless otherwise noted.
Results
FEF neurons detect transaccadic movement of a visual stimulus
We recorded from 155 visually responsive neurons in the FEF while monkeys performed the saccadic visual translation task (Fig. 2). Our primary interest was in neurons that remap, but we tested every visually responsive neuron that we encountered. Inspired by human psychophysics (Niemeier et al., 2003), we used two spatial configurations of the task, one in which the probe stepped parallel to the saccade vector (109 neurons) and one in which the probe stepped perpendicular to the saccade (66 neurons). Twenty of the neurons were tested in both configurations.
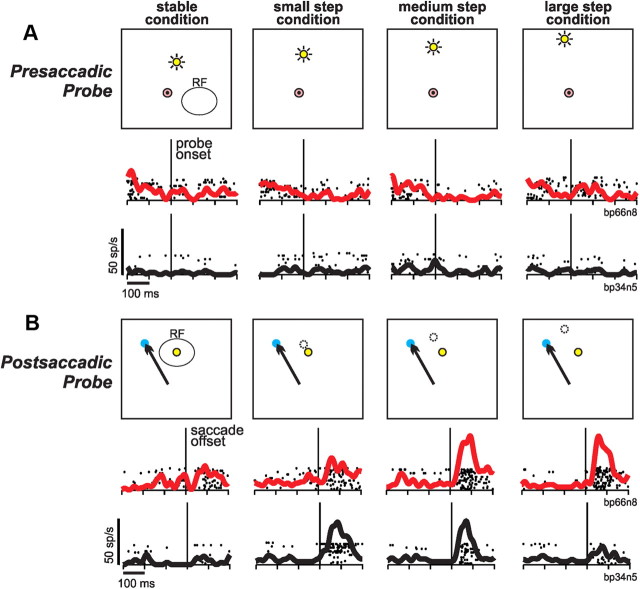
At the start of each trial, a visual probe was presented far from the center of the RF, evoking little or no visual response as demonstrated for two example neurons (Fig. 3A; rasters and spike density functions aligned to probe onset). The presaccadic probe occupied various locations depending on the trial condition (Fig. 3A, left to right). A saccade target then appeared, the monkey made a saccade to it, and, while the eye was in motion, the probe remained still or stepped a varying distance (Fig. 3B). For every trial condition, the position of the probe was identical at the end of the saccade: at the center of the postsaccadic RF. The data in Figure 3B are aligned to the end of the saccade to emphasize the reafferent visual responses to the probe. Because the postsaccadic probe was identical in every trial condition, the null hypothesis was that the reafferent visual responses should always be the same.
Figure 3.
Two example neurons (depicted in red and black) tested on the saccadic translation task. A, Data from the start of each trial, showing presaccadic probe locations in the four conditions (left to right). Neither neuron responded to probe onset, because every presaccadic probe location was well outside the classical RF. B, Data from the end of each trial, showing the common postsaccadic probe location (always at the center of the RF). Dotted circles show presaccadic probe locations. The probes remained stable or stepped during the saccade. Data are aligned to end of the saccade. Both neurons exhibited tuning for the various step sizes. One neuron (red data) had “ramped” tuning: larger reafferent visual responses for larger steps. The other neuron (black data) had concave tuning: larger reafferent responses for midrange steps. Scales are at the bottom left of data sets; neuron labels are to the right of data sets.
The first neuron (Fig. 3B, red traces), however, varied its reafferent response as a function of how the probe attained its postsaccadic location. The neuron fired little for a stimulus that was stable throughout the trial, fired modestly for probes that underwent a small translation, and fired vigorously after medium and large translations. We refer to this property as translation tuning and classify this form of tuning as “ramp up,” because reafferent responses increased monotonically with step size. The second neuron (Fig. 3B, black traces) was tuned best for intermediate step sizes. It fired strongly for small and medium steps but weakly for both extreme conditions, i.e., no step (stable) or large step. We refer to this sort of tuning, curved up in the middle, as “concave,” after the mathematical definition of a concave function. Other neurons (not shown) had ramp-down tuning (decreasing their response with step size) or convex tuning (firing least for intermediate step sizes).
Characteristics of translation tuning
In the population of visually responsive FEF neurons, we quantified translation tuning by plotting, for each neuron, the degree to which its tuning showed ramped or curved characteristics. Data were analyzed separately for the two translation geometries that we used: parallel (Fig. 4A,C) and perpendicular (Fig. 4B,D) steps relative to the saccade vector. The ramp index is positive for ramp-up tuning (e.g., the neuron in Fig. 3B, red, is depicted in Fig. 4A with an x symbol) and negative for ramp-down tuning. The curvature index is positive for concave tunings (the neuron in Fig. 3B, black, is shown in Fig. 4B with a square) and negative for convex tunings. In general, neurons had idiosyncratic tunings that could be both ramped and curved. For example, a neuron might have concave tuning that was slightly asymmetric so that the largest step size elicited more activity than the stable condition (Fig. 4B, such a neuron is noted with a cross). The considerable scatter in the plots indicates that the neurons exhibited myriad tuning preferences.
Figure 4.
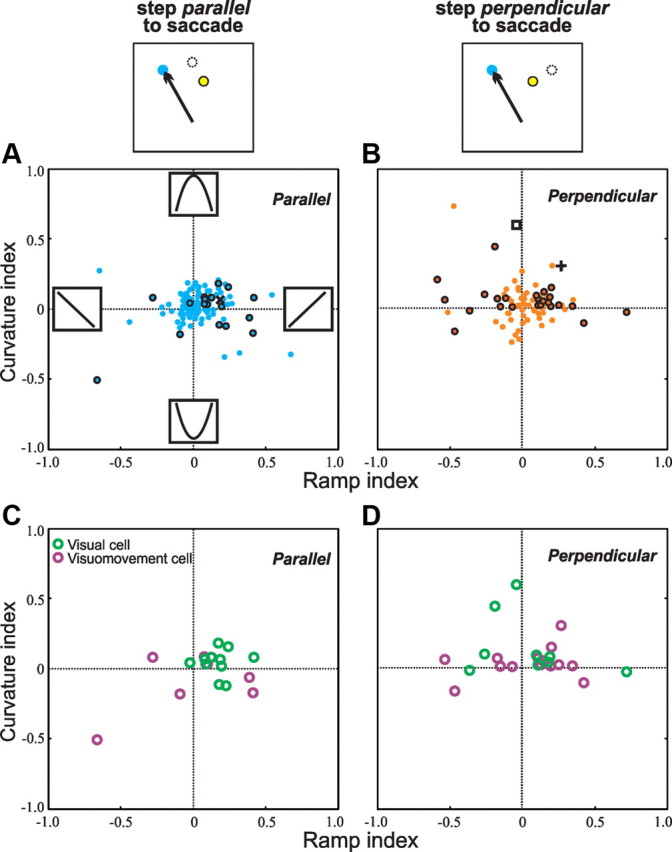
Ramp and curvature indices for the neurons. The ramp index is positive for ramp-up tuning (e.g., the neuron in Fig. 3, top row, is depicted in A as an x) and negative for ramp-down tuning. The curvature index is positive for concave tunings (the neuron in Fig. 3, middle row, is shown in B with a square) and negative for convex tunings. A neuron with hybrid tuning, both ramp up and concave, is shown with a cross in B. A, B, For all neurons tested in the parallel (A) and perpendicular (B) conditions, individual neurons with significant translation tuning as determined by the maximum–minimum index (see Fig. 5) are shown with bold outlines or the aforementioned symbols. C, D, The neurons with significant translation tuning are segregated into visual (green) and visuomovement (purple) types for the parallel condition (C) and the perpendicular condition (D).
We calculated whether individual tunings were significant by performing an ANOVA on reafferent visual response firing rate across the four translation conditions. In Figure 4, A and B, data from neurons with individually significant translation tunings are shown with bold-outlined dots (or the other symbols mentioned above). Significant tuning was more prevalent for perpendicular translations (39%, 26 of 66 neurons; Fig. 4B) than parallel translations (18%, 20 of 109 neurons; Fig. 4A; χ2, p = 0.004). Each significantly tuned neuron had a “preferred translation,” defined as the step size that elicited maximal activity. The distributions of preferred translations covered the full range of step sizes that we tested (Table 1).
Table 1.
Numbers of significantly tuned neurons as a function of the step size they preferred (columns) and the configuration on which they were tested (rows)
| No step | Small step | Medium step | Large step | |
|---|---|---|---|---|
| Parallel | 2 | 2 | 6 | 10 |
| Perpendicular | 6 | 5 | 5 | 10 |
Visually responsive neurons in the FEF are classically segregated into two types, those that also have a presaccadic burst of activity (“visuomovement cells”) and those that do not (“visual cells”) (Bruce and Goldberg, 1985). We tested most (n = 141) of our 155 neurons with a memory-guided saccade task that allowed us to perform this categorization quantitatively (Sommer and Wurtz, 2000) and found that 70 were visual cells and 71 were visuomovement cells. Translation tuning was nearly identical for the two subsets of neurons. Significant tuning occurred with about the same prevalence (27%, 19 of 70, of visual neurons and 30%, 21 of 71, of visuomovement neurons; not significantly different; Fisher's exact test, p = .852), and distributions of ramp and curvature indices in both the parallel (Fig. 4C) and perpendicular (Fig. 4D) conditions were not significantly different between the two types of neurons (t tests, p > 0.3 for all four comparisons of visual vs visuomovement neurons: ramp or curvature index in parallel or perpendicular condition). For the rest of the study, we analyze the full data set of 155 visually responsive neurons without distinguishing between visual and visuomovement cell subsets.
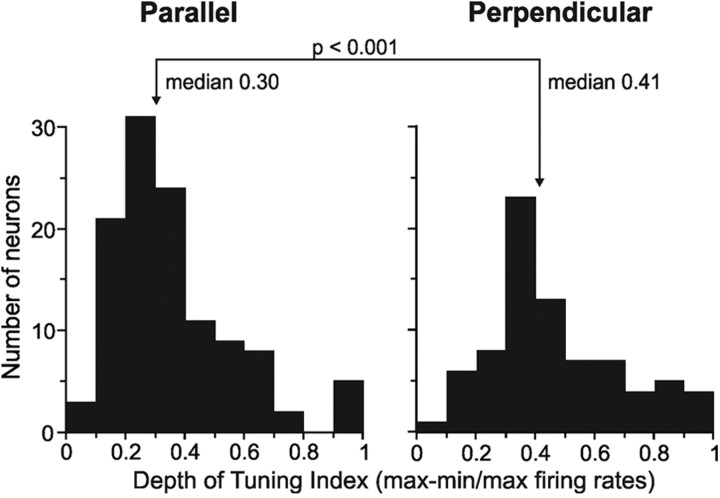
To quantify the strength (i.e., depth) of translation tuning, we calculated the maximum–minimum firing rate difference across the four conditions, normalized by maximum firing rate (Fig. 5). We determined this index for all neurons to describe the entire population characteristics. Depth of tuning was greater for perpendicular than for parallel translations (index difference of 0.11; p < 0.001).
Figure 5.
Depth of tuning indices [normalized maximum–minimum (max-min) measures] for neurons tested in the parallel (n = 109) and perpendicular (n = 66) configurations.
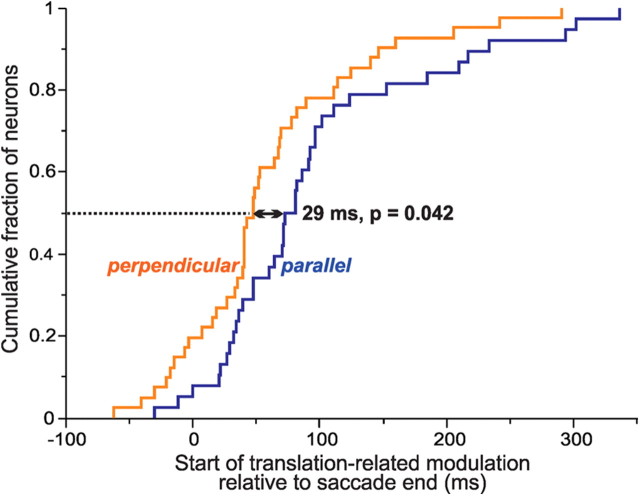
We next examined the timing of translation tuning, i.e., the moment relative to the end of the saccade when the reafferent visual responses began to differentiate between the different step sizes. For each neuron with significant tuning, we performed a sliding ANOVA on the spike density functions across the four conditions and identified the time when the ANOVA became significant (and then remained significant for at least 20 ms). We found that the neurons reported the differing step sizes soon after the saccade ended (Fig. 6). The median latency of discrimination was 29 ms earlier for perpendicular than parallel translations (Mann–Whitney test, p = 0.042). After the discriminations began, however, the length of time that they remained significant did not differ between the two configurations (data not shown; perpendicular, 36 ms; parallel, 32 ms; Mann–Whitney, p = 0.196).
Figure 6.
Onset of translation tuning. Neurons began discriminating among the four translation conditions 29 ms earlier in the perpendicular (n = 41) than in the parallel (n = 38) configuration.
In general, then, translation tuning was more prevalent, stronger, and quicker for perpendicular than parallel steps, consistent with human psychophysics data that demonstrate higher sensitivity for perpendicular than parallel transaccadic displacements of a stimulus (Niemeier et al., 2003).
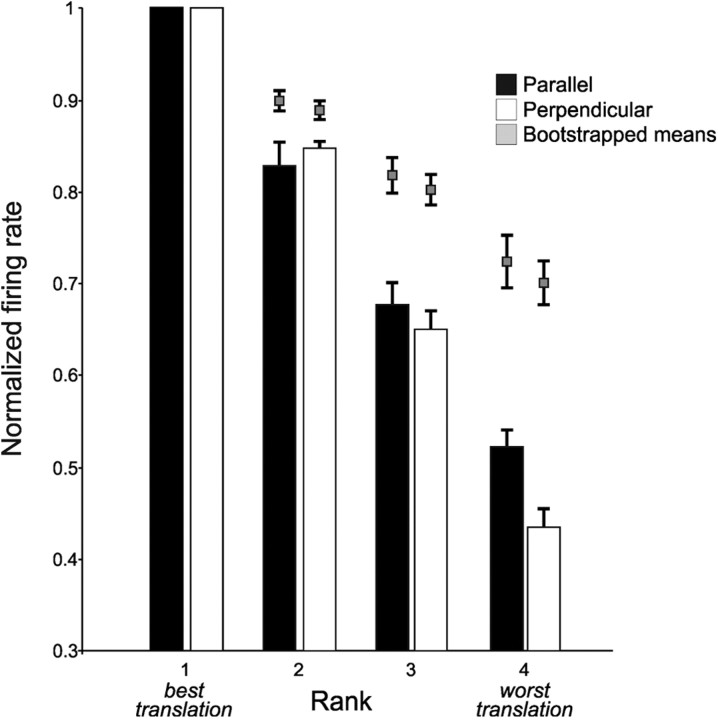
As a final analysis of translation tuning, we analyzed the average shape of the tuning curves. As firing rates decreased from maximal (evoked by the preferred step size), was this drop-off in activity continuous and gradual, or was it more of a plunge, with all nonpreferred step sizes having similarly low firing rates? To pool the myriad tuning curves (ramped up/down, concave/convex, and hybrid), we used a ranking method. For each significantly tuned neuron, we ranked the firing rates elicited by the four step sizes from 1 (maximal) to 4 (minimal), normalized so that maximal firing rates were set to 1.0. We also calculated the amount of spurious tuning expected by chance due to ranking (see bootstrap procedure in Materials and Methods). It was clear that the translation tuning profiles decreased in a graded manner from maximal to minimal (Fig. 7). Translation tuning was relatively broad: firing rates for rank 2 were not significantly lower than the levels expected from ranking (perpendicular, p = 0.036; parallel, p = 0.061; t tests with significance levels Bonferroni corrected to p < 0.025, because the data were also used for a test related to featural tuning, as described in that section). In other words, the average firing rates for second-best step sizes were numerically, but not significantly, lower than the firing rates for the rank 1 (“preferred”) step size. For rank 3 and 4 step sizes, however, average firing rates were lower than chance in all the data (p < 0.01 for ranks 3 and 4 for both the perpendicular and parallel configurations).
Figure 7.
Shapes of average tuning curves for neurons that were significantly tuned in the perpendicular (n = 26) and parallel (n = 20) configurations. Normalized firing rates rolled off gradually with rank. Both distributions differed significantly from the bootstrapped, chance levels in ranks 3 and 4.
Relationship with presaccadic remapping
To determine whether translation tuning was particular to neurons that engage in presaccadic remapping, we tested many of our visually responsive neurons (n = 82) with a conventional remapping task (Nakamura and Colby, 2002). We found that 31 of the neurons remapped and 51 did not [a similar proportion was found in other studies of the FEF (Umeno and Goldberg, 1997, 2001; Sommer and Wurtz, 2006)]. Thirteen of the 31 remapping neurons (42%) were tuned for translations, but so were 15 of 51 (29%) of the more “normal,” nonremapping neurons, an insignificant difference (χ2, p = 0.358). Hence, translation tuning is not an exclusive property of neurons that show presaccadic remapping.
Detection of nonspatial (featural) transaccadic changes
Our data indicate that FEF neurons are sensitive to spatial translation of a visual stimulus during a saccade. But are translations special? Or are FEF neurons sensitive to any changes, including nonspatial ones, that occur to a visual stimulus during a saccade? To answer this question, we modified the task so that, during a saccade, the probe remained in place but underwent a simple featural change (in color, size, or both). As in our original task, the postsaccadic stimulus was identical in all conditions, and the null hypothesis was that it would always elicit the same reafferent response.
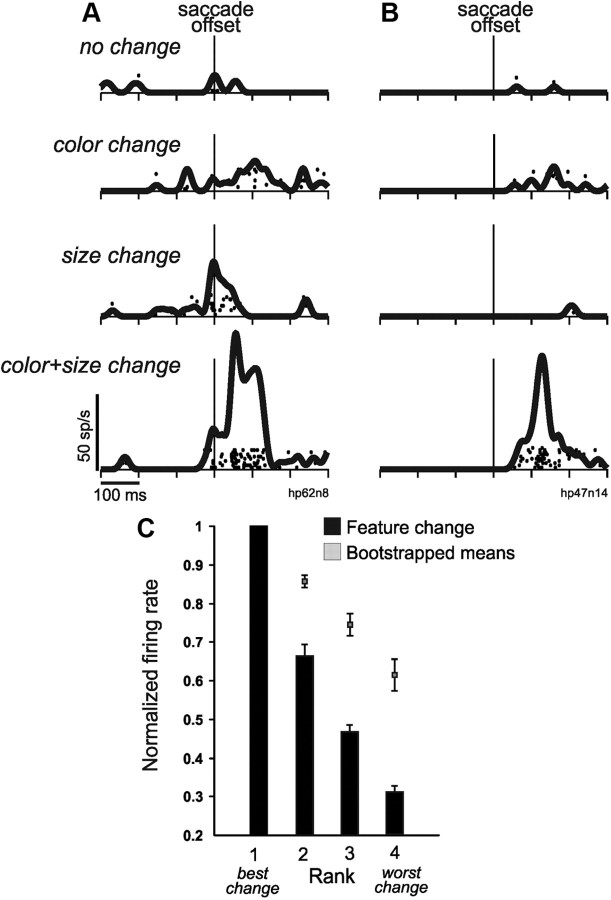
We tested 23 FEF neurons on this modified task and found that some were indeed sensitive to transaccadic featural changes. Two example neurons (Fig. 8A,B) showed a range of weak activity for the no-change, color change, and size change conditions. But both fired vigorously for the color plus size change condition. Of the 23 neurons, 11 showed significant tuning by ANOVA (p < 0.05) across the conditions.
Figure 8.
Reafferent visual responses to transaccadic featural change. A, B, Two example neurons. Each neuron fired little for the control, color, and size changes, yet fired vigorously for the combined color plus size change. C, Average shape of tuning profiles for those neurons (n = 11) with significant transaccadic featural tuning. In contrast to translation tuning (compare Fig. 7), for featural tuning, there was a sharp drop in activity from best condition (almost always the color plus size change) to second best. At each rank, the tuning was significantly lower than chance levels determined by bootstrapping.
One can observe in the example neurons (Fig. 8A,B) that the shape of featural tuning was more step-like than graded. To quantify the shape of featural tuning, we performed the same rank analysis as we did for translation tuning, except that the firing rates were ranked across the feature change conditions. By far, the best condition for evoking maximal firing was the combined color plus size change (10 of 11 neurons). Ranked population data are illustrated in Figure 8C. All of the firing rates were lower than the chance levels expected from ranking (rank 2, p = 0.014; ranks 3 and 4, p < 0.001; t tests with Bonferroni correction, p < 0.025 criterion). Featural tuning therefore dropped significantly from rank 1 to rank 2, unlike in translation tuning (compare Fig. 7). We directly compared this drop in activity (captured in the normalized firing rates for rank 2) between featural tuning (0.65) and translation tuning (0.88 after pooling perpendicular and parallel configurations), and it was significantly lower for featural tuning (p = 0.018, Mann–Whitney rank sum test). In summary, there is a sharp drop in activity from rank 1 to rank 2 in featural tuning, which suggests a nonlinear, thresholding effect in the neuronal detection of transaccadic featural change. This could reflect factors such as saliency or attention. The nonlinearity needs to be studied further, but our intent here was simply to test, in a proof-of-principle manner, whether the neurons detected transaccadic featural changes, and they did.
Alternative explanations for translation tuning
We examined two alternative explanations for our translation tuning results. First, the more prominent tunings for perpendicular versus parallel could be related to asymmetry of saccade endpoints, which typically form an ellipse with higher scatter parallel to the saccade. This asymmetry could disrupt detection of transaccadic stimulus displacements in the parallel direction and possibly degrade tuning for such steps. To test this, for each neuron tested in the parallel configuration, we categorized trials according to where the saccade landed: either in the central cluster of endpoints or outside it. A window was placed along the direction of the saccade (Fig. 9A) and set so that the scatter in that direction was comparable to that in the orthogonal direction. If saccadic endpoint locations affected reafferent visual responses, then the responses should differ for saccades landing outside versus inside the window. This was not the case (Fig. 9B). The relationship between reafferent visual responses from “out of window” and “in window” trials was well fit (R2 = 0.89; p < 0.001) by a linear regression with y-intercept = −3.16 ± 4.24 and slope = 1.13 ± 0.15 (±95% confidence intervals), i.e., not significantly different from a line of y-intercept = 0 and slope = 1 (unity line).
Figure 9.
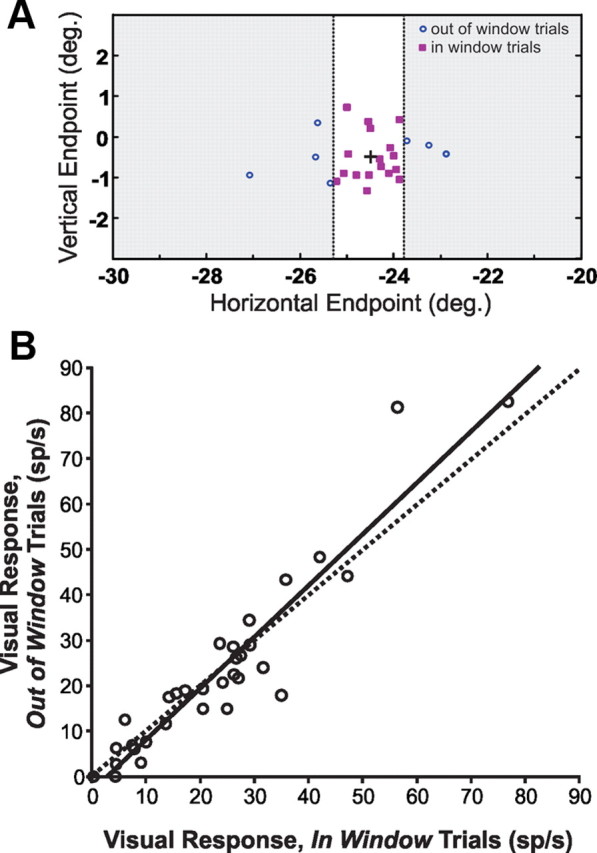
Saccadic endpoint analysis. A, Single neuron example illustrating the procedure by which the data were separated into a central cluster of endpoints (in window trials) and outlying flanks of endpoints (out of window trials). B, Comparisons of reafferent visual responses associated with the different endpoint categories, for data collected in parallel configuration. Solid line, Linear regression (y = 1.13x − 3.16); dashed line, unity line. Saccadic endpoints had no systematic effect on the reafferent visual responses.
Second, it was possible that neurons were not tuned for stimulus translation per se, but rather for stimulus location, specifically for the various presaccadic locations of the probe. The task might have inadvertently mapped the future field of neurons that engage in presaccadic remapping. A priori this seems unlikely, because neurons without remapping showed translation tuning as well (see previous section). Nevertheless, we tested the alternative explanation directly by recording from 20 neurons on a control version of the task that documented the RF tuning profile, under the assumption that it is an adequate representation of the future field profile. For this task (Fig. 10A), the monkey simply fixated while the probe either appeared and remained stable in the center of the RF, or stepped to the center of the RF from one of three initial locations (6, 12, or 18° from the RF center) that corresponded to typical step distances and directions relative to the future field center during the saccade translation task. For every neuron, we examined activity in a 100 ms epoch after the probe appeared in the fixation task and calculated curvature (Fig. 10B) and ramp (Fig. 10C) indices as for the data collected in the regular task. If tuning were an artifact of mapping the future field, the tunings in the two tasks should match. They did not; we found no significant correlations between RF tuning and translation tuning with respect to either the curvature (p = 0.959) or ramp index (p = 0.314, Pearson's tests).
Figure 10.
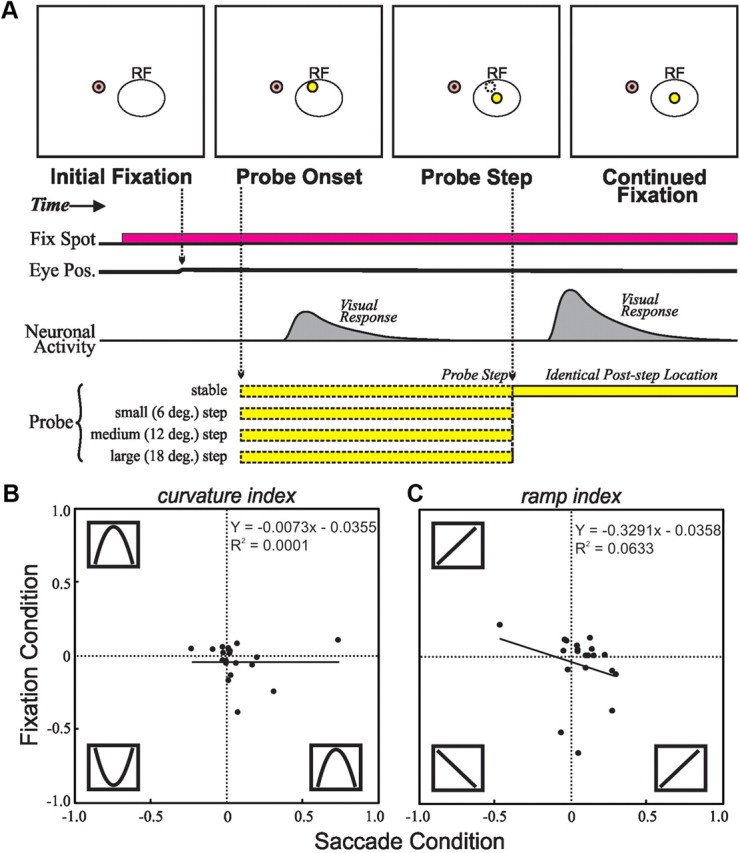
Testing the spatial mapping hypothesis. A, Fixation control task. The monkey began by fixating a spot of light. After a delay, a probe appeared at one of four locations relative to the center of the neuron's RF. Then, after a random period of time, the probe stepped to the center of the neuron's RF. Using the visual responses to initial probe onset at the varying locations, we compared the curvature (B) and ramp (C) indices found in the fixation task with the same indices for the same neurons as found in the saccadic translation task. There were no significant correlations. It seems unlikely, therefore, that tuning in the saccade translation task represented a mapping of the presaccadic probe locations.
Discussion
Our data demonstrate that FEF neurons report whether a peripheral visual stimulus remains stable or moves as a saccade is made. The neurons are tuned for the amount of transaccadic spatial change, and this tuning is more prevalent, stronger, and quicker for translations perpendicular, rather than parallel, to the saccade. Surprisingly, translation tuning is found both in neurons that remap and those that do not, and transaccadic featural changes are detected as well.
The variety of translation tuning curves
FEF neurons reported not only whether a peripheral stimulus moves, but also how far it moves. This translation tuning was variable, but the neuronal population provided comprehensive information about spatial changes. Similarly diverse, thorough tuning profiles are found in other areas of the primate visual system. Neurons in area MT, for example, may be tuned for low, medium, or high velocities of smooth motion (Maunsell and Van Essen, 1983; Perrone and Thiele, 2001; Liu and Newsome, 2003). In short, all possible values of the sensory variable of interest (in the case of FEF, image translation during a saccade) are represented in the network. On a trial-by-trial basis, how information about a visual change is read out from the population response is an area of active research and modeling (Pouget et al., 2000; Sanger, 2003).
We ruled out two alternative explanations for the translation tuning, but one more should be considered: intrasaccadic visual streaks on the retina caused by the probes. Controlling for retinal streaks is technically complex, and we did not attempt it, but the likelihood that streaks affected our results is remote. Saccades in our study were 28–30° in amplitude, corresponding to peak speeds of ∼900°/s [for example, see Quaia et al. (2000), who analyzed speed–amplitude relationships in detail for three monkeys using equipment and methods almost identical to what we used]. Stimuli moving that rapidly cause little responsiveness even in neurons of V1 (Cao and Schiller, 2003; Livingstone and Conway, 2007) and MT (Mikami et al., 1986; Lagae et al., 1993; Churchland and Lisberger, 2001; DeAngelis and Uka, 2003; Nover et al., 2005; Krekelberg et al., 2006a,b; Schlack et al., 2007; Yang et al., 2009). In FEF, there have been no reports of sensitivity to speeds higher than ∼50°/s (Gottlieb et al., 1994; Cassanello et al., 2008). Even if our neurons did respond to retinal streaks, the effects would have been nearly constant across conditions. Probes stepped to a constant postsaccadic location approximately two-thirds of the way into the saccade, about the time when an RF center would approach the probe location. Hence, the probes were identical in every trial during the final one-third of the saccade when neurons should be maximally responsive to streaks. Putative streak responses would be about the same in every trial, making it unlikely that they contributed to the response variations across conditions (i.e., tunings) that we found.
A perpendicular translation tuning advantage
FEF neurons were better at detecting steps perpendicular to the saccade than steps parallel to it. This matches the perceptual finding that human subjects are better at detecting perpendicular than parallel stimulus displacements relative to saccades. A potential explanation for both the neuronal and psychophysical data is found in the work of Niemeier et al. (2003), who concluded that the oculomotor system places varying weights on internal monitoring signals (i.e., corollary discharge) and visual inputs depending on their respective intrinsic variability. For saccades, more variability is found in the scatter of saccadic endpoints along the axis parallel to the saccade. Hence, a small translation parallel to a saccade may be attributed to motor noise and ignored. The same amount of translation perpendicular to the saccade is more likely to be detected, because motor noise is lower along that dimension. Such computations, if used by FEF neurons, could explain the perpendicular tuning bias we uncovered.
A generalized change detection capability
FEF neurons detected transaccadic featural changes in addition to spatial changes. It seems that they monitor whether any stimulus property changes during a saccade. Conceptually, the results are consistent with a proposal that FEF neurons compute prediction error (Crapse and Sommer, 2008). A presaccadic prediction of the postsaccadic scene is generated (presumably by neurons that remap) and then compared postsaccadically with the actual scene (by the same neurons or downstream neurons that compare presaccadic and postsaccadic signals). Deviation from the predicted visual input is signaled as an error. The outcome of the comparison could be used widely in the visual system for judging whether the scene is stable across saccades (as in Fig. 1D), for detecting featural change across saccades (Irwin, 1991; Rensink, 2002), for visual–oculomotor calibration (Hopp and Fuchs, 2004), or for all these purposes.
Would FEF neurons detect transaccadic changes in more naturalistic conditions? Previous studies examined reafferent visual responses while monkeys scanned natural scenes [in FEF (Burman and Segraves, 1994)] or visual arrays [in parietal cortex (Gottlieb et al. 1998)] and concluded that the responses are strong for stimuli that are behaviorally relevant (e.g., attended) and weak otherwise. Therefore, that we observed prominent reafferent responses for behaviorally irrelevant probes implies that our monkeys deployed attention to the probes even though this was not required. We expect that FEF neurons would detect transaccadic changes in natural scenes as long as the changes occur in attended regions, a prediction that fits well with emerging views on perceptual visual stability (Wurtz, 2008; Wurtz et al., 2011).
Transaccadic comparisons are limited by the biology of the visual system (Virsu and Rovamo, 1979; Banks et al., 1991). For neurons that remap, the future field and RF may occupy different eccentricities on the retina (depending on the relationship between the saccade vector and the fovea–RF vector). If the two fields are at different eccentricities, images within them will be relayed to the central visual system at different resolutions (Merigan and Katz, 1990). Consequently, future field and RF samples may never match precisely, even for identical stimuli. This caveat is not a serious limitation for assessing transaccadic image translations. The location of a stimulus can be reduced to its center of mass, which is equivalent at low or high resolution. Assuming stimulus rigidity, if the stimulus's center of mass changes between the presaccadic and postsaccadic samples, it must have translated. Detection of transaccadic featural changes, however, would be affected by eccentricity. Color discrimination degrades rapidly with eccentricity (Nagy and Wolf, 1993), and size discrimination is aided by edge detection, which degrades at lower acuity (Anstis, 1974). These factors may help explain why neurons were poor at reporting color or size changes alone and responded vigorously only to highly salient, color plus size changes.
Change detection is performed even by neurons that do not remap
Translation tuning occurred not only in neurons that exhibited presaccadic remapping, but also in neurons that showed no evidence of remapping. How nonremappers detected transaccadic visual translation remains enigmatic. The presaccadic probe was outside of their classical RF, and they did not respond to it. One explanation is that translation tuning is not achieved by individual neurons but arises as a network property. Proper modeling is needed to formalize this idea, but a brief overview is as follows. Any stimulus is always at the center of the RF for some neuron. During a saccade, a neuron with an RF that will encompass the stimulus's postsaccadic location could receive input from a neuron having an RF that sampled the stimulus presaccadically. The input may be insufficient to produce spikes, yet adequate to modify reafferent responses in a way that encodes the degree to which the stimulus changed during the saccade.
Implications
The main implication of our results is that a reafferent visual response in the FEF is not an absolute representation of the stimulus in the postsaccadic RF. For neurons with translation (or featural) tuning, the reafferent response is a differential representation of the postsaccadic stimulus relative to the presaccadic state of the same stimulus.
We did not expect to find featural tuning in the FEF because it is generally considered to be untuned for features (Mohler et al. 1973) (but see Peng et al., 2008). The FEF is interconnected, however, with much of extrastriate cortex including feature-tuned areas of the ventral stream (Schall et al., 1995). Perisaccadic interactions between the FEF and those areas could account for feature-change detection. Therefore, a second implication of our findings is the prediction that ventral stream regions, like FEF, may exhibit tuning for feature changes across saccades.
Our overall hypothesis (Fig. 1D) was that neurons might help to disambiguate sudden translations of a visual image by using both visual and corollary discharge information. Our data support the hypothesis but are not exclusive to it; the translation tuning that we found could be useful for many purposes, including visual–oculomotor calibration. More broadly, FEF neurons are capable detectors of transaccadic featural changes as well. In general, FEF neurons are sensitive to the relationship between visual arrangements of objects and the eye movements that threaten to disrupt the accurate perception of those objects.
Footnotes
The authors declare no competing financial interests.
This work was supported by the NIH (Grant EY017592 to M.A.S.) and the University of Pittsburgh (Andrew Mellon Predoctoral Fellowship to T.B.C.).
References
- Anstis SM. Letter: A chart demonstrating variations in acuity with retinal position. Vision Res. 1974;14:589–592. doi: 10.1016/0042-6989(74)90049-2. [DOI] [PubMed] [Google Scholar]
- Banks MS, Sekuler AB, Anderson SJ. Peripheral spatial vision: limits imposed by optics, photoreceptors, and receptor pooling. J Opt Soc Am A. 1991;8:1775–1787. doi: 10.1364/josaa.8.001775. [DOI] [PubMed] [Google Scholar]
- Bruce CJ, Goldberg ME. Primate frontal eye fields. I. Single neurons discharging before saccades. J Neurophysiol. 1985;53:603–635. doi: 10.1152/jn.1985.53.3.603. [DOI] [PubMed] [Google Scholar]
- Burman DD, Segraves MA. Primate frontal eye field activity during natural scanning eye movements. J Neurophysiol. 1994;71:1266–1271. doi: 10.1152/jn.1994.71.3.1266. [DOI] [PubMed] [Google Scholar]
- Cao A, Schiller PH. Neural responses to relative speed in the primary visual cortex of rhesus monkey. Vis Neurosci. 2003;20:77–84. doi: 10.1017/s0952523803201085. [DOI] [PubMed] [Google Scholar]
- Cassanello CR, Nihalani AT, Ferrera VP. Neuronal responses to moving targets in monkey frontal eye fields. J Neurophysiol. 2008;100:1544–1556. doi: 10.1152/jn.01401.2007. [DOI] [PMC free article] [PubMed] [Google Scholar]
- Churchland MM, Lisberger SG. Shifts in the population response in the middle temporal visual area parallel perceptual and motor illusions produced by apparent motion. J Neurosci. 2001;21:9387–9402. doi: 10.1523/JNEUROSCI.21-23-09387.2001. [DOI] [PMC free article] [PubMed] [Google Scholar]
- Crapse TB, Sommer MA. The frontal eye field as a prediction map. Prog Brain Res. 2008;171:383–390. doi: 10.1016/S0079-6123(08)00656-0. [DOI] [PMC free article] [PubMed] [Google Scholar]
- Crapse TB, Sommer MA. Frontal eye field neurons with spatial representations predicted by their subcortical input. J Neurosci. 2009;29:5308–5318. doi: 10.1523/JNEUROSCI.4906-08.2009. [DOI] [PMC free article] [PubMed] [Google Scholar]
- DeAngelis GC, Uka T. Coding of horizontal disparity and velocity by MT neurons in the alert macaque. J Neurophysiol. 2003;89:1094–1111. doi: 10.1152/jn.00717.2002. [DOI] [PubMed] [Google Scholar]
- Duhamel JR, Colby CL, Goldberg ME. The updating of the representation of visual space in parietal cortex by intended eye movements. Science. 1992;255:90–92. doi: 10.1126/science.1553535. [DOI] [PubMed] [Google Scholar]
- Gottlieb JP, MacAvoy MG, Bruce CJ. Neural responses related to smooth-pursuit eye movements and their correspondence with electrically elicited smooth eye movements in the primate frontal eye field. J Neurophysiol. 1994;72:1634–1653. doi: 10.1152/jn.1994.72.4.1634. [DOI] [PubMed] [Google Scholar]
- Gottlieb JP, Kusunoki M, Goldberg ME. The representation of visual salience in monkey parietal cortex. Nature. 1998;391:481–484. doi: 10.1038/35135. [DOI] [PubMed] [Google Scholar]
- Hopp JJ, Fuchs AF. The characteristics and neuronal substrate of saccadic eye movement plasticity. Prog Neurobiol. 2004;72:27–53. doi: 10.1016/j.pneurobio.2003.12.002. [DOI] [PubMed] [Google Scholar]
- Irwin DE. Information integration across saccadic eye movements. Cogn Psychol. 1991;23:420–456. doi: 10.1016/0010-0285(91)90015-g. [DOI] [PubMed] [Google Scholar]
- Krekelberg B, van Wezel RJ, Albright TD. Adaptation in macaque MT reduces perceived speed and improves speed discrimination. J Neurophysiol. 2006a;95:255–270. doi: 10.1152/jn.00750.2005. [DOI] [PubMed] [Google Scholar]
- Krekelberg B, van Wezel RJ, Albright TD. Interactions between speed and contrast tuning in the middle temporal area: implications for the neural code for speed. J Neurosci. 2006b;26:8988–8998. doi: 10.1523/JNEUROSCI.1983-06.2006. [DOI] [PMC free article] [PubMed] [Google Scholar]
- Lagae L, Raiguel S, Orban GA. Speed and direction selectivity of macaque middle temporal neurons. J Neurophysiol. 1993;69:19–39. doi: 10.1152/jn.1993.69.1.19. [DOI] [PubMed] [Google Scholar]
- Liu J, Newsome WT. Functional organization of speed tuned neurons in visual area MT. J Neurophysiol. 2003;89:246–256. doi: 10.1152/jn.00097.2002. [DOI] [PubMed] [Google Scholar]
- Livingstone MS, Conway BR. Contrast affects speed tuning, space-time slant, and receptive-field organization of simple cells in macaque V1. J Neurophysiol. 2007;97:849–857. doi: 10.1152/jn.00762.2006. [DOI] [PMC free article] [PubMed] [Google Scholar]
- Maunsell JH, Van Essen DC. Functional properties of neurons in middle temporal visual area of the macaque monkey. I. Selectivity for stimulus direction, speed, and orientation. J Neurophysiol. 1983;49:1127–1147. doi: 10.1152/jn.1983.49.5.1127. [DOI] [PubMed] [Google Scholar]
- Merigan WH, Katz LM. Spatial resolution across the macaque retina. Vision Res. 1990;30:985–991. doi: 10.1016/0042-6989(90)90107-v. [DOI] [PubMed] [Google Scholar]
- Mikami A, Newsome WT, Wurtz RH. Motion selectivity in macaque visual cortex. I. Mechanisms of direction and speed selectivity in extrastriate area MT. J Neurophysiol. 1986;55:1308–1327. doi: 10.1152/jn.1986.55.6.1308. [DOI] [PubMed] [Google Scholar]
- Mohler CW, Goldberg ME, Wurtz RH. Visual receptive fields of frontal eye field neurons. Brain Res. 1973;61:385–389. doi: 10.1016/0006-8993(73)90543-x. [DOI] [PubMed] [Google Scholar]
- Nagy AL, Wolf S. Red-green color discrimination in peripheral vision. Vision Res. 1993;33:235–242. doi: 10.1016/0042-6989(93)90161-o. [DOI] [PubMed] [Google Scholar]
- Nakamura K, Colby CL. Updating of the visual representation in monkey striate and extrastriate cortex during saccades. Proc Natl Acad Sci U S A. 2002;99:4026–4031. doi: 10.1073/pnas.052379899. [DOI] [PMC free article] [PubMed] [Google Scholar]
- Niemeier M, Crawford JD, Tweed DB. Optimal transsaccadic integration explains distorted spatial perception. Nature. 2003;422:76–80. doi: 10.1038/nature01439. [DOI] [PubMed] [Google Scholar]
- Nover H, Anderson CH, DeAngelis GC. A logarithmic, scale-invariant representation of speed in macaque middle temporal area accounts for speed discrimination performance. J Neurosci. 2005;25:10049–10060. doi: 10.1523/JNEUROSCI.1661-05.2005. [DOI] [PMC free article] [PubMed] [Google Scholar]
- Peng X, Sereno ME, Silva AK, Lehky SR, Sereno AB. Shape selectivity in primate frontal eye field. J Neurophysiol. 2008;100:796–814. doi: 10.1152/jn.01188.2007. [DOI] [PMC free article] [PubMed] [Google Scholar]
- Perrone JA, Thiele A. Speed skills: measuring the visual speed analyzing properties of primate MT neurons. Nat Neurosci. 2001;4:526–532. doi: 10.1038/87480. [DOI] [PubMed] [Google Scholar]
- Pouget A, Dayan P, Zemel R. Information processing with population codes. Nat Rev Neurosci. 2000;1:125–132. doi: 10.1038/35039062. [DOI] [PubMed] [Google Scholar]
- Quaia C, Paré M., Wurtz RH, Optican LM. Extent of compensation for variations in monkey saccadic eye movements. Exp Brain Res. 2000;132:39–51. doi: 10.1007/s002219900324. [DOI] [PubMed] [Google Scholar]
- Rensink RA. Change detection. Annu Rev Psychol. 2002;53:245–277. doi: 10.1146/annurev.psych.53.100901.135125. [DOI] [PubMed] [Google Scholar]
- Sanger TD. Neural population codes. Curr Opin Neurobiol. 2003;13:238–249. doi: 10.1016/s0959-4388(03)00034-5. [DOI] [PubMed] [Google Scholar]
- Schall JD, Morel A, King DJ, Bullier J. Topography of visual cortex connections with frontal eye field in macaque: convergence and segregation of processing streams. J Neurosci. 1995;15:4464–4487. doi: 10.1523/JNEUROSCI.15-06-04464.1995. [DOI] [PMC free article] [PubMed] [Google Scholar]
- Schlack A, Krekelberg B, Albright TD. Recent history of stimulus speeds affects the speed tuning of neurons in area MT. J Neurosci. 2007;27:11009–11018. doi: 10.1523/JNEUROSCI.3165-07.2007. [DOI] [PMC free article] [PubMed] [Google Scholar]
- Sommer MA, Wurtz RH. Composition and topographic organization of signals sent from the frontal eye field to the superior colliculus. J Neurophysiol. 2000;83:1979–2001. doi: 10.1152/jn.2000.83.4.1979. [DOI] [PubMed] [Google Scholar]
- Sommer MA, Wurtz RH. A pathway in primate brain for internal monitoring of movements. Science. 2002;296:1480–1482. doi: 10.1126/science.1069590. [DOI] [PubMed] [Google Scholar]
- Sommer MA, Wurtz RH. Influence of the thalamus on spatial visual processing in frontal cortex. Nature. 2006;444:374–377. doi: 10.1038/nature05279. [DOI] [PubMed] [Google Scholar]
- Sommer MA, Wurtz RH. Brain circuits for the internal monitoring of movements. Annu Rev Neurosci. 2008;31:317–338. doi: 10.1146/annurev.neuro.31.060407.125627. [DOI] [PMC free article] [PubMed] [Google Scholar]
- Umeno MM, Goldberg ME. Spatial processing in the monkey frontal eye field. I. Predictive visual responses. J Neurophysiol. 1997;78:1373–1383. doi: 10.1152/jn.1997.78.3.1373. [DOI] [PubMed] [Google Scholar]
- Umeno MM, Goldberg ME. Spatial processing in the monkey frontal eye field. II. Memory responses. J Neurophysiol. 2001;86:2344–2352. doi: 10.1152/jn.2001.86.5.2344. [DOI] [PubMed] [Google Scholar]
- Virsu V, Rovamo J. Visual resolution, contrast sensitivity, and the cortical magnification factor. Exp Brain Res. 1979;37:475–494. doi: 10.1007/BF00236818. [DOI] [PubMed] [Google Scholar]
- Wurtz RH. Neuronal mechanisms of visual stability. Vision Res. 2008;48:2070–2089. doi: 10.1016/j.visres.2008.03.021. [DOI] [PMC free article] [PubMed] [Google Scholar]
- Wurtz RH, Joiner WM, Berman RA. Neuronal mechanisms for visual stability: progress and problems. Philos Trans R Soc Lond B Biol Sci. 2011;366:492–503. doi: 10.1098/rstb.2010.0186. [DOI] [PMC free article] [PubMed] [Google Scholar]
- Yang Y, Zhang J, Liang Z, Li G, Wang Y, Ma Y, Zhou Y, Leventhal AG. Aging affects the neural representation of speed in Macaque area MT. Cereb Cortex. 2009;19:1957–1967. doi: 10.1093/cercor/bhn221. [DOI] [PMC free article] [PubMed] [Google Scholar]


