

Abstract
Background:
Quality of life is an important end point in clinical trials, yet there are few quality of life questionnaires for neuroendocrine tumours.
Methods:
This international multicentre validation study assesses the QLQ-GINET21 Quality of Life Questionnaire in 253 patients with gastrointestinal neuroendocrine tumours. All patients were requested to complete two quality of life questionnaires – the EORTC Core Quality of Life questionnaire (QLQ-C30) and the QLQ-GINET21 – at baseline, and at 3 and 6 months post-baseline; the psychometric properties of the questionnaire were then analysed.
Results:
Analysis of QLQ-GINET21 scales confirmed appropriate aggregation of the items, except for treatment-related symptoms, where weight gain showed low correlation with other questions in the scale; weight gain was therefore analysed as a single item. Internal consistency of scales using Cronbach's α coefficient was >0.7 for all parts of the QLQ-GINET21 at 6 months. Intraclass correlation was >0.85 for all scales. Discriminant validity was confirmed, with values <0.70 for all scales compared with each other.
Scores changed in accordance with alterations in performance status and in response to expected clinical changes after therapies. Mean scores were similar for pancreatic and other tumours.
Conclusion:
The QLQ-GINET21 is a valid and responsive tool for assessing quality of life in the gut, pancreas and liver neuroendocrine tumours.
Keywords: neuroendocrine, carcinoid, quality of life, patient-reported outcome measure
Quality of life (QoL) is an important outcome measure in clinical trials and is increasingly being used as an end point, especially in studies involving patients with malignant diseases (Kavadas et al, 2003; Efficace et al, 2007). Despite this trend, a limited amount of research has been published about QoL in patients with carcinoid and neuroendocrine tumours (NETs) and, to our knowledge, there are limited data on disease-specific QoL questionnaires (QLQs) for these patients (Jacobsen and Hanssen, 1995; Wymenga et al, 1999; Larsson et al, 1999a, 1999b, 2001, 2003; O'Toole et al, 2000; Wareham et al, 2002; Vinik et al, 2009).
Neuroendocrine tumours at all sites are increasing in incidence, and the reported incidence of gastrointestinal (GI) NETs is approaching 3 per 100 000 people per year, with a slight predominance in women (Modlin and Sandor, 1997; Hemminki and Li, 2001a, 2001b; Modlin et al, 2003, 2008; Ellis et al, 2010). Neuroendocrine tumours of gut origin may give rise to symptoms that are related to the local presence of tumour in the gut, pancreas or liver (e.g. pressure and pain); however, around 85% of GINETs produce biologically active substances, which may lead to broader-ranging symptoms and distinctive syndromes (Snow and Liddle, 1995). The most common set of symptoms are those of the carcinoid syndrome (skin flushing, diarrhoea and wheezing) due to excessive production of serotonin (Davis et al, 1973).
The prognosis for NET patients is dependent on both the cancer and the syndrome, and there are differences between pancreatic NETs and those of gut origin (Modlin et al, 2008). The overall 5-year survival for patients with a gastroenteropancreatic NET (following complete resection of the primary tumour and liver metastases if present) is up to 83% however, in many cases, where it is not possible to surgically remove the primary NET and liver metastases, 5-year survival ranges from 30 to 70% (Wangberg et al, 1996; Janson et al, 1997; Modlin and Sandor, 1997; Kirshbom et al, 1998; Soga, 1998; Shebani et al, 1999; Soreide et al, 2000; Wheeler et al, 2000; Nave et al, 2001; Davies et al, 2003; Ramage et al, 2012).
Treatment should be curative where possible but is palliative in the majority of cases (Ahmed et al, 2009), and many treatments have side effects. It is therefore important when selecting therapies to weigh up the benefits of treatment with its impact on the patient's QoL (Ramage and Davies, 2003). To assess the overall benefits of therapeutic intervention, patient-reported outcome measures should be included as part of clinical studies in patients with NETs, using appropriate health-related QLQs. Generic tools to assess QoL in cancer patients, including the EORTC Core Quality of Life questionnaire (QLQ-C30) and the Functional Assessment of Cancer Therapy-General (FACT-G) scale, have been developed, and may be supplemented by disease-specific modules for different cancers (Cella et al, 1993). Recently, the disease-specific QLQ-GINET21 was devised to supplement the QLQ-C30 and include QoL issues important to patients with NETs.
This paper describes an international phase 4 psychometric validation study designed to assess the clinical and psychometric reliability, validity and responsiveness-to-change of the QLQ-GINET21 in patients with NETs. As discussed previously (Davies et al, 2006), in view of the uncommon nature of pancreatic NETs and the variety of different syndromes within this group, a pragmatic approach has been taken to develop a disease-specific module to cover all NETs.
Patients and methods
Patients
Patients were recruited into this international multicentre study between January 2006 and January 2010. Patients eligible for inclusion were those aged over 18 years with either (1) a histological diagnosis of NET or (2) radiological findings consistent with NET together with raised hormone levels in their plasma or urine indicative of NET. The sites of NET, with or without hormone secretion, included any gut-primary with metastases (including some patients who clinically had a gut primary where the primary lesion had not been definitely identified – classified as unknown primary), lung-primary with liver/abdominal metastases and pancreas with or without metastases. Of the 253 patients, 124 had non-functioning tumours, secreting only chromogranin-A, 111 tumours secreted 5-hydroxy-indoloacetic acid, a main metabolite of 5-hydroxytrptamine, four secreted gastrin, three secreted glucagon, five secreted insulin and one secreted vasoactive intestinal peptide. In five patients, secretion status was unknown. Expected survival of at least 3 months and a planned treatment for NET were also requirements for inclusion. Patients were excluded if they had concurrent malignancy elsewhere, or had psychological, geographical or comprehension impairment that prevented completion of the questionnaire. Ethics committee approval and written informed consent were obtained and the protocol was approved by the EORTC Quality of Life Group.
Questionnaires
The study required that all patients completed two QLQs – the EORTC core questionnaire (the QLQ-C30, version 3.0; available at http://groups.eortc.be/qol/questionnaires_qlqc30.htm) and the QLQ-GINET21 (see Appendix Table A1) – at all assessment time points (baseline, and 3 and 6 months post-baseline). Details of the development and initial field testing of the QLQ-GINET21 have been published previously (Davies et al, 2006); however, in brief, the QLQ-GINET21 contains a total of 21 items: four single-item assessments relating to muscle and/or bone pain (MBP), body image (BI), information (INF) and sexual functioning (SX), together with 17 items organised into five proposed scales: endocrine symptoms (ED; three items), GI symptoms (GI; five items), treatment-related symptoms (TR; three items), social functioning (SF) of the new module (SF21; three items) and disease-related worries (DRW; three items) (Davies et al, 2006). The response format of the questionnaire is a four-point Likert scale. To help distinguish between missing items and questions that are not relevant, four questions also have a ‘not applicable' box. Responses to the QLQ-C30 and the QLQ-GINET21 were linearly transformed to a 0–100 scale using EORTC guidelines, with higher scores reflecting more severe symptoms.
The QLQ-GINET21 was translated into nine languages according to strict EORTC translation guidelines (Cull et al, 2002).
Study design
Patients were assigned to one of two groups depending on the treatment they were to receive. Group 1 consisted of 88 patients who received somatostatin (SMS) analogues or interferon therapy; Group 2 consisted of 165 patients who received other forms of therapy, namely peptide-receptor radiotherapy (102 patients), chemotherapy (23 patients), surgery (20 patients) or ablative/other therapies (20 patients). Patients completed the QLQs before commencement of treatment (baseline) and at 3 and 6 months post-baseline. Owing to the different nature of the treatments, post-baseline assessments were made during long-term continuous treatment in Group 1, while in Group 2 some of the treatments were single administrations and therefore the assessments occurred during the course of therapy in only some cases. Patients also completed a number of established debriefing questions to determine the acceptability of the module. Test–retest reliability was assessed in 48 clinically stable patients 2 weeks after the 6-month assessment.
Statistical analysis
Reliability of the QLQ-C30 and QLQ-GINET21
The reliability (i.e. internal consistency) of the multi-item questionnaire scales was assessed by Cronbach's α coefficient (Cronbach and Warrington, 1951). As recommended by Nunnally and Bernstein (1994), internal consistency estimates of >0.70 were considered acceptable for group comparisons. The test–retest reliability approach was used to assess repeatability and reproducibility of the questionnaire in a group of 48 patients (the first 48 patients who agreed to take part). These patients completed the questionnaire again, 14 days later; to be included in the analysis, patients in this subgroup had to have stable disease with no change in symptoms within the 2-week period between questionnaires. Intraclass correlations (ICCs) for the QLQ-C30 and QLQ-GINET21 scales were calculated as a measure of test–retest reliability.
Validity of the QLQ-C30 and QLQ-GINET21
Multitrait scaling was employed to examine the hypothesised scale structure of the QLQ-GINET21. To test for item-scale convergence validity, correlations between an item and its own scale of ⩾0.40 (i.e. the correlation coefficient) were used (Hays et al, 1988). Support for item-discriminant validity was based on a comparison of an item with its own scale as compared with other scales. An item was expected to correlate significantly better (two times the standard error) with its own scale than with other scales.
Correlation among the scales of QLQ-GINET21 and QLQ-C30 was examined using Pearson's product–moment correlation. It was expected that the scales that were conceptually related would correlate substantially with one another (Pearson's r>0.40).
The Mann–Whitney U-test (equivalent to the Wilcoxon's rank-sum test) was used to assess known-group comparisons that discriminate between subgroups of NET patients (e.g. functioning vs non-functioning NETs, different primary tumour sites) with differing clinical status (Karnofsky Performance Status). To evaluate whether the QLQ-GINET21 could be used for pancreatic tumours, comparisons between the mean baseline scores of patients with pancreatic tumours and those with tumours at other sites were performed.
Responsiveness of the QLQ-C30 and QLQ-GINET21 tools to clinical change of health status over time was evaluated using the three sets of questionnaires for each patient over time. The variation of mean QoL scores over time for items and scales reflects changes in QoL and performance status. This was not correlated with radiological response in this study. The mean change over time and cancer NET group was compared by repeated-measure ANOVA.
The statistical software program SPSS 18 was used for the purpose of data management and linear transformation of responses from the QLQ-C30 and the QLQ-GINET21 to a 0–100 scale using EORTC guidelines and SPSS syntax programming. Stata 11 was employed for all analyses and a conservative P-value of 0.01 was considered statistically significant. Where items were missing, the method proposed in the EORTC scoring manual to impute missing values was used (Fayers et al, 2001).
Sample size
A sample of 253 patients (which covered 5% attrition), each responding to 21 items, achieves 80% power to detect the difference between the coefficient α under the null hypothesis of 0.60, and the coefficient α under the alternative hypothesis of 0.71, using a two-sided F-test with a significance level of 0.01 (Bonett, 2002). The sample size calculation is compatible with the accepted ‘rule of thumb' that at least 10 responses per item are needed (Tabachnik and Fidel, 1993); therefore, the minimum sample would be 210.
For the purpose of test–retest reliability, a sample size of 48 subjects with two observations per subject provides 82% power to detect a 10% difference in ICC of 0.90 using an F-test with a significance level of 0.05 (Walter et al, 1988).
Results
Participating centres and patient characteristics
Participating centres in the United Kingdom, the Netherlands, Poland, Denmark, Sweden, Italy, Germany, Spain, Israel and Greece together enroled 253 NET patients who fulfilled the inclusion criteria (see Appendix Table A2). Some differences in patient characteristics and treatment approaches between centres were noted at baseline (Table 1).
Table 1. Baseline patient characteristics.
| Country | UK | The Netherlands | Poland | Denmark | Sweden | Italy | Germany | Spain | Israel | Greece | All Patients |
|---|---|---|---|---|---|---|---|---|---|---|---|
| No. of patients recruited |
106 |
37 |
36 |
20 |
16 |
11 |
10 |
8 |
7 |
2 |
253 |
|
Age, years | |||||||||||
| Mean | 63 | 60 | 56 | 56 | 61 | 58 | 64 | 50 | 59 | 67 | 60 |
| Median |
63 |
62 |
58 |
63 |
63 |
60 |
65 |
53 |
60 |
67 |
62 |
| Range |
28–83 |
33–75 |
33–74 |
23–77 |
42–84 |
41–71 |
48–78 |
34–64 |
39–76 |
63–71 |
23–84 |
| Females, n (%) |
54 (51) |
14 (39) |
20 (56) |
12 (60) |
9 (56) |
4 (36) |
3 (30) |
2 (25) |
3 (43) |
1 (50) |
122 (48) |
|
Site, n (%) | |||||||||||
| Appendix | 2 (2) | 1 (3) | 0 (0) | 1 (5) | 0 (0) | 0 (0) | 1 (10) | 0 (0) | 1 (14) | 0 (0) | 6 (2) |
| Colon | 14 (13) | 3 (8) | 2 (6) | 0 (0) | 1 (6) | 0 (0) | 0 (0) | 0 (0) | 1 (14) | 0 (0) | 21 (8) |
| Duodenum | 2 (2) | 1 (3) | 0 (0) | 0 (0) | 0 (0) | 0 (0) | 0 (0) | 0 (0) | 0 (0) | 0 (0) | 3 (1) |
| Ileum | 51 (48) | 7 (19) | 13 (36) | 5 (25) | 9 (56) | 3 (27) | 4 (40) | 2 (25) | 1 (14) | 0 (0) | 95 (38) |
| Lungs | 4 (4) | 1 (3) | 0 (0) | 0 (0) | 1 (6) | 1 (9) | 0 (0) | 0 (0) | 0 (0) | 0 (0) | 7 (3) |
| Ovary (metastatic from ileal) | 1 (1) | 1 (3) | 0 (0) | 0 (0) | 0 (0) | 0 (0) | 0 (0) | 0 (0) | 0 (0) | 0 (0) | 2 (1) |
| Pancreas | 11 (10) | 8 (22) | 16 (44) | 8 (40) | 5 (31) | 7 (64) | 5 (50) | 5 (63) | 3 (43) | 2 (100) | 70 (28) |
| Stomach | 1 (1) | 0 (0) | 1 (3) | 0 (0) | 0 (0) | 0 (0) | 0 (0) | 0 (0) | 0 (0) | 0 (0) | 2 (1) |
| Unknown (clinically gut primary) |
20 (19) |
15 (41) |
4 (11) |
6 (30) |
0 (0) |
0 (0) |
0 (0) |
1 (13) |
1 (14) |
0 (0) |
47 (19) |
|
Treatment group, n (%) | |||||||||||
| Group 1 | 54 (51) | 5 (14) | 0 (0) | 4 (20) | 10 (63) | 5 (45) | 2 (20) | 5 (63) | 3 (43) | 0 (0) | 88 (35) |
| Group 2 |
52 (49) |
32 (86) |
36 (100) |
16 (80) |
6 (37) |
6 (55) |
8 (80) |
3 (37) |
4 (57) |
2 (100) |
165 (65) |
|
Karnofsky performance status | |||||||||||
| Mean | 82 | 92 | 84 | 87 | 86 | 98 | 84 | 85 | 90 | 95 | 86 |
| Median | 80 | 90 | 85 | 90 | 90 | 100 | 85 | 85 | 90 | 95 | 90 |
| Range | 50–100 | 80–100 | 70–90 | 60–100 | 80–90 | 90–100 | 70–90 | 60–100 | 90–90 | 90–100 | 50–100 |
Scale construction
The scaling analysis confirmed the aggregation of items into scales, with the exception of TR, which required revision. The TR scale had three items (question 39, side effects; question 40, repeated injections; question 46, weight gain (WG)), with WG being included to account for SMS analogue treatments. WG, however, showed low correlation with the other questions in the scale and Cronbach's α coefficient was 0.29 (i.e. very weak); thus, WG was removed from the TR scale and analysed as a single item.
Completion rates and questionnaire acceptability
In total, 660 questionnaires were available for analysis. The completion rate was 90% at 3 months (227 out of 253 patients attended their appointment, 5 had died, 18 were lost to follow-up and 3 were too unwell) and 71% at 6 months (180 out of 253 patients attended their appointment, 8 had died, 54 were lost to follow-up, four did not comply and 7 were too unwell).
For the QLQ-C30, missing answers ranged from none for question 4 to 15 for question 18, with around half of the missing answers being from patients in the United Kingdom. For the QLQ-GINET21, missing answers ranged from 2 for question 44 to 26 for question 46, with most missing answers being from patients in Italy. There was no difference in mean Karnofsky Performance Status score between attendees and non-attendees at 3 months (83.5 vs 86.0; P=0.28) or 6 months (85.2 vs 86.0; P=0.72).
Debriefing results
Of the 253 patients in the study, 209 filled in the debriefing questionnaire, 94 (45%) did so at the outpatient clinic, 59 (28%) at home and 56 (27%) elsewhere. The mean reported completion time for the QLQ-C30 and QLQ-GINET21 together was about 15 min, with 107 patients (52%) saying the total time was <10 min, 67 (32%) saying it took 11–15 min and 29 (14%) reporting a >15 min completion time; 6 patients (3%) did not answer this question. Overall, 199 patients (95%) completed both questionnaires in <20 min. Thirty-nine patients (19%) needed help to fill in the questionnaires, usually (in 33 cases) from a family member.
Thirteen patients (6%) found one or more items confusing or difficult to answer. These included questions 11, 26, 27, 29–33, 36, 45, 46 and 50 (see Appendix Table A1). Thirty-one patients (15%) found at least one question to be not relevant.
QLQ-GINET21 scale structure: reliability and test–retest reliability
The internal consistency of the QLQ-C30 and QLQ-GINET21 scales was calculated overall and at each time point separately (Table 2). Cronbach's α coefficients for all scales in the QLQ-C30 met the threshold of 0.70 (range 0.70–0.92) at baseline and improved consistently over time, with the exception of nausea and/or vomiting (NV), which decreased to 0.62 and 0.56 at the 3- and 6-month follow-ups, respectively. In the QLQ-GINET21, TR had the lowest α coefficient at baseline (0.49) but improved over time and reached the threshold of 0.70 at 6 months. DRW had an overall α coefficient of 0.87 and reached 0.93 at 6-month follow-up.
Table 2. Evaluation of internal consistency of the QLQ-GINET21 and QLQ-C30 scales.
| Cronbach's α | ||||||
|---|---|---|---|---|---|---|
|
Scales |
Baseline |
3 months |
6 months |
Overall |
No. of items |
ICCa |
|
QLQ-C30 | ||||||
| QL2 | 0.92 | 0.91 | 0.94 | 0.92 | 2: q29, q30 | 0.82 |
| PF2 | 0.82 | 0.83 | 0.78 | 0.82 | 5: q1–q5 | 0.96 |
| RF2 | 0.89 | 0.91 | 0.89 | 0.90 | 2: q6, q7 | 0.95 |
| EF | 0.87 | 0.87 | 0.88 | 0.88 | 4: q21–24 | 0.92 |
| CF | 0.70 | 0.77 | 0.73 | 0.73 | 2: q20, q25 | 0.86 |
| SF | 0.85 | 0.85 | 0.87 | 0.86 | 2: q26, q27 | 0.91 |
| FA | 0.87 | 0.86 | 0.86 | 0.87 | 3: q10, q12, q18 | 0.91 |
| NV | 0.74 | 0.62 | 0.56 | 0.68 | 2: q14, q15 | 0.79 |
| PA |
0.89 |
0.83 |
0.92 |
0.88 |
2: q9, q19 |
0.95 |
|
QLQ-GINET21 | ||||||
| ED | 0.73 | 0.70 | 0.74 | 0.73 | 3: q31–33 | 0.92 |
| GI | 0.71 | 0.77 | 0.79 | 0.75 | 5: q34–38 | 0.96 |
| TR | 0.49 | 0.62 | 0.71 | 0.62 | 2: q39, q40 | 0.95 |
| SF21 | 0.62 | 0.64 | 0.70 | 0.65 | 3: q42, q44, q49 | 0.95 |
| DRW | 0.84 | 0.83 | 0.93 | 0.87 | 3: q41, q43, q47 | 0.91 |
Abbreviations: AP=appetite loss; BI=body Image; CF=cognitive functioning; CO=constipation; DI=diarrhoea; DRW=disease-related worries; DY=dyspnoea; ED=endocrine symptoms; EF=emotional functioning; FA=fatigue; FI=financial difficultie; GI=gastrointestinal symptoms; ICC=intraclass correlation; INF=information; MBP=muscle and/or bone pain; NET=neuroendocrine tumour; NV=nausea and/or vomiting; PA=pain; PF2=physical functioning; QL2=global health; RF2=role functioning; SF=social functioning; SF21=social functioning of the new module; SL=sleep disturbance; SX=sexual functioning; TR=treatment-related symptoms; WG=weight gain.
(1) For the QLQ-C30: q8, DY (ICC=0.77); q11, SL (ICC=0.89); q13 AP (ICC=0.90); q16, CO (ICC=0.85); q17, DI (ICC=0.96); and q28, FIs (ICC=0.95)
(2) For the QLQ-GINET21: q45, BI (ICC=0.92); q46, WG (ICC=0.84); q48, MBP (ICC=0.87); q50, INF (ICC=0.87); and q51, SX ( ICC=0.90).
ICC (test–retest reliability statistics) for single items.
Reliability analysis was also carried out on the subgroup of patients with a pancreatic primary tumour; the Cronbach's α coefficient for the QLQ-C30 scales ranged from 0.80 to 0.89, and for the QLQ-GINET21 it was 0.80 for the ED, 0.79 for the GI, 0.54 for the TR, 0.57 for the SF21 and 0.83 for the DRW scales.
ICCs were calculated for 48 individuals who filled out the 6-month questionnaires two times (once at the 6-month visit and again 2 weeks later). All ICCs for the QLQ-C30 were >0.90, except those for the second global functioning score (QL2; 0.82), cognitive functioning (CF; 0.86), NV (0.79), dyspnoea (DY; 0.77), sleep disturbance (SL; 0.89) and constipation (CO; 0.85). The ICCs for the QLQ-GINET21 were also >0.90, except for the single items of WG (0.84), MBP (0.87) and INF (0.87) (Table 2). Although an ICC ⩾0.90 is ideal for discriminating between groups of patients in a clinical trial setting, an ICC ⩾0.70 is acceptable (Fayers, 2004).
Construct validity
For both questionnaires, all items had correlations >0.40 with their own scales (0.58–0.91), supporting item-convergent validity. Correlations between items and other scales were <0.40 (−0.05 to 0.36), with the exception of the correlation of the SF21 scale with questions 34, 41, 43 and 47 (r=0.45, 0.53, 0.64 and 0.50, respectively), and the correlation of the DRW scale with question 42 (r=0.63), supporting item-discriminant validity. Item-discriminant validity was also confirmed by all new module scales having correlations <0.70 with each other.
Clinical validity
The mean QLQ-GINET21 scale scores at baseline, and at 3 and 6 months post-baseline for different NETs are shown in Table 3. The variation in mean scores over time for items and scales can be regarded as a measure of responsiveness.
Table 3. QLQ-GINET21 scale mean scores at baseline, and at 3 and 6 months post-baseline, by cancer type.
| Pancreas | Unknown and other primaries | |||||
|---|---|---|---|---|---|---|
|
Scales |
Baseline |
3 months |
6 months |
Baseline |
3 months |
6 months |
|
QLQ-C30 | ||||||
| QL2 | 61 | 67 | 67 | 62 | 65 | 66 |
| PF2 | 79 | 79 | 78 | 79 | 78 | 80 |
| RF2 | 71 | 76 | 78 | 71 | 70 | 73 |
| EFa | 69 | 75 | 73 | 71 | 75 | 75 |
| CF | 83 | 84 | 83 | 81 | 82 | 81 |
| SF | 74 | 80 | 78 | 72 | 74 | 78 |
| FA | 36 | 34 | 32 | 35 | 34 | 35 |
| NVa | 14 | 10 | 9 | 13 | 8 | 8 |
| PA | 28 | 24 | 21 | 30 | 25 | 24 |
| DY | 16 | 18 | 14 | 20 | 21 | 20 |
| SL | 37 | 38 | 38 | 32 | 27 | 30 |
| APa | 24 | 18 | 16 | 20 | 14 | 12 |
| COa | 17 | 15 | 16 | 15 | 8 | 10 |
| DIa,b | 22 | 12 | 15 | 40 | 32 | 31 |
| FI |
19 |
21 |
24 |
18 |
20 |
15 |
|
QLQ-GINET21 | ||||||
| EDa | 22 | 16 | 18 | 25 | 19 | 20 |
| GIa | 26 | 18 | 22 | 26 | 23 | 23 |
| TR | 18 | 22 | 23 | 15 | 15 | 18 |
| SF21a | 39 | 33 | 30 | 41 | 36 | 35 |
| DRWa | 56 | 44 | 50 | 54 | 44 | 41 |
| MBP | 25 | 31 | 32 | 30 | 30 | 30 |
| SX | 32 | 31 | 31 | 36 | 33 | 36 |
| INF | 10 | 4 | 10 | 13 | 11 | 10 |
| BIa | 25 | 21 | 19 | 24 | 21 | 16 |
| WG | 11 | 9 | 13 | 11 | 10 | 10 |
Abbreviations: AP=appetite loss; BI=body Image; CF=cognitive functioning; CO=constipation; DI=diarrhoea; DRW=disease-related worries; DY=dyspnoea; ED=endocrine symptoms; EF=emotional functioning; FA=fatigue; FI=financial impact; GI=gastrointestinal symptoms; INF=information; MBP=muscle and/or bone pain; NET=neuroendocrine tumour; NV=nausea and/or vomiting; PA=pain; PF2=physical functioning; QL2=global health; RF2=role functioning; SF=social functioning; SF21=social functioning of the new module; SL=sleep disturbance; SX=sexual functioning; TR=treatment-related symptoms; WG=weight gain.
The mean change over time was borderline significant for EF (P=0.0459), AP (P=0.0376) and BI (P=0.0223), and strongly significant for NV (P=0.0037), CO (P=0.009), DI (P=0.0025), ED (P=0.0001), GI (P=0.0013), SF21 (P=0.0006) and DRW (P<0.0001).
The difference in the diarrhoea scale mean was statistically significant, with P<0.001 between two groups. None of the mean scales in the QLQ-GINET21 module was statistically significant between pancreatic and other NETs.
Changes for each scale and symptom were assessed over time and are shown in Figure 1, according to treatment group. There was a clear improvement in the ED scale for Group 1 (SMS analogues and interferon) from baseline to 3 months, with some worsening between 3 and 6 months; Group 2 also showed some improvement; however, the GI scale did not change over time in Group 1, but improved in Group 2 (all other treatments). There was little change in the TR scale over time in either treatment group. Interestingly, both SF21 and DRW improved only in Group 2. SX worsened over time in Group 1 but improved in Group 2. BI was worse in Group 2 at the 6-month time point, whereas there were no notable changes over time in Group 1. Other changes over time were small. Overall, the mean change of the QLQ-GINET21 scales over time was statistically significant for ED (P=0.0012), GI (P=0.0081), SF21 (P=0.0065), DRW (P<0.0001) and borderline for BI (P=0.0488). Differences in mean scores between treatment Group 1 (SMS analogues and interferon) and Group 2 (all other treatments) were borderline statistically significant for GI (P=0.0544), TR (P=0.0833), SF (P=0.0067), DRW (P=0.0438) and BI (P=0.0699), and not significant for all other scales and items.
Figure 1.

QLQ-GINET21 scale and single-item mean scores at baseline, and at 3 and 6 months post-baseline (x axis: scale/item; y axis: mean score). The subscripts of 1 and 2 represent Group 1 and Group 2, respectively.
The ability of the QLQ-GINET21 to assess differences between groups at a specific time point was examined using Karnofsky Performance Status scores at baseline classified into two groups (<80 and ⩾80). The difference in QLQ-GINET21 score of different scales between the above-mentioned Karnofsky groups was evaluated by the Mann–Whitney U-test. The results showed that the QLQ-GINET21 was able to assess differences between the two Karnofsky groups, showing statistically significant results for ED, GI, TR, SF21, DRW, MBP, SX and BI scales (in all cases, P<0.001), and for INF (P=0.0029), but not for WG (P=0.869). Similar significant results were found for the majority of core QLQ-C30 questionnaire scales: QL2, physical functioning (PF2), CF, SF and NV (in all cases, P<0.0001), role functioning (RF2; P=0.0002), emotional functioning (EF; P=0.0026), fatigue (FA; P=0.0194), pain (PA; P=0.001), DY (P=0.0002), SL (P=0.0004), CO (P=0.033), but not for appetite loss (AP; P=0.557), diarrhoea (DI; P=0.50) or financial difficulties (FI; P=0.105).
In addition to the known-group analyses, the mean scores of scales in the QLQ-C30 and QLQ-GINET21 at baseline, and at 3 and 6 months were described. Using repeated-measure ANOVA, the difference in the mean scores between pancreatic NETs and those of other origins were investigated (Table 3).
For the QLQ-C30, overall, only the mean score for the DI scale was statistically significantly different (P<0.0001); borderline significance was found for SL (P=0.0376) between pancreatic and other NETs. The mean change in values over time (baseline, and 3 and 6 months) was strongly significant for the scales of CO (P=0.0067), DI (P=0.0017) and NV (P=0.002), but borderline for EF (P<0.05) and AP (P=0.03).
For patients with pancreatic cancer, mean scales of the QLQ-C30 were higher than patients with non-pancreatic cancer for QL2 (65 vs 64), RF2 (75 vs 71), CF (83 vs 81) and SF (77 vs 74), and were lower for PA (25 vs 26), DY (16 vs 20), DI (17 vs 35), SF21 (35 vs 38), MBP (29 vs 30), SX (32 vs 35) and INF (8 vs 12). There was no statistically significant difference between these two groups of primary sites in any of the scales in the QLQ-GINET21.
All correlations between the QLQ-C30 and the QLQ-GINET21 scales were <0.70, except for SF21, which for both scales was −0.70 (Table 4).
Table 4. Correlation between QLQ-C30 and QLQ-GINET scales.
| Scales | ED | GI | TR | SF21 | DRW | MBP | SX | INF | BI | WG |
|---|---|---|---|---|---|---|---|---|---|---|
| QL2 |
−0.32 |
−0.55 |
−0.37 |
−0.53 |
−0.38 |
−0.37 |
−0.45 |
−0.20 |
−0.32 |
−0.16 |
| PF2 |
−0.32 |
−0.48 |
−0.34 |
−0.52 |
−0.34 |
−0.48 |
−0.52 |
−0.15 |
−0.28 |
−0.20 |
| RF2 |
−0.25 |
−0.49 |
−0.39 |
−0.61 |
−0.34 |
−0.29 |
−0.51 |
−0.18 |
−0.34 |
−0.16 |
| EF |
−0.40 |
−0.52 |
−0.39 |
−0.56 |
−0.58 |
−0.35 |
−0.46 |
−0.27 |
−0.29 |
−0.20 |
| CF |
−0.33 |
−0.43 |
−0.38 |
−0.47 |
−0.33 |
−0.35 |
−0.42 |
−0.22 |
−0.14 |
−0.17 |
| SF |
−0.29 |
−0.53 |
−0.40 |
−0.70 |
−0.41 |
−0.30 |
−0.52 |
−0.20 |
−0.39 |
−0.13 |
| FA |
0.36 |
0.60 |
0.43 |
0.56 |
0.41 |
0.46 |
0.49 |
0.20 |
0.31 |
0.26 |
| NV |
0.32 |
0.49 |
0.29 |
0.32 |
0.24 |
0.25 |
0.28 |
0.15 |
0.18 |
0.24 |
| PA |
0.35 |
0.64 |
0.33 |
0.49 |
0.36 |
0.53 |
0.30 |
0.22 |
0.21 |
0.19 |
| DY |
0.35 |
0.34 |
0.29 |
0.35 |
0.23 |
0.37 |
0.37 |
0.19 |
0.12 |
0.25 |
| SL |
0.26 |
0.40 |
0.31 |
0.34 |
0.37 |
0.32 |
0.33 |
0.19 |
0.13 |
0.20 |
| AP |
0.23 |
0.49 |
0.24 |
0.38 |
0.28 |
0.20 |
0.30 |
0.13 |
0.33 |
0.03 |
| CO |
0.16 |
0.36 |
0.02 |
0.15 |
0.07 |
0.15 |
0.20 |
0.03 |
0.02 |
0.13 |
| DI |
0.20 |
0.36 |
0.25 |
0.36 |
0.24 |
0.17 |
0.17 |
0.12 |
0.33 |
0.09 |
| FI | 0.25 | 0.16 | 0.23 | 0.33 | 0.26 | 0.28 | 0.27 | 0.18 | 0.14 | 0.19 |
Abbreviations: AP=appetite; BI=body image; CF=cognitive functioning; CO=constipation; DI=diarrhoea; DRW=disease-related worries; DY=dyspnoea; ED=endocrine symptoms; EF=emotional functioning; FA=fatigue; FI=financial impact; GI=gastrointestinal symptoms; INF=information; MBP=muscle and/or bone pain; NET=neuroendocrine tumour; NV=nausea and/or vomiting; PA=pain; PF2=physical functioning; QL2=global health; RF2=role functioning; SF=social functioning; SF21=social functioning of the new module; SL=sleep disturbance; SX=sexual functioning; TR=treatment-related symptoms; WG=weight gain.
Discussion
The QLQ-GINET21 was conceived as a tool that could combine scales and single items that assess clinically meaningful QoL parameters. In practice, it might be useful to review each item separately to identify specific problems experienced by individual patients. As a research tool, however, it may be preferable to summarise the items in clinically appropriate scales to reduce the amount of data to be analysed and communicated. This validation study found the proposed scale structure of the QLQ-GINET21 questionnaire to be appropriate, with the exception of the WG item, which did not correlate well with the other items in the TR scale. Therefore, a scale structure that includes five scales and five single items was instead validated (Table 2). The scales demonstrate a good degree of internal consistency, with high Cronbach's α coefficients for all items, except for TR and SF21, which did not meet the threshold of 0.70 at baseline. The SF21 scale in the QLQ-GINET21 is a new type of scale, in which questions are ordered to assess how difficult SF is for the patient. The SF scale in the QLQ-C30 correlated quite highly with the SF21 scale in the QLQ-GINET21, confirming that both scales measure and assess similar aspects of the same problem. The SF21 scale in the QLQ-GINET21, however, seems to be sufficiently different to the SF scale in the QLQ-C30 for it to provide additional information; for example, it was more responsive to changes in SF that occurred over time. None of the other scales in the QLQ-GINET21 and QLQ-C30 showed high correlation, thus confirming that the QLQ-GINET21 provides additional information to the more generic QLQ-C30 tool. Scales/items within the QLQ-GINET21 that correlated moderately with each other were DRW, SF21 and SX, and one might therefore argue that these could be combined into one scale; however, because they may respond differentially to different NET therapies, it appears reasonable to keep them separate.
There was reasonably good compliance with the questionnaires and few missing items.
Changes in scores over time are to be expected. With SMS analogues and interferon, the ED scale for Group 1 was improved at 3 months from baseline but not at 6 months, as might be expected with initial improvement followed by tolerance to the SMS analogues. The GI symptoms did not improve in Group 1, which might be expected since SMS analogues can cause some GI symptoms as well as cure them; other therapies (Group 2) seemed to improve GI symptoms. DRW and SF21 improved only in Group 2, suggesting the use of a definitive treatment other than SMS analogues improved patients' psychosocial issues. The change in SX was different in the two groups and might imply an adverse effect of SMS analogues, although this would need further studies for confirmation.
The scales within the QLQ-GINET21 were more sensitive to differences between patient subgroups (as determined by patients' Karnofsky Performance Scores) and more responsive to changes over time than were the scales in the QLQ-C30. These properties might be considered the most important aspects of any clinical research tool, and highlight the importance of including disease-specific QoL assessments within clinical trials. The QLQ-GINET21 is designed to be used together with the existing QLQ-C30, and jointly they may provide a reliable tool that is useful for a broad evaluation of QoL in clinical studies of patients with GINETs.
The baseline QoL values for patients, as measured by both questionnaires, showed that there were variations between centres, which could be explained by differences in patient selection and patient characteristics (primary tumour site, tumour stage and baseline Karnofsky Performance Status). At baseline, all scales and single items seemed to distinguish between subgroups of patients on the basis of Karnofsky Performance Status. There was no correlation between Karnofsky Performance Status and the single item of WG in the QLQ-GINET21, which would be expected as, in the context of cancer, WG resulting from treatment would not be related to low functional status. Similarly, in the QLQ-C30, as might be expected, there was no correlation between Karnofsky Performance Status and the items of FI and CO; however, surprisingly, there was also a lack of correlation with DI, which is common to many GINETs and would be expected to be associated with a poorer performance status.
The data on most scales and single items of the QLQ-GINET21 were skewed toward low values, but responses covered the full range of scores for most of the new scales at all evaluation time points, thus confirming the response categories are appropriate.
Importantly, the QLQ-GINET21 was well accepted by patients; across all 660 questionnaires evaluated, the rate of missing values was ⩽2%, with the exception of question 40 (relating to repeated injection), where the rate of missing values was 7%, and question 51 (relating to sex life), where it was 5%. The fact that 91% of patients answered the questionnaires at the second time point was as expected, and the lower value of 71% at the third time point was not ideal but was similar to what has been found in other large multicentre validation studies.
The data comparing tumours of different origin suggest that the QLQ-GINET21 can be used for pancreatic as well as non-pancreatic NETs, although it is accepted that pancreatic numbers were too small for a proper validation in patients with this tumour type alone.
Conclusion
The QLQ-GINET21 has been confirmed in this phase 4 validation study to have a module structure and scales that are clinically sensitive, reliable and valid. We recommend that this disease-specific module is used in randomised clinical trials of therapies, which would give further information on its clinical utility; indeed, some such trials are already in progress.
Acknowledgments
We acknowledge all centres, investigators and patients who took time to participate in the study. In addition to the authors, thanks are due to principal investigators and other co-workers, who were: Professor David Gross, Tel Aviv, Israel; Mr Colin Johnson, Southampton, UK; Dr Orhan Sezar and Dr Claudia Fleissner, Berlin, Germany; Professor Michael Koller, Marburg, Germany; Professor Massimo Falconi and Dr Rossella Bettini, Verona, Italy; Professor Olimpia Pino, Parma, Italy; Professor Larry Kvols, Tampa, FL, USA; Professor Ramon Salazar, Madrid, Spain; Dr Gregory Kaltsas, Athens, Greece; Dr Jaroslaw Cwikla, Warsaw, Poland; Dr Albert Davies, Barrow-in-Furness, UK; and Mr Mohammad E Yadegarfar (Newcastle, UK) for creating and maintaining the database. In addition, we thank Dr Annette Keith and Jenny Charlton of Porterhouse Medical Ltd for assistance in editing the manuscript. Novartis Pharmaceuticals provided financial assistance directly to Porterhouse Medical Ltd for the work performed, but without influencing any matters relating to the content. This project was supported by a grant from the EORTC Quality of Life Group and by the Pelican Cancer Foundation. Novartis Pharmaceuticals provided funding for editorial assistance, but had no involvement in the development of the manuscript. The project received service support from the National Institute of Health Research, United Kingdom.
Appendix
Table A1. EORTC QLQ-GINET21
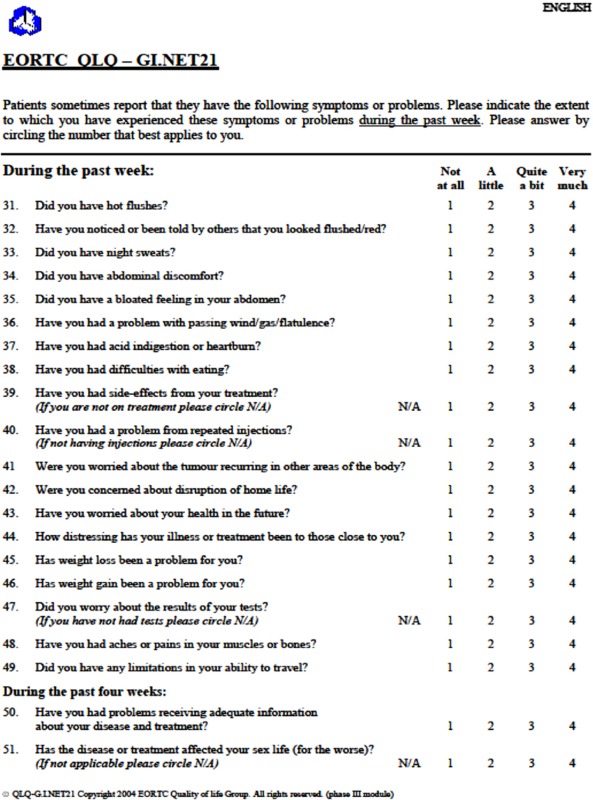
Table A2. Participating centres.
| Centre Name | Number Enroled | Percentage |
|---|---|---|
| UK centres: | ||
| Basingstoke | 32 | 12.7 |
| Cardiff | 2 | 0.8 |
| Christie | 5 | 2.0 |
| Imperial College | 4 | 1.6 |
| Kings College | 15 | 5.9 |
| Liverpool | 24 | 9.5 |
| Belfast | 5 | 2.0 |
| Newcastle | 7 | 2.8 |
| Royal Free | 9 | 3.6 |
| Southampton | 3 | 1.2 |
| International countries: | ||
| Netherlands: | ||
| Rotterdam | 31 | 12.3 |
| Amsterdam | 6 | 2.4 |
| Poland: Warsaw | 36 | 14.2 |
| Denmark: Copenhagen | 20 | 7.9 |
| Sweden: Uppsala | 16 | 6.3 |
| Italy: | ||
| Palma | 5 | 2.0 |
| Verona | 6 | 2.4 |
| Germany: Berlin | 10 | 4.0 |
| Spain: Madrid | 8 | 3.2 |
| Israel: Jerusalem | 7 | 2.8 |
| Greece: Athens | 2 | 0.8 |
| Total | 253 | 100 |
Novartis Pharmaceuticals helped to fund this work, but the validation of this module was not related to specific therapeutic agents. Novartis had no influence on the analysis of the trial or on the manuscript. The use of the module will be governed by the EORTC Quality of Life Department and will be free to academic users. A charge will be levied for commercial usage.
Footnotes
This work is published under the standard license to publish agreement. After 12 months the work will become freely available and the license terms will switch to a Creative Commons Attribution-NonCommercial-Share Alike 3.0 Unported License.
References
- Ahmed A, Turner G, King B, Jones L, Culliford D, McCance D, Ardill J, Johnston BT, Poston G, Rees M, Buxton-Thomas M, Caplin M, Ramage JK. Midgut neuroendocrine tumours with liver metastases: results of the UKINETS study. Endocr Relat Cancer. 2009;16 (3:885–894. doi: 10.1677/ERC-09-0042. [DOI] [PubMed] [Google Scholar]
- Bonett DG. Sample size requirements for testing and estimating coefficient alpha. J Educ Behav Stat. 2002;27:335–340. [Google Scholar]
- Cella DF, Tulsky DS, Gray G, Sarafian B, Linn E, Bonomi A, Silberman M, Yellen SB, Winicour P, Brannon J. The Functional Assessment of Cancer Therapy scale: development and validation of the general measure. J Clin Oncol. 1993;11 (3:570–579. doi: 10.1200/JCO.1993.11.3.570. [DOI] [PubMed] [Google Scholar]
- Cronbach LJ, Warrington WG. Time-limit tests: estimating their reliability and degree of speeding. Psychometrika. 1951;16 (2:167–188. doi: 10.1007/BF02289113. [DOI] [PubMed] [Google Scholar]
- Cull A, Sprangers M, Bjordal K, Aaronson N, West K, Bottomley A.2002. EORTC Quality of Life Group translation procedure Available at: http://groupseortcbe/qol/downloads/200202translation_manualpdf
- Davies AH, Larsson G, Ardill J, Friend E, Jones L, Falconi M, Bettini R, Koller M, Sezer O, Fleissner C, Taal B, Blazeby JM, Ramage JK. Development of a disease-specific Quality of Life Questionnaire module for patients with gastrointestinal neuroendocrine tumours. Eur J Cancer. 2006;42 (4:477–484. doi: 10.1016/j.ejca.2005.10.025. [DOI] [PubMed] [Google Scholar]
- Davies AHG, Mason T, Stangou AJ.al e (2003Neuroendocrine tumours of the gut, liver and pancreas: overall survival in a large cohort Gut 52A38 [Google Scholar]
- Davis Z, Moertel CG, McIlrath DC. The malignant carcinoid syndrome. Surg Gynecol Obstet. 1973;137 (4:637–644. [PubMed] [Google Scholar]
- Efficace F, Osoba D, Gotay C, Sprangers M, Coens C, Bottomley A. Has the quality of health-related quality of life reporting in cancer clinical trials improved over time? Towards bridging the gap with clinical decision making. Ann Oncol. 2007;18 (4:775–781. doi: 10.1093/annonc/mdl494. [DOI] [PubMed] [Google Scholar]
- Ellis L, Shale MJ, Coleman MP. Carcinoid tumors of the gastrointestinal tract: trends in incidence in England since 1971. Am J Gastroenterol. 2010;105 (12:2563–2569. doi: 10.1038/ajg.2010.341. [DOI] [PubMed] [Google Scholar]
- Fayers PM. Quality-of-life measurement in clinical trials – the impact of causal variables. J Biopharm Stat. 2004;14 (1:155–176. doi: 10.1081/bip-120028512. [DOI] [PubMed] [Google Scholar]
- Fayers PM, Aaronson NK, Bjordal K, Groenvold M, Curran D, Bottomley A, on behalf of the EORTC Quality of Life Group 2001The EORTC QLQ-C30 Scoring Manual3rd ednEuropean Organisation for Research and Treatment of Cancer: Brussels [Google Scholar]
- Hays RD, Havashi T, Carson S, Ware JE. User's Guide for the Multitrait Analysis Program (MAP) Rand: Santa Monica, Canada; 1988. [Google Scholar]
- Hemminki K, Li X. Familial carcinoid tumors and subsequent cancers: a nation-wide epidemiologic study from Sweden. Int J Cancer. 2001a;94 (3:444–448. doi: 10.1002/ijc.1473. [DOI] [PubMed] [Google Scholar]
- Hemminki K, Li X. Incidence trends and risk factors of carcinoid tumors: a nationwide epidemiologic study from Sweden. Cancer. 2001b;92 (8:2204–2210. doi: 10.1002/1097-0142(20011015)92:8<2204::aid-cncr1564>3.0.co;2-r. [DOI] [PubMed] [Google Scholar]
- Jacobsen MB, Hanssen LE. Clinical effects of octreotide compared to placebo in patients with gastrointestinal neuroendocrine tumours. Report on a double-blind, randomized trial. J Intern Med. 1995;237 (3:269–275. doi: 10.1111/j.1365-2796.1995.tb01175.x. [DOI] [PubMed] [Google Scholar]
- Janson ET, Holmberg L, Stridsberg M, Eriksson B, Theodorsson E, Wilander E, Oberg K. Carcinoid tumors: analysis of prognostic factors and survival in 301 patients from a referral center. Ann Oncol. 1997;8 (7:685–690. doi: 10.1023/a:1008215730767. [DOI] [PubMed] [Google Scholar]
- Kavadas V, Blazeby JM, Conroy T, Sezer O, Holzner B, Koller M, Buckels J. Development of an EORTC disease-specific Quality of Life Questionnaire for use in patients with liver metastases from colorectal cancer. Eur J Cancer. 2003;39 (9:1259–1263. doi: 10.1016/s0959-8049(03)00236-3. [DOI] [PubMed] [Google Scholar]
- Kirshbom PM, Kherani AR, Onaitis MW, Feldman JM, Tyler DS. Carcinoids of unknown origin: comparative analysis with foregut, midgut, and hindgut carcinoids. Surgery. 1998;124 (6:1063–1070. doi: 10.1067/msy.1998.93105. [DOI] [PubMed] [Google Scholar]
- Larsson G, Haglund K, Von Essen L. Distress, quality of life and strategies to ‘keep a good mood' in patients with carcinoid tumours: patient and staff perceptions. Eur J Cancer Care (Engl) 2003;12 (1:46–57. doi: 10.1046/j.1365-2354.2003.00322.x. [DOI] [PubMed] [Google Scholar]
- Larsson G, Sjoden PO, Oberg K, Eriksson B, von Essen L. Health-related quality of life, anxiety and depression in patients with midgut carcinoid tumours. Acta Oncol. 2001;40 (7:825–831. doi: 10.1080/02841860152703445. [DOI] [PubMed] [Google Scholar]
- Larsson G, Sjoden PO, Oberg K, von Essen L. Importance-satisfaction discrepancies are associated with health-related quality of life in five-year survivors of endocrine gastrointestinal tumours. Ann Oncol. 1999a;10 (11:1321–1327. doi: 10.1023/a:1008360718646. [DOI] [PubMed] [Google Scholar]
- Larsson G, von Essen L, Sjoden PO. Health-related quality of life in patients with endocrine tumours of the gastrointestinal tract. Acta Oncol. 1999b;38 (4:481–490. doi: 10.1080/028418699432022. [DOI] [PubMed] [Google Scholar]
- Modlin IM, Lye KD, Kidd M. A 5-decade analysis of 13,715 carcinoid tumors. Cancer. 2003;97 (4:934–959. doi: 10.1002/cncr.11105. [DOI] [PubMed] [Google Scholar]
- Modlin IM, Oberg K, Chung DC, Jensen RT, de Herder WW, Thakker RV, Caplin M, Delle Fave G, Kaltsas GA, Krenning EP, Moss SF, Nilsson O, Rindi G, Salazar R, Ruszniewski P, Sundin A. Gastroenteropancreatic neuroendocrine tumours. Lancet Oncol. 2008;9 (1:61–72. doi: 10.1016/S1470-2045(07)70410-2. [DOI] [PubMed] [Google Scholar]
- Modlin IM, Sandor A. An analysis of 8305 cases of carcinoid tumors. Cancer. 1997;79 (4:813–829. doi: 10.1002/(sici)1097-0142(19970215)79:4<813::aid-cncr19>3.0.co;2-2. [DOI] [PubMed] [Google Scholar]
- Nave H, Mossinger E, Feist H, Lang H, Raab H. Surgery as primary treatment in patients with liver metastases from carcinoid tumors: a retrospective, unicentric study over 13 years. Surgery. 2001;129 (2:170–175. doi: 10.1067/msy.2001.110426. [DOI] [PubMed] [Google Scholar]
- Nunnally J, Bernstein I.1994Psychometric Theory3rd edition edMcGraw-Hill: New York [Google Scholar]
- O'Toole D, Ducreux M, Bommelaer G, Wemeau JL, Bouche O, Catus F, Blumberg J, Ruszniewski P. Treatment of carcinoid syndrome: a prospective crossover evaluation of lanreotide versus octreotide in terms of efficacy, patient acceptability, and tolerance. Cancer. 2000;88 (4:770–776. doi: 10.1002/(sici)1097-0142(20000215)88:4<770::aid-cncr6>3.0.co;2-0. [DOI] [PubMed] [Google Scholar]
- Ramage JK, Ahmed A, Ardill J, Bax N, Breen DJ, Caplin ME, Corrie P, Davar J, Davies AH, Lewington V, Meyer T, Newell-Price J, Poston G, Reed N, Rockall A, Steward W, Thakker RV, Toubanakis C, Valle J, Verbeke C, Grossman AB. Guidelines for the management of gastroenteropancreatic neuroendocrine (including carcinoid) tumours (NETs) Gut. 2012;61 (1:6–32. doi: 10.1136/gutjnl-2011-300831. [DOI] [PMC free article] [PubMed] [Google Scholar]
- Ramage JK, Davies AH. Measurement of quality of life in carcinoid/neuroendocrine tumours. Endocr Relat Cancer. 2003;10 (4:483–486. doi: 10.1677/erc.0.0100483. [DOI] [PubMed] [Google Scholar]
- Shebani KO, Souba WW, Finkelstein DM, Stark PC, Elgadi KM, Tanabe KK, Ott MJ.1999Prognosis and survival in patients with gastrointestinal tract carcinoid tumors Endocr Relat Cancer 229(6815–821.discussion 822–823 [DOI] [PMC free article] [PubMed] [Google Scholar]
- Snow ND, Liddle RA.1995Neuroendocrine tumorsIn Gastrointestinal Cancers: Biology, Diagnosis and Therapy, Rustigi AK (ed), p585., Lippincott-Raven: Philadelphia [Google Scholar]
- Soga J. Statistical evaluation of 2001 carcinoid cases with metastases, collected from literature: a comparative study between ordinary carcinoids and atypical varieties. J Exp Clin Cancer Res. 1998;17 (1:3–12. [PubMed] [Google Scholar]
- Soreide JA, van Heerden JA, Thompson GB, Schleck C, Ilstrup DM, Churchward M. Gastrointestinal carcinoid tumors: long-term prognosis for surgically treated patients. World J Surg. 2000;24 (11:1431–1436. doi: 10.1007/s002680010236. [DOI] [PubMed] [Google Scholar]
- Tabachnik BJ, Fidel LS. Using Multivariate Statistics. Harper and Row: London; 1993. [Google Scholar]
- Vinik E, Carlton CA, Silva MP, Vinik AI. Development of the Norfolk quality of life tool for assessing patients with neuroendocrine tumors. Pancreas. 2009;38 (3:e87–e95. doi: 10.1097/MPA.0b013e31819b6441. [DOI] [PubMed] [Google Scholar]
- Walter SD, Eliasziw M, Donner A. Sample size and optimal designs for reliability studies. Stat Med. 1988;17:101–110. doi: 10.1002/(sici)1097-0258(19980115)17:1<101::aid-sim727>3.0.co;2-e. [DOI] [PubMed] [Google Scholar]
- Wangberg B, Westberg G, Tylen U, Tisell L, Jansson S, Nilsson O, Johansson V, Schersten T, Ahlman H.1996Survival of patients with disseminated midgut carcinoid tumors after aggressive tumor reduction World J Surg 20(7892–899.discussion 899 [DOI] [PubMed] [Google Scholar]
- Wareham NJ, Jakes RW, Rennie KL, Mitchell J, Hennings S, Day NE. Validity and repeatability of the EPIC-Norfolk Physical Activity Questionnaire. Int J Epidemiol. 2002;31 (1:168–174. doi: 10.1093/ije/31.1.168. [DOI] [PubMed] [Google Scholar]
- Wheeler MH, Maddox P, Maddineni S, Jordan S, Amer K, Butchart E. Surgical treatment of carcinoid tumours. Przegl Lek. 2000;57 (Suppl 5:95–97. [PubMed] [Google Scholar]
- Wymenga AN, Eriksson B, Salmela PI, Jacobsen MB, Van Cutsem EJ, Fiasse RH, Valimaki MJ, Renstrup J, de Vries EG, Oberg KE. Efficacy and safety of prolonged-release lanreotide in patients with gastrointestinal neuroendocrine tumors and hormone-related symptoms. J Clin Oncol. 1999;17 (4:1111. doi: 10.1200/JCO.1999.17.4.1111. [DOI] [PubMed] [Google Scholar]