

Abstract
Electrophysiological and fMRI-based investigations of the ventral temporal cortex of primates provide strong support for regional specialization for the processing of faces. These responses are most frequently found in or near the fusiform gyrus, but there is substantial variability in their anatomical location and response properties. An outstanding question is the extent to which ventral temporal cortex participates in processing dynamic, expressive aspects of faces, a function usually attributed to regions near the superior temporal cortex. Here, we investigated these issues through intracranial recordings from eight human surgical patients. We compared several different aspects of face processing (static and dynamic faces; happy, neutral, and fearful expressions) with power in the high-gamma band (70–150 Hz) from a spectral analysis. Detailed mapping of the response characteristics as a function of anatomical location was conducted in relation to the gyral and sulcal pattern on each patient’s brain. The results document responses with high responsiveness for static or dynamic faces, often showing abrupt changes in response properties between spatially close recording sites and idiosyncratic across different subjects. Notably, strong responses to dynamic facial expressions can be found in the fusiform gyrus, just as can responses to static faces. The findings suggest a more complex, fragmented architecture of ventral temporal cortex around the fusiform gyrus, one that includes focal regions of cortex that appear relatively specialized for either static or dynamic aspects of faces.
INTRODUCTION
How the brain is able to decode identity, gender, emotion, and other attributes of faces with such apparent efficiency has been a major topic of investigation. An early and influential model postulated a “divide-and-conquer” approach to the problem, with different aspects of facial information processed by functionally separate streams (Bruce & Young, 1986), which are now known to map onto neural pathways that are partly neuroanatomically segregated. Such segregation has been proposed in particular for dynamic (changeable) and static (unchangeable) face information (Haxby, Hoffman, & Gobbini, 2000). Here, static features refer to those things about an individual’s face that do not change quickly, such as identity, race, and gender, and changeable features refer to emotion, gaze, and mouth movements, which all participate in social communication. According to this model, motivated primarily by results from fMRI studies, the lateral part of the fusiform gyrus, which contains the face-selective fusiform face area (FFA), processes static aspects of faces (Kanwisher, McDermott, & Chun, 1997; McCarthy, Puce, Gore, & Allison, 1997), whereas the lateral temporal cortex around the STS processes changeable information (Hoffman & Haxby, 2000).
A number of behavioral and functional imaging studies, however, support some form of interaction between processing of these two processing streams (Vuilleumier & Pourtois, 2007; Ishai, Pessoa, Bikle, & Ungerleider, 2004; Baudouin, Gilibert, Sansone, & Tiberghien, 2000; Schweinberger & Soukup, 1998), but it remains unclear where this might happen. Direct electrophysiological recordings from the human brain offer the spatial resolution to investigate these issues. Intracranial ERP studies have revealed responses to static faces in fusiform cortex (Allison, Puce, Spencer, & McCarthy, 1999; Allison, Ginter, et al., 1994; Allison, McCarthy, Nobre, Puce, & Belger, 1994). On the other hand, functional imaging studies have shown that face motion can also activate this region (Schultz & Pilz, 2009; Sato, Kochiyama, Yoshikawa, Naito, & Matsumura, 2004; LaBar, Crupain, Voyvodic, & McCarthy, 2003). Analyzing the same data set as the one in this study, we previously found responses to both unchangeable and changeable aspects of faces that could be decoded better from ventral than lateral temporal cortex using spectral decoding (Tsuchiya, Kawasaki, Oya, Howard, & Adolphs, 2008). Given the different approaches used, it remains unclear as to what extent neurons in the ventral temporal lobe respond to static and dynamic faces, whether these aspects of faces are coded by the same neuronal populations or whether they are represented in different subregions. Here, we addressed this issue by recording intracranial responses from the fusiform gyrus while participants viewed static as well as dynamic facial expressions, allowing us to investigate the differential responses seen to the two classes of stimuli within the same person and same neural region. Our results suggest that ventral temporal cortex around the fusiform gyrus is relatively fragmented into subregions that respond best to either unchangeable or changeable aspects of faces.
METHODS
Participants
Participants were eight neurosurgical patients with medically intractable epilepsy that was resistant to antiseizure medication therapy and were undergoing clinical invasive seizure monitoring to localize seizure foci. The research protocol was approved by the institutional review board of the University of Iowa, and all subjects signed informed consent before participation. The data analyzed here have been previously used in another study that focused on spectral decoding (Tsuchiya et al., 2008).
Stimuli
Stimuli were made from grayscale pictures of neutral, happy, and fearful expressions of four individuals (two women) selected from the Ekman and Friesen set (Figure 1; Ekman & Friesen, 1976). Each face was equated for size, mean brightness, mean contrast, and position and framed in an elliptical window using MATLAB (Mathworks, Natick, MA). The faces subtended 7.5° × 10° of visual angle. Intermediate morphs during the dynamic phase of stimulation were created from 28 evenly spaced linear interpolations between the initial neutral face and the ending emotional face using morphing software (Morph 2.5, Gryphon Software, San Diego, CA). The interpolations were based on the starting and ending positions of manually selected fiducial points and were made with respect to both warping (pixel position) and pixel luminance. During the dynamic phase, intermediate morphs were incremented at a frame rate of 60 Hz, creating the impression of smooth facial motion changing from neutral face to either a happy face (morph-to-happy) or a fearful face (morph-to-fear) over 500 msec (Figure 1). Dynamic nonface comparison stimuli (control trial) were generated from a radial checker pattern with black/white square wave modulation at around 0.25°/cycle framed in an elliptical window (Figure 1). The pattern was presented statically for 1 sec, followed by a 0.5-sec dynamic period in which the luminance boundaries moved radially, expanding or contracting at a velocity of 0.5°/sec. We presented the stimuli using the Psychophysics Toolbox version 2.55 (Brainard, 1997; Pelli, 1997) and MATLAB 5.2 on a PowerMac G4 running OS 9 (Apple, Cupertino, CA).
Figure 1.

Trial design. A trial began with a baseline static checker pattern for 1 sec (−1 to 0), followed either by a static neutral face or by a radial checker pattern (0–1). Two seconds from the trial onset, the static neutral face started to morph into either a fearful or a happy expression, or the radial checker pattern started to expand or contract. The morph period lasted 500 msec (1–1.5). The last frame in the morph movie stayed on for another 1 sec (1.5–2.5). After the stimulus was extinguished, subjects were prompted to make a response to discriminate the stimulus. At the bottom of the figure, time windows of epochs used in the epoch-based analysis are indicated by black bars.
Behavioral Task
Each session consisted 200 trials, including 80 trials of morph-to-fear (20 for each identity), 80 trials of morph-to-happy, and 40 trials of nonface control (20 expanding and 20 contracting). A session was divided into 20 blocks of 10 trials. Within each block, 10 different stimulus types (morph-to-fear and morph-to-happy of each of four individuals and expanding and contracting movements of checker pattern) were presented once in random order. Blocks were successively continued without interval delay. Therefore, each stimulus type appeared 20 times in each session in a pseudorandom order. Immediately before a session began, we instructed subjects that feature, either emotion or gender, they had to attend and respond to. Each participant completed two sessions, an emotion discrimination session and a gender discrimination session. Five participants underwent an emotion discrimination session first followed by a gender discrimination session, and the remaining three participants underwent a gender discrimination session first. The order of sessions was arbitrary, determined by an experimenter. A trial began with a static rectangular checker pattern for 1 sec, followed either by a still image of faces with neutral expression or by a radial checker pattern. After 1 sec of the still images, the dynamic phase of each stimulus began and lasted for 500 msec. The last frame in the morph movie stayed on for another 1 sec. After the stimulus was extinguished, participants were prompted to make a response to discriminate the stimulus (gender or emotion, depending on the task). A prompt reminded participants of the three alternatives: 1 = happy, 2 = other, and 3 = fear in the emotion discrimination sessions and 1 = woman, 2 = other, and 3 = man in the gender discrimination sessions. They were asked to answer “other” if they saw a checker pattern instead of a face. After the response, the next trial started. We did not put any time constraint on the response time and did not instruct participants whether to put priority on speed or accuracy of responses.
Anatomical Location of the Electrodes
Participants had several subdural and depth electrodes implanted (Ad-Tech Medical Instrument Corporation, Racine, WI) with up to 188 contacts. The location and number of electrodes varied depending on clinical consideration. We analyzed data recorded from contacts on the ventral temporal cortex around the fusiform gyrus. Electrodes were either four-contact strip electrodes or 2 × 8 contact strip-grid electrodes with interelectrode distance of 1 cm and 5 mm, respectively. Three participants had 16 contacts each in the right hemisphere (R), and five participants had 4–16 contacts (mean = 10.4) in the left hemisphere (L). In summary, a total of 48 contacts on R and 52 contacts on L made a grand total of 100 contacts across all participants. Each contact was a 4-mm-diameter disc made of platinum–iridium embedded in a silicone sheet with an exposed diameter of 2.3 mm.
For each participant, we obtained structural T1-weighted MRI volumes on a 3-T TIM Trio (Siemens, Erlangen, Germany) with both preimplantation and postimplantation, as well as CT scans (postimplantation only). For the MRI scans, coronal slices were obtained with 1-mm slice thickness and 0.78 × 0.78 mm in-plane resolution. Axial slices of the CT scans were obtained with 1-mm slice thickness and 0.47 × 0.47 mm in-plane resolution. Postimplantation CT scans and preimplantation MRI were rendered into 3-D volumes and coregistered using AFNI (NIMH, Bethesda, MD) and Analyze software (version 7.0, AnalyzeDirect, Stilwell, KS) with mutual information maximization. Postimplantation CT scans were used to identify the coordinates of the contacts. We transferred these coordinates onto the high-resolution preoperative MRI and obtained 2-D projections of the MRI from ventral views using in-house programs in MATLAB 7. We manually identified anatomical landmarks around the ventral temporal surface, including the inferior temporal gyrus (ITG), lateral and medial fusiform gyrus (LFG and MFG, respectively), and inferior lingual gyrus (ILG).
Electrocorticography Recording
The electrical potential at each electrode was referenced to an electrode placed under the scalp near the vertex of the skull. The impedances of the electrodes were 5–20 kΩ. Signals from the brain were filtered (1.6 Hz–1 kHz), digitized, and recorded using the Multichannel Neurophysiology Workstation (Tucker-Davis Technologies, Alachua, FL) and analyzed off-line using custom programs in MATLAB. In an initial two subjects, we used an LCD display (Multisync LCD 1760V, NEC, Tokyo, Japan) for stimulus presentation and recorded the electrophysiological signal at a sampling rate of 1 kHz. In the remaining six subjects, we used another LCD display (VX922, ViewSonic, Walnut, CA) and recorded the signal at 2 kHz. In both cases, the display refresh rate was 60 Hz. To measure the precise timing of visual stimulation, we presented a small white rectangle on the top left corner of the display at the onset of the stimulus and recorded changes of luminance with a photodiode along with the electrocorticography (ECoG).
Signal Processing
Artifact Rejection
We discarded any trial containing absolute ECoG potentials that exceeded the mean + 3 SD on raw data and high-pass filtered data (cutoff frequency = 24 Hz). We applied rejection on high-pass filtered data to remove small amplitude spikes that might go undetected in the raw data but can appear as wide-band noise after time–frequency analysis. Noisy trials were rejected on contact-by-contact and trial-by-trial basis using an automated homemade MATLAB program. Therefore, the number of trials that went into analysis for each stimulus category differed between contacts (see insets of Figures 2 and 3). Mean rejection rates for each stimulus category across all 100 ventral temporal contacts were 6.0%, 6.6%, and 4.5% for morph-to-fear, morph-to-happy, and nonface control trials, respectively, which were not significantly different from each other (p = .57, Kruskal–Wallis test). None of the cortical areas included in this study were within a seizure focus.
Figure 2.
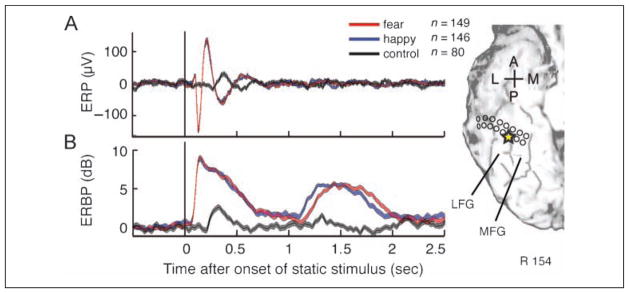
Face-responsive ERP elicited by static neutral faces (top traces) and ERBP elicited by both static and dynamic faces (bottom traces), recorded at the electrode located in the right LFG as indicated by the yellow star on an MRI surface rendering of the ventral temporal cortex. (A) Following the onset of the static neutral face at the beginning of the trial, we observed the positive–negative–positive (P150, N200, and P290) waveform corresponding to static neutral faces (Allison, Ginter, et al., 1994; Allison, McCarthy, et al., 1994); however, face motion did not elicit a detectable ERP. (B) In sharp contrast to ERPs, we observed robust ERBP responses elicited by both static faces and dynamic morphing of facial expression. Ranges between 1 SEM above and below mean ERP or ERBP are represented by the thickness of lines (red, morph-to-fear trial [n = 149]; blue, morph-to-happy trial [n = 146]; black, control [n = 80]). A = anterior; P = posterior; L = lateral; M = medial.
Figure 3.

ERBP responses to both static and dynamic stimuli. ERBPs were recorded on the left ventral cortex (A) and the right ventral cortex (B and C). 0 and 1 sec on the x axis indicate onsets of static and dynamic stimuli, respectively. Red, blue, and black ERBP plots represent responses to morph-to-fear, morph-to-happy, and nonface control, respectively. Thickness of lines represents 1 SEM from the mean. White and black stars indicate face-responsive ERBP elicited by static faces and dynamic faces, respectively. Red dots indicate epochs where ERBPs elicited by fearful dynamic faces were larger than those elicited by happy dynamic faces, and blue dots indicate epochs in which ERBPs elicited by happy dynamic faces were larger than those elicited by fearful dynamic faces. A = anterior; P = posterior; L = lateral; M = medial. Small numbers at the top right of each panel indicate, from top to bottom, numbers of trials for morph-to-fear, morph-to-happy, and nonface control trials. Larger numbers at the top left of each panel indicate the contact from which the recording was obtained (compare to anatomical images).
Spectral Analysis
For each trial, data were analyzed in the time–frequency domain by convolution with complex Gaussian Morlet wavelets w(t, f) defined as
where t is time, f is the center frequency, and σt is the standard deviation of the Gaussian envelope of the wavelet in the time domain (Tallon-Baudry & Bertrand, 1999). We adopted a ratio f/σf of 7, where σf is the standard deviation in the frequency domain, for five subbands in the high-gamma band range with these center frequencies: 73.5, 84.4, 97, 111, and 128 Hz. This results in wavelets with σf of 10.5, 12.1, 13.9, 15.9, and 18.3 Hz and respective σt of 15.2, 13.2, 11.5, 10.0, and 8.7 msec. We chose these center frequencies in the high-gamma band because we previously analyzed the same raw data and had found that ECoG components in the frequency range from 50 to 150 Hz carried information that discriminated faces from control geometric patterns as well as fearful from happy expressions (Tsuchiya et al., 2008). f/σf = 7 was chosen to balance time resolution and frequency resolution. The power envelope of the signal s(t) around frequency f is the squared modulus of the convolution,
Power of each trial within each subband around each center frequency was normalized by dividing by the median power during the baseline period from −600 to −200 msec before stimulus onset across all trials. We computed mean and standard error of mean (SEM) across all subbands and trials that belonged to a given stimulus/task category to obtain the event-related band power (ERBP).
Statistical Analysis
In the epoch-based analysis, we investigated the effect of face and emotion during static and dynamic stimulus periods by setting five epochs (Figure 1): (1) baseline (−550 to −250 msec before onset of static stimulus), (2) early static (150–450 msec after onset of static stimulus), (3) late static (550–850 msec after onset of static stimulus), (4) dynamic (150–450 msec after onset of dynamic stimulus), and (5) postdynamic (50–350 msec after offset of dynamic stimulus). We performed Wilcoxon rank sum tests to contrast the means of face and control trials and fearful and happy trials for each contact and for each epoch. Resultant p values were pooled across all contrasts, contacts, and epochs within each subject, and the level of statistical significance (q) was set at a false discovery rate (FDR) of <0.05 (Benjamini & Hochberg, 1995).
We defined the face-responsive ERBP to static face stimuli as the response that satisfied the following three criteria: (1) Mean ERBP responses of face trials were significantly greater in early and/or late static epochs than in the baseline epoch. (2) The mean ERBP elicited by the static faces was also significantly greater than the mean ERBP elicited by checkerboard control stimulus. (3) The maximum ERBP elicited by static face stimuli was at least 50% and 1 dB larger than the maximum ERBP elicited by control stimuli during the 1-sec period after onset of static faces. Similarly, we defined face-responsive ERBP in response to dynamic face stimuli as follows: (1) Mean ERBP responses of face trials was significantly larger than baseline in dynamic and/or post-dynamic epochs. (2) The mean ERBP elicited by dynamic face stimuli was significantly larger than the mean ERBP elicited by control stimuli. (3) The maximum ERBP elicited by dynamic face stimuli was at least 50% and 1 dB larger than the maximum ERBP elicited by control stimuli during the 1-sec period after onset of dynamic faces.
The effect of emotional facial motion on ERBP responses was tested only with face trials because there was no emotional content in the control trials. We based significant emotional modulation on the comparison between the mean ERBP elicited by morph-to-fear trials and morph-to-happy trials in either the dynamic or postdynamic epochs. We investigated emotional modulation across all 100 contacts regardless of the magnitude of ERBP responses and the face responsiveness at that contact to obtain a broad and an unbiased assessment.
To coordinate electrode locations across the eight subjects, contacts were localized in relation to the anatomy of the ventral temporal cortical surface. In the medial–lateral orientation, their location was specified by gyri on which electrodes resided. Location in the anterior–posterior orientation was specified according to the position in 10 equally divided segments from temporal pole to occipital pole, with the first segment being the most anterior and the tenth segment being the most posterior (cf. Figure 4). We chose this localization method instead of a numerical coordinate system given the known close relationship between cortical function and gyral–sulcal anatomy and given that the anatomy of the cortical surface is quite variable from subject to subject, especially in the ventral temporal cortex, precluding automated coregistration procedures (Spiridon, Fischl, & Kanwisher, 2006).
Figure 4.

A summary count is provided for each region whose boundaries are defined by gyri in medial–lateral direction and 10 equally divided segments in anterior–posterior direction. (A) Distribution of contacts with significant ERBP response to static and dynamic faces. Numbers in each segment indicate counts of electrodes with face-responsive ERBP across all subjects elicited by static face (top left), dynamic face (top right), both static and dynamic face (bottom left), and total number of contacts (bottom right). (B) Distribution of contacts with significant ERBP response to dynamic facial expression. Contacts with significant modulation of ERBP by dynamic facial expression were significantly more common in the right hemisphere than the left hemisphere (R: 19/48, L: 4/52; Fisher’s exact test, p = .0002). Numbers in each segment indicate counts of electrodes across all subjects that showed fear > happy (top left), happy > fear (top right), both fear > happy and happy > fear in different timing (bottom right), and the total number of contacts (bottom right).
To investigate the time course of modulation of the ERBP by expressive facial motion, we performed serial Wilcoxon rank sum tests comparing the averaged ERBP of fear trials and happy trials during every time point on 23 contacts with significant ERBP modulation by face motion. Resultant p values were pooled across all 23 contacts and across all time points over a 4-sec period starting from 1 sec before onset of static faces, and the level of significance was then corrected at FDR < 0.05. To show common tendencies in the time course of the response across contacts, p values at each time point were plotted for all 23 contacts as an overlapping time series (Figure 5).
Figure 5.

Modulation of ERBP by dynamic facial expression. (A) The figure shows a face-responsive ERBP elicited by both static (starting at 0) and dynamic (starting at 1, x-axis scale is same in A and B) epochs, recorded at the electrode located in the right LFG (same data as shown in Figure 2). The happy > fear modulation was seen in the early dynamic epoch, whereas a fear > happy modulation was seen in the late dynamic epoch. Thickness of ERBP lines represents ±1 SEM from mean. (B) Results of serial Wilcoxon rank sum tests of 23 contacts that have significant modulation by expressive facial motion. With this analysis, we could visualize that brief and/or less significant happy > fear responses that might have been missed with our epoch-based analysis were also temporally concentrated in earlier periods after the onset of the dynamic phase. Red lines indicate responses to fearful dynamic faces that were significantly (FDR < 0.05) greater than those to happy dynamic faces, and blue lines indicate vice versa. (C) Same traces as B, with expanded time scale from 0 to 300 msec after the onset of the dynamic epoch (at 1 sec in A and B). Emotional modulation was seen as early as 120 msec following the onset of the motion.
Single-Trial Analysis
We applied receiver operating characteristic (ROC) analysis to assess how well ERBP responses to each category of stimulus can be separated on a single-trial basis. We performed ROC analyses for binary classification between ERBP of preferred and nonpreferred stimuli by sliding a threshold over the whole range of ERBP at each peristimulus time point. We computed area under the curve (AUC; Figure 6D and E). If distributions of ERBP of preferred and nonpreferred stimuli completely overlap, AUC equals to 0.5. The more distributions of ERBP of both stimuli separate, the more AUC deviates from 0.5; with more ERBP of preferred stimuli distributed at a larger value than nonpreferred stimuli, AUC approaches 1, and with an opposite case, it approaches 0. For discrimination of face from non-face control, face is the preferred stimulus. For discrimination of fear from happy, we regarded morph-to-fear as the preferred stimulus and morph-to-happy as the nonpreferred stimulus and vice versa for discrimination of happy from fear. As can be seen in Figure 6E, the AUC value was above 0.5 when the response to fear was larger than that to happy, and it was below 0.5 when the response to fear was smaller than that to happy. We report the maximum AUC between 50 and 900 msec after the onset of static and dynamic stimuli for discrimination of face from non-face stimuli across 24 and 27 contacts that were face responsive during early and late static epochs and dynamic and postdynamic epochs, respectively. For discrimination of fear from happy and happy from fear, we reported the maximum AUC between 50 and 900 msec after the onset of dynamic stimuli across 20 and 4 contacts whose ERBPs were fear > happy and happy > fear, respectively. The distribution of maximum AUCs for the discrimination of faces from 24 static and 27 dynamic face-responsive contacts was statistically contrasted against that of 76 and 73 not face-responsive contacts, respectively, using Wilcoxon rank sum tests. Similarly, the distribution of maximum AUCs for discrimination between fear and happy of 20 fear > happy and 4 happy > fear contacts was statistically tested against that of 80 and 96 contacts that did not respond selectively to emotions, respectively (Figure 6F–I). To see AUC of baseline activity, we computed the maximum AUC of all 100 contacts between 900 and 150 msec before the onset of static stimuli.
Figure 6.

(A), (B), and (C) show vertically stacked single-trial ERBPs of all trials of a representative contact in the right LFG, which is the same contact in Figure 2, Contact 3 of Figure 3C, and in Figure 5. ERBPs are sorted by maximum ERBP during the 50–900 msec period after onset of static stimuli in A and by maximum ERBP during the 50–900 msec period after onset of dynamic stimuli in B and C. Trials are grouped into face trials and nonface control trials in A and B and morph-to-fear, morph-to-happy, and nonface control trials in C. Most of the ERBPs responding to face stimuli in both static and dynamic epochs are larger than ERBPs elicited by nonface control stimuli. (D) AUC from our ROC analysis discriminating face from nonface control. The AUC reached almost 1 in both static and dynamic epochs. (E) AUC discrimination of morph-to-fear from morph-to-happy was not as good as discrimination of face from nonface control. (F) Histogram of maximum AUC discriminating face from nonface control after the onset of static stimuli (red, face-responsive contacts [n = 24]; black, not face-responsive contacts [n = 76] in early and late static epochs; gray, baseline of all contacts [n = 100]). (G) Histogram of maximum AUC discriminating face from nonface control after the onset of dynamic stimuli (red, face-responsive contacts [n = 27]; black, not face-responsive contacts [n = 73] in dynamic and postdynamic epochs; gray, baseline of all contacts [n = 100]). (H) Histogram of maximum AUC discriminating fear from happy (red, fear > happy contacts [n = 20]; black, not emotion-responsive contacts [n = 80]; gray, baseline of all contacts [n = 100]). (I) Histogram of maximum AUC discriminating happy from fear (red, happy > fear contacts [n = 4]; black, not emotion-responsive contacts [n = 96]; gray, baseline of all contacts [n = 100]).
RESULTS
Responses to Static and Dynamic Faces
Our stimuli of both faces and checker patterns elicited robust ERBP and ERP responses in the ventral temporal cortex (Figures 2 and 3; Supplementary Figures S2, S4, and S5). Face-responsive ERP sites were found distributed across ventral temporal cortex around the fusiform gyrus, consistent with previous reports (Allison et al., 1999). Following the onset of the static neutral face at the beginning of the trial, we observed the previously described positive–negative–positive (P150, N200, and P290) waveform (Allison, Ginter, et al., 1994; Allison, McCarthy, et al., 1994). However, unlike ERP responses that were found primarily for static stimuli but not for dynamic stimuli, robust ERBP responses were elicited by dynamic stimuli as well as static stimuli (Figures 2 and 3; Supplementary Figures S2, S4, and S5).
In each of our eight participants, we recorded face-responsive ERBPs in at least one electrode contact responding to either static or dynamic face stimulus or both (Figure 3; Supplementary Figures S4 and S5). The total number of face-responsive electrode contacts across eight participants responding to static and dynamic faces were 24 and 27, respectively, of 100 contacts. The distribution of face-responsive ERBP between R and L was not significantly different for static (R: 14/48 contacts, L: 10/52 contacts; Fisher’s exact test, p = .35) or dynamic (R: 15/48, L: 12/52; Fisher’s exact test, p = .38) faces (Figure 4). We did not see any difference in the overall distribution of static face-responsive sites and dynamic face-responsive sites across participants, except for slightly more dynamic face-responsive sites across both hemispheres. We found contacts responsive primarily to static faces, primarily to dynamic faces, and equally to both: Face-responsive ERBP were elicited only by static faces in 11 contacts (R: 5/48, L: 6/52), only by dynamic faces in 14 contacts (R: 6/48, L: 8/52), and by both static and dynamic stimuli in 13 of 100 contacts (R: 9/48, L: 4/52).
The existence of static-only and dynamic-only face-responsive contacts suggests that there might be partly separate neural systems involved in processing static and dynamic faces. Contacts with similar response properties, whether they were responsive to static faces, dynamic faces, or both, tended to cluster together as seen in Contacts 1–4, 9, and 10 of Figure 3B; Contacts 2, 3, 5, and 9 of Figure 3C; and Contacts 3, 10, and 11 of Supplementary Figure S4A. Transition from one type of response property to the other is often abrupt between clusters as seen between Contacts 9 and 10 and surrounding contacts of Figure 3B, where face responsiveness to dynamic faces steeply declined within 5 mm. On the other hand, some response changes were more gradual, such as the response to static faces in Contacts 1–4 of Figure 3B. These findings suggest that there are separate regions of cortex in the ventral temporal lobe, some more activated by static than dynamic faces and some showing the opposite responsiveness.
Responses to Different Emotions
Next, we investigated whether dynamic expressions of different emotions affect ERBP. Modulation of ERBP by expressive face motion was seen in 23 (R: 19/48, L: 4/52; p = .0002, Fisher’s exact test) of 100 contacts in six subjects. The majority of cortical sites where ERBP was modulated by dynamic face expressions showed greater ERBP responses for morph-to-fear than morph-to-happy faces. Such fear > happy response was seen in 20 contacts (R: 17/48, L: 3/52, six participants; Figure 4B). In only four contacts (R: 3/48, L: 1/52, three participants) did happy expressions elicit larger ERBPs than fearful expressions (Figure 3C; Supplementary Figures S3C and S4A). The happy > fear modulation was spatially limited such that it was found in isolation surrounded by cortical sites showing fear > happy modulation or no modulation (Figure 3C; Supplementary Figures S3C and S4A). In total, modulation of ERBP by expressive face motion was seen in 16 of 38 face-responsive contacts (Figure 3; Supplementary Figures S4A and S5A) and in 7 of 62 contacts that did not have face-responsive ERBP responses in either of the epochs (Contact 6 of Figure 3B; Contacts 6, 7, and 10 of Figure 3C and Supplementary Figure S3C; and Contact 1 of Supplementary Figure S4A).
We examined the time course of ERBP evoked by fearful and happy dynamic facial expressions in 23 contacts that had a significantly different response to the two emotions. Latencies to the development of differences in ERBPs evoked by dynamic faces of different emotions were as brief as 120 msec after stimulus onset. We found that early differences, which developed within 300 msec, were mostly because of responses elicited by happy as compared with fearful dynamic faces (Figure 5).
Single-trial- and Single-contact-based Analysis
Next, we examined face versus control or fearful motion versus happy motion responses on a single-trial, single-contact basis. In the contact in the right LFG shown in Figure 2 and Contact 3 of Figure 3C, most ERBPs responding to face stimuli in both static and dynamic epochs were larger than ERBPs elicited by nonface control stimuli (Figure 6A and B). The AUC from our ROC analysis reached almost 1 in both epochs (Figure 6D, maximum AUC of 0.99 for static and 0.99 for dynamic), demonstrating that maximum ERBPs from single trials can almost perfectly distinguish responses to faces from those to control checkerboards. Discrimination of morph-to-fear versus morph-to-happy was more difficult, as one might expect (Figure 6C and E). In this contact, maximum AUC for fear > happy reached 0.63, and maximum AUC for happy > fear was 0.70. The average of maximum AUC for detection of faces was 0.89 (0.72–1; Figure 6F) in static epochs across 24 static face-responsive contacts and 0.84 (0.65–1; Figure 6G) in dynamic epochs across 27 dynamic face-responsive contacts. Maximum AUCs of these contacts were significantly different from those of face-unresponsive contacts (Wilcoxon rank sum test, p < 1−12, 76 unresponsive contacts in static epochs; p < 1−5, 73 in dynamic epochs). The average of maximum AUC for discrimination of fear from happy was 0.67 (0.60–0.79; Figure 6H) with 20 fear > happy contacts, and happy from fear was 0.64 (0.61–0.70; Figure 6I) with four happy > fear contacts. Maximum AUCs of these contacts were significantly different from those of contacts that did not respond to emotional facial motion (p < 1−10, 80 unresponsive contacts for detection of morph-to-fear; p < .002, 96 for detection of morph-to-happy).
DISCUSSION
Stimuli used in this study consisted two distinct epochs within each trial: presentation of a static neutral face and dynamic change of expression from neutral to either fearful or happy. In the dynamic part, a specific aspect of changeable features (i.e., the emotional expression) was being changed, whereas unchangeable features of faces (their identity) were held constant. Unchangeable features refer to those things about an individual’s face that do not change quickly, such as identity, race, and gender, and changeable features refer to those that typically come into play during an emotional expression (Haxby et al., 2000). We employed a movie with gradual expression change from neutral to either fearful or happy in part because it is more natural to see facial expressions changing dynamically from neutral to an emotion than to see a static emotional face abruptly appearing.
Using the same set of data, we previously analyzed the power modulation of the intracranial EEG across wide frequency bands using a novel decoding approach and found that EEG components in the frequency range from 50 to 150 Hz carried information that discriminated faces from control geometric patterns as well as fearful from happy expressions. Importantly, we also found that decoding performance was highest around the MFG (Tsuchiya et al., 2008). Therefore, in this study, we focused our analysis on high-gamma band components in the fusiform gyrus to further elucidate how face information is represented there.
The ERBP in the high-gamma band elicited by static and dynamic faces provides evidence that human ventral temporal cortex around the fusiform gyrus processes not only unchangeable but also changeable aspects of faces. This region appears to be functionally divided into smaller heterogeneous subregions that can be differentially specialized for processing dynamic or static faces or indeed non-face stimuli. Latencies for the development of significant differences between responses evoked by fearful and happy face motions were as brief as 120 msec, suggesting that at least part of the response to dynamic face stimuli may be bottom–up (as opposed to requiring feedback from structures such as the amygdala or the STS, which would be expected to require longer latencies). To summarize the key conclusions from our findings:
There are small regional areas of cortex in the human ventral temporal lobe with face-responsive properties, a finding in line with electrophysiological and neuroimaging studies in monkeys as in humans (Freiwald, Tsao, & Livingstone, 2009; Moeller, Freiwald, & Tsao, 2008; Pinsk, DeSimone, Moore, Gross, & Kastner, 2005; Tsao, Freiwald, Knutsen, Mandeville, & Tootell, 2003; Allison et al., 1999; McCarthy, Puce, Belger, & Allison, 1999; Puce, Allison, & McCarthy, 1999; Allison, Ginter, et al., 1994; Perrett et al., 1985; Desimone, Albright, Gross, & Bruce, 1984; Perrett, Rolls, & Caan, 1982).
The precise location of these face-responsive regions varies from individual to individual.
Responses in ventral temporal cortex relatively encompass selectivity for unchangeable as well as changeable aspects of faces, with different small subregions specialized for one or the other or responding equally to both.
ERBP Elicited by Faces
The lateral part of the fusiform gyrus, the so-called FFA, is preferentially activated by faces, and a large volume of electrophysiological (Allison et al., 1999; McCarthy et al., 1999; Puce et al., 1999; Allison, Ginter, et al., 1994; Allison, McCarthy, et al., 1994), and imaging (Kanwisher et al., 1997; McCarthy et al., 1997; Puce, Allison, Asgari, Gore, & McCarthy, 1996) studies have confirmed this area’s involvement in face processing. In agreement with this literature, we recorded face-responsive ERPs with a typical waveform from ventral temporal cortex around the fusiform gyrus responding to static faces (Figure 2).
ERBP is widely used for investigations of local neuronal activity. Higher-frequency components of the EEG that are measured with the ERBP have been implicated in various cognitive functions in humans (Edwards et al., 2010; Nourski et al., 2009; Vidal, Chaumon, O’Regan, & Tallon-Baudry, 2006; Lachaux et al., 2005; Tanji, Suzuki, Delorme, Shamoto, & Nakasato, 2005; Pfurtscheller, Graimann, Huggins, Levine, & Schuh, 2003; Crone, Boatman, Gordon, & Hao, 2001; Crone, Miglioretti, Gordon, & Lesser, 1998). The spatial distribution of the ERBP in the gamma range is typically more focal than for electrophysiological measures in lower frequency bands, and functional maps inferred from the ERBP correspond well to the topographic maps derived from electrical cortical stimulation (Crone, Boatman, et al., 2001; Crone, Hao, et al., 2001; Crone et al., 1998). In nonhuman primates, power increases in ERBP correlate better with multiunit neuronal firing than power modulation in lower frequency bands (Whittingstall & Logothetis, 2009; Ray, Crone, Niebur, Franaszczuk, & Hsiao, 2008; Steinschneider, Fishman, & Arezzo, 2008).
It is important to note that our use of the term “face responsiveness” in this study is not meant to imply face selectivity in a more general sense but only the relative selectivity of responses to faces over those to checker patterns, without a more exhaustive comparison of responses to other object categories (which we did not undertake in this study).
Functional Specialization in FFA
An emerging view of the face processing system holds that face information is processed in multiple interconnected and locally specialized brain regions in a coordinated manner (Moeller et al., 2008; Fairhall & Ishai, 2007; Calder & Young, 2005; Adolphs, 2002; Haxby et al., 2000; Ishai, Ungerleider, Martin, Schouten, & Haxby, 1999) rather than within strictly segregated pathways. Neurons responding selectively to faces have been found in the monkey inferior temporal cortex and cortex around the STS (Gross & Sergent, 1992; Desimone et al., 1984; Rolls, 1984; Perrett et al., 1982). Patches of cortex specialized for face processing are found in the ventral and lateral temporal cortex in nonhuman primates and humans (Bell, Hadj-Bouziane, Frihauf, Tootell, & Ungerleider, 2009; Pinsk et al., 2005, 2009; Hadj-Bouziane, Bell, Knusten, Ungerleider, & Tootell, 2008; Tsao, Moeller, & Freiwald, 2008; Tsao, Freiwald, Tootell, & Livingstone, 2006; Tsao et al., 2003). Neural responses in the FFA have been reported being stronger to dynamic faces than to static faces (Schultz & Pilz, 2009; Sato et al., 2004; LaBar et al., 2003). Regions responding to static or dynamic faces are mutually interconnected and capable of modulating one another (Rajimehr, Young, & Tootell, 2009; Moeller et al., 2008). Such distributed representations of objects including faces can be established with surprisingly short latencies and have been used to successfully decode stimulus categories from intracranial EEG recordings (Liu, Agam, Madsen, & Kreiman, 2009; Tsuchiya et al., 2008). An architecture such as this might explain the findings of interactions between the processing of emotion and identity that have been reported earlier (Ganel, Valyear, Goshen-Gottstein, & Goodale, 2005; Ishai et al., 2004; Dolan, Morris, & de Gelder, 2001; Baudouin et al., 2000; Schweinberger & Soukup, 1998).
We found that static and dynamic faces elicited significant ERBP modulation within discrete but partially overlapping cortical sites around the fusiform gyrus. This region may thus serve a more general function in extracting information from faces based on low-level features, which precedes the extraction of higher level information such as emotional cues (Tsuchiya et al., 2008). Such a system might exist in parallel with alternate visual routes that direct coarse visual information to cortical areas involved in emotional and attentional modulation (Rudrauf et al., 2008; Vuilleumier, Armony, Driver, & Dolan, 2003; Winston, Vuilleumier, & Dolan, 2003; Morris, Ohman, & Dolan, 1999).
FFA Responses to Facial Expression
Modulation of FFA responses by facial expression has been suggested to reflect feedback, which serves to enhance the processing of emotionally salient information (Vuilleumier & Pourtois, 2007). Possible candidate origins of such feedback are the amygdala and the pFC. Our findings do not rule out such a mechanism, but they put a temporal limit on its latency. Previous intracranial ERP studies in the ventral temporal lobe using static stimuli identified the earliest differential responses to emotion with latencies exceeding 300 msec (Pourtois, Spinelli, Seeck, & Vuilleumier, 2010; Puce et al., 1999), supporting the notion of a delayed feedback signal. In the present case, we observed the emergence of emotion category discrimination in the ERBP by 120 msec. Although such an early response does not by itself rule out a role for rapid feedback (Kirchner, Barbeau, Thorpe, Régis, & Liégeois-Chauvel, 2009), it is also very much consistent with a feed-forward mechanism given that the category discrimination we observed emerges at the onset of the response and follows a time course similar to other, presumably feed-forward, object and face-selective responses in adjacent cortex (Agam et al., 2010; Liu et al., 2009; Serre et al., 2007; Thorpe, Fize, & Marlot, 1996; Perrett et al., 1982). Second, the observation that modulation by facial expression appeared in isolated contacts, rather than as a global phenomenon encompassing all face-responsive responses, implies that any effect of feedback modulation would have to be directed to specific cortical areas. This finding does not fit the picture of a more diffuse feedback-dependent modulation that has emerged from the functional imaging literature (Vuilleumier & Pourtois, 2007), although it remains possible that feedback modulation acts selectively on specific subregions of face-responsive cortex or that the modulation measured with BOLD-fMRI is distinct from the modulation measured with direct electrophysiological recordings, at least in the frequency range we analyzed in our study. A number of functional imaging studies have identified a selective enhancement of FFA to fearful faces (Ishai et al., 2004; Vuilleumier, Richardson, Armony, Driver, & Dolan, 2004; Vuilleumier, Armony, Driver, & Dolan, 2001), which has been argued to depend on feedback from the amygdala (Vuilleumier & Pourtois, 2007). In agreement with this pattern, we found a predominance of emotion-discriminating responses, which showed enhanced ERBP to the fearful morph over the happy morph. This predominance of the fear-responsive response emerged late in the dynamic phase of the stimulation and may thus reflect a contribution from such a feedback mechanism. As noted, however, only a part of face-responsive contacts showed emotional modulation, suggesting that any feedback modulation affected specific subregions of the responsive cortex. In addition, we also observed a higher ERBP response to happy morphs at a few locations. These responses occurred in the early dynamic period, making them seemingly inconsistent with feedback modulation.
Because of limitations in collecting data from neurosurgical patients, such as time, attention span, and fatigue, we used emotional expressions as the sole facial dynamic stimuli, thus making it impossible to separate face motion from face emotion. It thus remains possible that these issues regarding the origin of selectivity for fearful or happy dynamic expressions relate to distinctions between particular motion cues rather than to distinctions between emotions. It will be important in future studies to determine the responsiveness of these cortical regions to specific face movement components, such as changes in eye gaze or mouth movements, to understand exactly how the temporal cortex constructs representations of facial emotion.
Supplementary Material
Acknowledgments
We thank all patients for their participation in this study; John Brugge, Mitchell Steinschneider, Jeremy Greenlee, Paul Poon, Rick Reale, and Rick Jenison for advice and comments; Haiming Chen, Chandan Reddy, Fangxiang Chen, Nader Dahdaleh, and Adam Jackson for data collection and care of participants; and Yota Kimura and Joe Hitchon for help with visual stimuli.
References
- Adolphs R. Recognizing emotion from facial expressions: Psychological and neurological mechanisms. Behavioral and Cognitive Neuroscience Reviews. 2002;1:21–62. doi: 10.1177/1534582302001001003. [DOI] [PubMed] [Google Scholar]
- Agam Y, Liu H, Papanastassiou A, Buia C, Golby AJ, Madsen JR, et al. Robust selectivity to two-object images in human visual cortex. Current Biology. 2010;20:872–879. doi: 10.1016/j.cub.2010.03.050. [DOI] [PMC free article] [PubMed] [Google Scholar]
- Allison T, Ginter H, McCarthy G, Nobre AC, Puce A, Luby M, et al. Face recognition in human extrastriate cortex. Journal of Neurophysiology. 1994;71:821–825. doi: 10.1152/jn.1994.71.2.821. [DOI] [PubMed] [Google Scholar]
- Allison T, McCarthy G, Nobre A, Puce A, Belger A. Human extrastriate visual cortex and the perception of faces, words, numbers, and colors. Cerebral Cortex. 1994;4:544–554. doi: 10.1093/cercor/4.5.544. [DOI] [PubMed] [Google Scholar]
- Allison T, Puce A, Spencer DD, McCarthy G. Electrophysiological studies of human face perception: I. Potentials generated in occipitotemporal cortex by face and non-face stimuli. Cerebral Cortex. 1999;9:415–430. doi: 10.1093/cercor/9.5.415. [DOI] [PubMed] [Google Scholar]
- Baudouin JY, Gilibert D, Sansone S, Tiberghien G. When the smile is a cue to familiarity. Memory. 2000;8:285–292. doi: 10.1080/09658210050117717. [DOI] [PubMed] [Google Scholar]
- Bell AH, Hadj-Bouziane F, Frihauf JB, Tootell RB, Ungerleider LG. Object representations in the temporal cortex of monkeys and humans as revealed by functional magnetic resonance imaging. Journal of Neurophysiology. 2009;101:688–700. doi: 10.1152/jn.90657.2008. [DOI] [PMC free article] [PubMed] [Google Scholar]
- Benjamini Y, Hochberg Y. Controlling the false discovery rate—A practical and powerful approach to multiple testing. Journal of the Royal Statistical Society, Series B: Methodological. 1995;57:289–300. [Google Scholar]
- Brainard DH. The psychophysics toolbox. Spatial Vision. 1997;10:433–436. [PubMed] [Google Scholar]
- Bruce V, Young A. Understanding face recognition. British Journal of Psychology. 1986;77:305–327. doi: 10.1111/j.2044-8295.1986.tb02199.x. [DOI] [PubMed] [Google Scholar]
- Calder AJ, Young AW. Understanding the recognition of facial identity and facial expression. Nature Reviews Neuroscience. 2005;6:641–651. doi: 10.1038/nrn1724. [DOI] [PubMed] [Google Scholar]
- Crone NE, Boatman D, Gordon B, Hao L. Induced electrocorticographic gamma activity during auditory perception. Brazier award-winning article, 2001. Clinical Neurophysiology. 2001;112:565–582. doi: 10.1016/s1388-2457(00)00545-9. [DOI] [PubMed] [Google Scholar]
- Crone NE, Hao L, Hart J, Boatman D, Lesser RP, Irizarry R, et al. Electrocorticographic gamma activity during word production in spoken and sign language. Neurology. 2001;57:2045–2053. doi: 10.1212/wnl.57.11.2045. [DOI] [PubMed] [Google Scholar]
- Crone NE, Miglioretti DL, Gordon B, Lesser RP. Functional mapping of human sensorimotor cortex with electrocorticographic spectral analysis: II. Event-related synchronization in the gamma band. Brain. 1998;121:2301–2315. doi: 10.1093/brain/121.12.2301. [DOI] [PubMed] [Google Scholar]
- Desimone R, Albright TD, Gross CG, Bruce C. Stimulus-selective properties of inferior temporal neurons in the macaque. Journal of Neuroscience. 1984;4:2051–2062. doi: 10.1523/JNEUROSCI.04-08-02051.1984. [DOI] [PMC free article] [PubMed] [Google Scholar]
- Dolan RJ, Morris JS, de Gelder B. Crossmodal binding of fear in voice and face. Proceedings of the National Academy of Sciences, USA. 2001;98:10006–10010. doi: 10.1073/pnas.171288598. [DOI] [PMC free article] [PubMed] [Google Scholar]
- Edwards E, Nagarajan SS, Dalal SS, Canolty RT, Kirsch HE, Barbaro NM, et al. Spatiotemporal imaging of cortical activation during verb generation and picture naming. Neuroimage. 2010;50:291–301. doi: 10.1016/j.neuroimage.2009.12.035. [DOI] [PMC free article] [PubMed] [Google Scholar]
- Ekman P, Friesen WV. Pictures of facial affect. Palo Alto, CA: Consulting Psychologist Press; 1976. [Google Scholar]
- Fairhall SL, Ishai A. Effective connectivity within the distributed cortical network for face perception. Cerebral Cortex. 2007;17:2400–2406. doi: 10.1093/cercor/bhl148. [DOI] [PubMed] [Google Scholar]
- Freiwald WA, Tsao DY, Livingstone MS. A face feature space in the macaque temporal lobe. Nature Neuroscience. 2009;12:1187–1196. doi: 10.1038/nn.2363. [DOI] [PMC free article] [PubMed] [Google Scholar]
- Ganel T, Valyear KF, Goshen-Gottstein Y, Goodale MA. The involvement of the “fusiform face area” in processing facial expression. Neuropsychologia. 2005;43:1645–1654. doi: 10.1016/j.neuropsychologia.2005.01.012. [DOI] [PubMed] [Google Scholar]
- Gross CG, Sergent J. Face recognition. Current Opinion in Neurobiology. 1992;2:156–161. doi: 10.1016/0959-4388(92)90004-5. [DOI] [PubMed] [Google Scholar]
- Hadj-Bouziane F, Bell AH, Knusten TA, Ungerleider LG, Tootell RB. Perception of emotional expressions is independent of face selectivity in monkey inferior temporal cortex. Proceedings of the National Academy of Sciences, USA. 2008;105:5591–5596. doi: 10.1073/pnas.0800489105. [DOI] [PMC free article] [PubMed] [Google Scholar]
- Haxby JV, Hoffman EA, Gobbini MI. The distributed human neural system for face perception. Trends in Cognitive Sciences. 2000;4:223–233. doi: 10.1016/s1364-6613(00)01482-0. [DOI] [PubMed] [Google Scholar]
- Hoffman EA, Haxby JV. Distinct representations of eye gaze and identity in the distributed human neural system for face perception. Nature Neuroscience. 2000;3:80–84. doi: 10.1038/71152. [DOI] [PubMed] [Google Scholar]
- Ishai A, Pessoa L, Bikle PC, Ungerleider LG. Repetition suppression of faces is modulated by emotion. Proceedings of the National Academy of Sciences, USA. 2004;101:9827–9832. doi: 10.1073/pnas.0403559101. [DOI] [PMC free article] [PubMed] [Google Scholar]
- Ishai A, Ungerleider LG, Martin A, Schouten JL, Haxby JV. Distributed representation of objects in the human ventral visual pathway. Proceedings of the National Academy of Sciences, USA. 1999;96:9379–9384. doi: 10.1073/pnas.96.16.9379. [DOI] [PMC free article] [PubMed] [Google Scholar]
- Kanwisher N, McDermott J, Chun MM. The fusiform face area: A module in human extrastriate cortex specialized for face perception. Journal of Neuroscience. 1997;17:4302–4311. doi: 10.1523/JNEUROSCI.17-11-04302.1997. [DOI] [PMC free article] [PubMed] [Google Scholar]
- Kirchner H, Barbeau EJ, Thorpe SJ, Régis J, Liégeois-Chauvel C. Ultra-rapid sensory responses in the human frontal eye field region. Journal of Neuroscience. 2009;29:7599–7606. doi: 10.1523/JNEUROSCI.1233-09.2009. [DOI] [PMC free article] [PubMed] [Google Scholar]
- LaBar KS, Crupain MJ, Voyvodic JT, McCarthy G. Dynamic perception of facial affect and identity in the human brain. Cerebral Cortex. 2003;13:1023–1033. doi: 10.1093/cercor/13.10.1023. [DOI] [PubMed] [Google Scholar]
- Lachaux JP, George N, Tallon-Baudry C, Martinerie J, Hugueville L, Minotti L, et al. The many faces of the gamma band response to complex visual stimuli. Neuroimage. 2005;25:491–501. doi: 10.1016/j.neuroimage.2004.11.052. [DOI] [PubMed] [Google Scholar]
- Liu H, Agam Y, Madsen JR, Kreiman G. Timing, timing, timing: Fast decoding of object information from intracranial field potentials in human visual cortex. Neuron. 2009;62:281–290. doi: 10.1016/j.neuron.2009.02.025. [DOI] [PMC free article] [PubMed] [Google Scholar]
- McCarthy G, Puce A, Belger A, Allison T. Electrophysiological studies of human face perception: II. Response properties of face-specific potentials generated in occipitotemporal cortex. Cerebral Cortex. 1999;9:431–444. doi: 10.1093/cercor/9.5.431. [DOI] [PubMed] [Google Scholar]
- McCarthy G, Puce A, Gore JC, Allison T. Face-specific processing in the human fusiform gyrus. Journal of Cognitive Neuroscience. 1997;9:605–610. doi: 10.1162/jocn.1997.9.5.605. [DOI] [PubMed] [Google Scholar]
- Moeller S, Freiwald WA, Tsao DY. Patches with links: A unified system for processing faces in the macaque temporal lobe. Science. 2008;320:1355–1359. doi: 10.1126/science.1157436. [DOI] [PMC free article] [PubMed] [Google Scholar]
- Morris JS, Ohman A, Dolan RJ. A subcortical pathway to the right amygdala mediating “unseen” fear. Proceedings of the National Academy of Sciences, USA. 1999;96:1680–1685. doi: 10.1073/pnas.96.4.1680. [DOI] [PMC free article] [PubMed] [Google Scholar]
- Nourski KV, Reale RA, Oya H, Kawasaki H, Kovach CK, Chen H, et al. Temporal envelope of time-compressed speech represented in the human auditory cortex. Journal of Neuroscience. 2009;29:15564–15574. doi: 10.1523/JNEUROSCI.3065-09.2009. [DOI] [PMC free article] [PubMed] [Google Scholar]
- Pelli DG. The videotoolbox software for visual psychophysics: Transforming numbers into movies. Spatial Vision. 1997;10:437–442. [PubMed] [Google Scholar]
- Perrett DI, Rolls ET, Caan W. Visual neurones responsive to faces in the monkey temporal cortex. Experimental Brain Research. 1982;47:329–342. doi: 10.1007/BF00239352. [DOI] [PubMed] [Google Scholar]
- Perrett DI, Smith PA, Potter DD, Mistlin AJ, Head AS, Milner AD, et al. Visual cells in the temporal cortex sensitive to face view and gaze direction. Proceedings of the Royal Society of London, B: Biological Sciences. 1985;223:293–317. doi: 10.1098/rspb.1985.0003. [DOI] [PubMed] [Google Scholar]
- Pfurtscheller G, Graimann B, Huggins JE, Levine SP, Schuh LA. Spatiotemporal patterns of beta desynchronization and gamma synchronization in corticographic data during self-paced movement. Clinical Neurophysiology. 2003;114:1226–1236. doi: 10.1016/s1388-2457(03)00067-1. [DOI] [PubMed] [Google Scholar]
- Pinsk MA, Arcaro M, Weiner KS, Kalkus JF, Inati SJ, Gross CG, et al. Neural representations of faces and body parts in macaque and human cortex: A comparative fMRI study. Journal of Neurophysiology. 2009;101:2581–2600. doi: 10.1152/jn.91198.2008. [DOI] [PMC free article] [PubMed] [Google Scholar]
- Pinsk MA, DeSimone K, Moore T, Gross CG, Kastner S. Representations of faces and body parts in macaque temporal cortex: A functional MRI study. Proceedings of the National Academy of Sciences, USA. 2005;102:6996–7001. doi: 10.1073/pnas.0502605102. [DOI] [PMC free article] [PubMed] [Google Scholar]
- Pourtois G, Spinelli L, Seeck M, Vuilleumier P. Modulation of face processing by emotional expression and gaze direction during intracranial recordings in right fusiform cortex. Journal of Cognitive Neuroscience. 2010;22:2086–2107. doi: 10.1162/jocn.2009.21404. [DOI] [PubMed] [Google Scholar]
- Puce A, Allison T, Asgari M, Gore JC, McCarthy G. Differential sensitivity of human visual cortex to faces, letterstrings, and textures: A functional magnetic resonance imaging study. Journal of Neuroscience. 1996;16:5205–5215. doi: 10.1523/JNEUROSCI.16-16-05205.1996. [DOI] [PMC free article] [PubMed] [Google Scholar]
- Puce A, Allison T, McCarthy G. Electrophysiological studies of human face perception: III. Effects of top–down processing on face-specific potentials. Cerebral Cortex. 1999;9:445–458. doi: 10.1093/cercor/9.5.445. [DOI] [PubMed] [Google Scholar]
- Rajimehr R, Young JC, Tootell RB. An anterior temporal face patch in human cortex, predicted by macaque maps. Proceedings of the National Academy of Sciences, USA. 2009;106:1995–2000. doi: 10.1073/pnas.0807304106. [DOI] [PMC free article] [PubMed] [Google Scholar]
- Ray S, Crone NE, Niebur E, Franaszczuk PJ, Hsiao SS. Neural correlates of high-gamma oscillations (60–200 Hz) in macaque local field potentials and their potential implications in electrocorticography. Journal of Neuroscience. 2008;28:11526–11536. doi: 10.1523/JNEUROSCI.2848-08.2008. [DOI] [PMC free article] [PubMed] [Google Scholar]
- Rolls ET. Neurons in the cortex of the temporal lobe and in the amygdala of the monkey with responses selective for faces. Human Neurobiology. 1984;3:209–222. [PubMed] [Google Scholar]
- Rudrauf D, David O, Lachaux JP, Kovach CK, Martinerie J, Renault B, et al. Rapid interactions between the ventral visual stream and emotion-related structures rely on a two-pathway architecture. Journal of Neuroscience. 2008;28:2793–2803. doi: 10.1523/JNEUROSCI.3476-07.2008. [DOI] [PMC free article] [PubMed] [Google Scholar]
- Sato W, Kochiyama T, Yoshikawa S, Naito E, Matsumura M. Enhanced neural activity in response to dynamic facial expressions of emotion: An fMRI study. Brain Research, Cognitive Brain Research. 2004;20:81–91. doi: 10.1016/j.cogbrainres.2004.01.008. [DOI] [PubMed] [Google Scholar]
- Schultz J, Pilz K. Natural facial motion enhances cortical responses to faces. Experimental Brain Research. 2009;194:465–475. doi: 10.1007/s00221-009-1721-9. [DOI] [PMC free article] [PubMed] [Google Scholar]
- Schweinberger SR, Soukup GR. Asymmetric relationships among perceptions of facial identity, emotion, and facial speech. Journal of Experimental Psychology: Human Perception and Performance. 1998;24:1748–1765. doi: 10.1037//0096-1523.24.6.1748. [DOI] [PubMed] [Google Scholar]
- Serre T, Kreiman G, Kouh M, Cadieu C, Knoblich U, Poggio T. A quantitative theory of immediate visual recognition. Progress in Brain Research. 2007;165:33–56. doi: 10.1016/S0079-6123(06)65004-8. [DOI] [PubMed] [Google Scholar]
- Spiridon M, Fischl B, Kanwisher N. Location and spatial profile of category-specific regions in human extrastriate cortex. Human Brain Mapping. 2006;27:77–89. doi: 10.1002/hbm.20169. [DOI] [PMC free article] [PubMed] [Google Scholar]
- Steinschneider M, Fishman YI, Arezzo JC. Spectrotemporal analysis of evoked and induced electroencephalographic responses in primary auditory cortex (A1) of the awake monkey. Cerebral Cortex. 2008;18:610–625. doi: 10.1093/cercor/bhm094. [DOI] [PubMed] [Google Scholar]
- Tallon-Baudry C, Bertrand O. Oscillatory gamma activity in humans and its role in object representation. Trends in Cognitive Sciences. 1999;3:151–162. doi: 10.1016/s1364-6613(99)01299-1. [DOI] [PubMed] [Google Scholar]
- Tanji K, Suzuki K, Delorme A, Shamoto H, Nakasato N. High-Frequency gamma-band activity in the basal temporal cortex during picture-naming and lexical-decision tasks. Journal of Neuroscience. 2005;25:3287–3293. doi: 10.1523/JNEUROSCI.4948-04.2005. [DOI] [PMC free article] [PubMed] [Google Scholar]
- Thorpe S, Fize D, Marlot C. Speed of processing in the human visual system. Nature. 1996;381:520–522. doi: 10.1038/381520a0. [DOI] [PubMed] [Google Scholar]
- Tsao DY, Freiwald WA, Knutsen TA, Mandeville JB, Tootell RB. Faces and objects in macaque cerebral cortex. Nature Neuroscience. 2003;6:989–995. doi: 10.1038/nn1111. [DOI] [PMC free article] [PubMed] [Google Scholar]
- Tsao DY, Freiwald WA, Tootell RB, Livingstone MS. A cortical region consisting entirely of face-selective cells. Science. 2006;311:670–674. doi: 10.1126/science.1119983. [DOI] [PMC free article] [PubMed] [Google Scholar]
- Tsao DY, Moeller S, Freiwald WA. Comparing face patch systems in macaques and humans. Proceedings of the National Academy of Sciences, USA. 2008;105:19514–19519. doi: 10.1073/pnas.0809662105. [DOI] [PMC free article] [PubMed] [Google Scholar]
- Tsuchiya N, Kawasaki H, Oya H, Howard MA, Adolphs R. Decoding face information in time, frequency and space from direct intracranial recordings of the human brain. Plos One. 2008;3:e3892. doi: 10.1371/journal.pone.0003892. [DOI] [PMC free article] [PubMed] [Google Scholar]
- Vidal JR, Chaumon M, O’Regan JK, Tallon-Baudry C. Visual grouping and the focusing of attention induce gamma-band oscillations at different frequencies in human magnetoencephalogram signals. Journal of Cognitive Neuroscience. 2006;18:1850–1862. doi: 10.1162/jocn.2006.18.11.1850. [DOI] [PubMed] [Google Scholar]
- Vuilleumier P, Armony JL, Driver J, Dolan RJ. Effects of attention and emotion on face processing in the human brain: An event-related fMRI study. Neuron. 2001;30:829–841. doi: 10.1016/s0896-6273(01)00328-2. [DOI] [PubMed] [Google Scholar]
- Vuilleumier P, Armony JL, Driver J, Dolan RJ. Distinct spatial frequency sensitivities for processing faces and emotional expressions. Nature Neuroscience. 2003;6:624–631. doi: 10.1038/nn1057. [DOI] [PubMed] [Google Scholar]
- Vuilleumier P, Pourtois G. Distributed and interactive brain mechanisms during emotion face perception: Evidence from functional neuroimaging. Neuropsychologia. 2007;45:174–194. doi: 10.1016/j.neuropsychologia.2006.06.003. [DOI] [PubMed] [Google Scholar]
- Vuilleumier P, Richardson MP, Armony JL, Driver J, Dolan RJ. Distant influences of amygdala lesion on visual cortical activation during emotional face processing. Nature Neuroscience. 2004;7:1271–1278. doi: 10.1038/nn1341. [DOI] [PubMed] [Google Scholar]
- Whittingstall K, Logothetis NK. Frequency-band coupling in surface EEG reflects spiking activity in monkey visual cortex. Neuron. 2009;64:281–289. doi: 10.1016/j.neuron.2009.08.016. [DOI] [PubMed] [Google Scholar]
- Winston JS, Vuilleumier P, Dolan RJ. Effects of low-spatial frequency components of fearful faces on fusiform cortex activity. Current Biology. 2003;13:1824–1829. doi: 10.1016/j.cub.2003.09.038. [DOI] [PubMed] [Google Scholar]
Associated Data
This section collects any data citations, data availability statements, or supplementary materials included in this article.