

Abstract
A complex interaction between the immune response and host behavior has been described in a wide range of species. Excess sleep, in particular, is known to occur as a response to infection in mammals 1 and has also recently been described in Drosophila melanogaster2. It is generally accepted that sleep is beneficial to the host during an infection and that it is important for the maintenance of a robust immune system3,4. However, experimental evidence that supports this hypothesis is limited4, and the function of excess sleep during an immune response remains unclear. We have used a multidisciplinary approach to address this complex problem, and have conducted studies in the simple genetic model system, the fruitfly Drosophila melanogaster. We use a standard assay for measuring locomotor behavior and sleep in flies, and demonstrate how this assay is used to measure behavior in flies infected with a pathogenic strain of bacteria. This assay is also useful for monitoring the duration of survival in individual flies during an infection. Additional measures of immune function include the ability of flies to clear an infection and the activation of NFκB, a key transcription factor that is central to the innate immune response in Drosophila. Both survival outcome and bacterial clearance during infection together are indicators of resistance and tolerance to infection. Resistance refers to the ability of flies to clear an infection, while tolerance is defined as the ability of the host to limit damage from an infection and thereby survive despite high levels of pathogen within the system5. Real-time monitoring of NFκB activity during infection provides insight into a molecular mechanism of survival during infection. The use of Drosophila in these straightforward assays facilitates the genetic and molecular analyses of sleep and the immune response and how these two complex systems are reciprocally influenced.
Keywords: Immunology, Issue 70, Neuroscience, Medicine, Physiology, Pathology, Microbiology, immune response, sleep, Drosophila, infection, bacteria, luciferase reporter assay, animal model
Protocol
This protocol uses two setups (Figure 1) to acquire four different readouts collected from flies subjected to a bacterial infection. These outputs include 1) sleep/wake behavior; 2) survival outcome; 3) bacterial load in the fly; and 4) real-time measurement of NFκB reporter activity in vivo. In combination with the genetic tools that are available in Drosophila, these measurements provide mechanistic insight into the molecular link between immune function and behavior.
1. Measure Locomotor Activity and Sleep in Flies
- The setup used to measure locomotor activity and sleep in flies, which includes the Drosophila activity monitoring system (DAM2, Trikinetics), incubators, dark room, and the preparation of experimental animals and activity tubes, has been described previously6. The same approach is used here, with some minor modifications.
- The lighting of the incubator is controlled by the incubator itself. Therefore, it is important to synchronize the time setting among computer and incubators.
- Activity tubes are cleaned for re-use by boiling on a hot plate in de-ionized water. A small amount of detergent is added for the first boil, tubes are well-rinsed and boiled twice more. If yarn is used to plug the tube, used activity tubes (containing food, wax, fly and yarn) can be cleaned without prior removal of the yarn.
Prior to initiating an experiment, place cultures containing late pupal staged flies in incubators for three to four days to adapt to experimental lighting and other environmental conditions. Light:dark or constant conditions have been commonly used to measure sleep behavior. In this example, flies are acclimated to constant light to eliminate the influence of the circadian clock on the immune response and behavior2,7,8 . As described in Figure 1A, load 1-4 day old flies into the Trikinetics DAM2 activity monitors as described6, and record for a minimum of three days prior to the infection.
2. Infect Flies with a Pathogenic Strain of Bacteria
The protocol described here is specific for S. marcescens, which are easy to grow and maintain. Protocols for long-term storage and culture conditions for other bacterial species will vary. S. marcescens are stored in 15-50 % glycerol at -80 °C. To prepare for long-term storage, mix 2 volumes of overnight bacterial culture (O.D. 600 = 0.5 - 1.0) to 1 volume of autoclaved 50% glycerol in 1.5 ml microcentrifuge tubes. This will result in a final glycerol concentration of 17%. Store tubes at -80 °C. To prepare a short-term in-use source of bacteria, scrape the frozen stock with a sterile 200 μl pipette tip and perform a three-way streak on an LB agar plate. Incubate the plate overnight at 37 °C to get isolated colonies. Store the plate at 4 °C. One day before the scheduled infection, pick a single colony from the LB agar plate with a sterile 200 μl pipette tip and submerge the tip into a culture tube containing 5 ml LB medium. Grow bacteria overnight, or up to 16 hr inside an incubator shaker at 37 °C and 250 rpm until it reaches the exponential growth phase. Measure the concentration with a spectrophotometer at OD600. The concentration in this phase ranges from 0.5 to 1. If the concentration is too high, subculture the bacteria and grow for another several hours to get an optimal concentration. Perform the procedure near a flame source. Some bacterial strains are engineered for antibiotic resistance and are grown and selected for appropriate antibiotic added to the medium. S. marcescens (ATCC #8100) are not antibiotic resistant and are therefore grown in sterile medium without antibiotic. To verify sterile technique, do a mock culture without bacteria as a control. The solution to infect flies contains bacteria (diluted to OD600=0.1) and 1% food coloring (Brilliant Blue FCF) in PBS. Prepare a solution for injection control by adding equivalent amount of LB medium used in infection solution and 1% blue food coloring in PBS. Store solutions on ice.
Prepare glass needles for injecting the flies. Pull glass capillaries (o.d. = 1 mm, i.d. = 0.58 mm, WPI) to a fine tip using a micropipette puller (Narishige). Under a dissecting microscope, use fine forceps to break off the tip of the needle so that the opening is large enough to fill with injection fluid by applying suction with a syringe, but small enough to minimize damage to the fly during the injection process. After breaking the tip, the tip size should be around 40-50 μm. The glass needle is attached to a 3 cc plastic syringe with a length of tubing. The flow of injection medium is controlled manually applying positive pressure or suction with the syringe. Avoid contaminating the rubber tubing with injection fluid, as the syringe apparatus is used for both infection and control injections.
Anesthetize flies by putting them on a CO2 pad. CO2 is passed through a sealed container of water to humidify the pad and to reduce static electricity, which can complicate manipulation of flies on the pad. Inject flies by poking the glass needle into the region above the scutellum of the dorsal thorax. The passing of injection medium into the fly is verified by the food coloring - flies turn blue as the food coloring spreads through the system. The dose of bacteria that flies receive can be quantified as described in Section 3, below. Some experimental designs include a control group that receives aseptic injury by injecting flies with PBS and food coloring but without bacteria.
3. Determine the Bacterial Load
One approach to evaluating the immune response against bacterial infection is to determine the bacterial load post infection. D. melanogaster is a great model to determine this parameter because the whole fly can be homogenized to estimate the total bacterial numbers within an individual. The rationale behind this protocol is that when grown on a solid medium such as Luria broth (LB) agar on a Petri dish (LB plate), a single bacterium forms a visible distinguishable colony. Therefore, by homogenizing infected flies in LB liquid medium, generating serial dilutions of the homogenate, and spreading the diluted homogenate onto LB plates, the number of bacterial cells infecting a fly can be determined. A control group of flies injected with PBS and food coloring but without bacteria should be used to verify that the infection was not contaminated with other bacterial species. There should be no colonies on the LB agar plate in this condition.
Autoclave all materials that will be used for this procedure before performing the actual homogenization step. This includes 200 μl pipette tips cut with scissors, LB media, and pestles used for the homogenization. Prepare plates by pouring autoclaved LB/agar medium into 10 cm sterile Petri dishes at least 1 day before homogenizing flies.
Anesthetize and collect flies in 1.5 ml microcentrifuge tubes and store tubes on ice.
- Perform the homogenization near a flame to prevent contamination. A control homogenization containing flies without infection is recommended especially when using a bacterial strain such as S. marcescens, which are not antibiotic resistant. Homogenize a minimum of 2 groups of 10 flies each per experimental condition. The number of flies used per homogenate is determined by the experimenter. Some groups have used one fly per homogenate, which is useful for evaluating variation in bacterial load between individual flies8, while others have used from 3-10 flies per homogenate to compare across genotype or experimental condition9-12.
- Add 400 μl LB medium to each microcentrifuge tube containing flies and homogenize using a small motor and pestle (Kontes).
- Using sterilized cut pipette tips, serial dilute the homogenate 1:10 by adding 20 μl homogenized LB/bacterial medium to 1.5 μl microcentrifuge tube containing 180 μl LB medium. Cutting pipette tips prevents blockage from fly debris and ensures that an appropriate volume is being transferred.
- Dilution factor is determined empirically and depends on the genotype of the fly, the bacterial strain used, and experimental condition. For wild type flies infected with S. marcescens, use dilutions of 1:102 or 1:103 for flies homogenized immediately post-infection, and dilutions of 1:104 or 1:105 for flies homogenized 24 hr post-infection.
- Add 100 μl LB/bacterial medium from the microcentrifuge tubes containing the final dilution and spread the medium on an LB plate using glass balls (VWR) to ensure an even distribution.
- Discard the glass balls into 100% EtOH solution. Place the LB plates in a 37 °C incubator overnight.
- As an optional step, use an imaging system with visual light to obtain an image of the LB plates (FluorChem 8900; Alpha Innotech). Count the numbers of colonies either on the plate itself or from the image of the plate using the counting tool on Photoshop software (Adobe Photoshop CS3).
- Calculate the number of colony-forming units per fly using the formula: [n /(N *D *v)]*V; where n= number of colonies grown on the LB plate; N=the number of the flies pooled in one microcentrifuge tube; D= dilution factor; and v = volume of solution spread onto each plate; V = initial volume of the homogenate.
4. Evaluate Sleep and Survival Duration After Infection
For flies that are not harvested for measuring bacterial load, continue monitoring behavior for another 7-10 days. Survival duration is influenced by genotype of the fly, environmental conditions, and bacterial species used for infection.
After ~10 days, terminate the experiment, download and process behavioral data as previously described6. Insomniac2 custom software, which is based in Matlab, is used to analyze sleep parameters. It is important to eliminate dead flies from the behavioral analysis. Normally, this restricts analyses to within the first day after infection, depending on the type of infection and fly genotype. Death in the assay is indicated by the time all activity counts have reached zero. To facilitate analysis of survival, Drosonex, custom software written in Microsoft Visual C++ 6.0, is used to process raw data files from the Trikinetics DAM system. The software reports as Excel files, survival duration of each fly (in hours), compiles activity data from all monitors into a single spreadsheet, and reports the percent flies surviving over time as set by the user. The Excel files are designed to integrate into other statistical software packages for further analysis.
5. Measure NFκB Activity During Infection Using a Luciferase Reporter Assay
Transgenic κB-luc flies used in this assay were generated previously as described in Kuo et al., 20102. Briefly, the κB-luc reporter contains 8 repeats of an NFκB binding sequence that were inserted into a promoter upstream of a luciferase open reading frame.
Adjust flies to experimental lighting conditions as described in section 1.2. In this example, 1-4 day old κB-luc flies are housed in vials containing a 5% sucrose, 2% agar food medium and placed in constant light (LL) for 2 days to reach the same age as other flies during infection.
Prepare a 96-well microplate for flies. Each well contains 2 layers of food medium (Figure 2); the top layer contains luciferin, the substrate of luciferase. Add 300 μl of a 5% sucrose, 2% agar solution to each well and allow to solidify. Next, add a 50 μl top layer to each well containing 5% sucrose, 1% agar, and 2 mM luciferin (Gold BioTechnology, Inc.). Luciferin concentrations used for measuring reporter activity in Drosophila have varied in the literature, and have been as low as 100 μM13. The concentration required can be determined empirically. Between dispensing the food layers, cover the plate with a fine mesh cloth to facilitate drying while maintaining sterility. The plate should be allowed to dry thoroughly, up to one hour, in order to prevent flies from getting stuck in condensation droplets. Because luciferin is light-sensitive, avoid exposing plates to light more than necessary.
Apply a clear adhesive film (Top-Seal-A; Perkin Elmer) to a 96-well microwell plate and perforate using a fine needle at a quantity of 2 holes per well. These holes will not only allow air exchange to each well, but will also provide a way to anesthetize flies on an individual basis. Using a sharp blade and straight edge, introduce a cut between each column. This will provide an easy way to load/unload flies in groups of 8 at a time. To load flies into the microwell plate, remove the vials from the incubator and anesthetize flies on a CO2 pad. Load flies one-by-one to each well column-by-column. Should a fly inadvertently get stuck to the adhesive seal, leave the fly alone as they are often able to free themselves without intervention. Return the microwell plate to the incubator in LL for 8-24 hr to adjust to the new environment and to consume the luciferin substrate.
Culture bacteria, S. marcescens, and prepare a solution for infection as described above.
Anaesthetize the flies by using a micropipette tip attached to a low-pressure CO2 line. Place the micropipette tip directly above the ventilation holes made for each well. Take caution to ensure that the CO2 pressure is high enough to anaesthetize the fly, but low enough to avoid injury to the fly. In groups of eight, individually transfer each fly to a CO2 pad, and infect as described above. After infection, return each fly to its original well and reseal the microplate.
Measure luminescence (TopCount-NXT Luminescence and Scintillation Counter; Perkin-Elmer). The TopCount luminescence counter contains a stacking cassette for plates, which allows for programmed and automated readings continuously at desired increments for any length of time (usually up to five days). This feature is not available on all instruments, and data collection for experiments performed with other instruments may therefore be less frequent. The luminescence counter is housed in a room with a controlled temperature and lighting schedule. When loading plates into the stacking cassette, stack the plates containing the flies between clear blank plates to ensure that flies receive light. Program the luminometer according to manufacturer's specifications to collect readings every hour for a minimum of 24 hr. In this example, the detectors are programmed to read each well for 10 sec and to express the result as counts (arbitrary units) per second. This value is averaged across 3 readings per well. Export the data files to a spreadsheet and perform a standard analysis, graphing the results of luminescence.
Representative Results
Infection promotes sleep. In this example, Canton-S (CS) wild type flies and mutant flies lacking an NFκB gene, Relish (RelE20) 14, were loaded into two DAM2 activity monitors (n=32 for each genotype) and infected as described above. Flies were maintained in constant light to eliminate the influence of the circadian clock on behavior and infection2,7,8. The RelE20 mutants were isogenized to CS as described previously11. Both sets of flies were infected with S. marcescens and the results are depicted in Figure 3. In some cases, an additional handled control group is useful for differentiating effects of handling from effects of infection2. Handled control groups are exposed to the same environmental changes as the infected groups, which includes removal from incubators and anesthetization for the same duration of time but they do not receive an injection. However, in this example, it is clear that RelE20 mutants experience less sleep than CS control flies after infection (Figure 3A). As described previously6, there are other behavioral parameters that can be measured from the DAMS assay. These may include total activity counts per unit time (Figure 3B). In this example, the change in activity after infection mirrors that of sleep. We also report activity rate, or activity counts per waking minute (Figure 3C). This parameter is one indicator of locomotor ability in flies. In this case, waking activity rates do not change in either genotype during infection, which suggests that reduction in activity or increase in sleep is not a result of reduced locomotor ability.
Figure 4A depicts the rate of survival after infection. Consistent with previous findings14,15, RelE20 mutants rapidly succumb to the infection as compared to wild type flies. Most flies survived the aseptic control injection (Figure 4B), indicating that flies succumbed to the infection and not to the injury due to the injection. Because the Relish mutants died so quickly, only CS flies were used to demonstrate bacterial load after infection (Figure 5). Figure 5 shows that S. marcescens continues to proliferate in the fly 24 hr after infection.
Luciferase reporter activity is depicted across time in the assay in four individual flies (Figure 6). Large variation between data points and individual flies can be attributed to the flies moving around inside the wells. Although the signal is derived from all tissues within the fly, it is not expected that every tissue would emit the same amount of signal, and the visibility of the tissue to the detector would vary as the fly moves. In this example, flies were infected and compared with a handled control group. Flies that died were excluded from the analysis across a group of flies shown in Figure 7A. Dead flies are determined by visual inspection. In these flies, there is a sharp drop in the luciferase signal, as well as a decrease in signal variation, indicating that the fly is not moving. κB-luc reporter activity steadily rises after infection (Figure 7A) and aseptic injury (Figure 7B). The reporter activity peaks around 12 hr post-injury and post-infection. Both genetic and/or behavioral manipulations of flies are expected to modify κB-luc reporter activity during infection. For example, we previously described2 that the induction of κB-luc reporter activity was largely attenuated during infection in RelE20 mutants, indicating this κB-luc reporter is specific to NFκB.
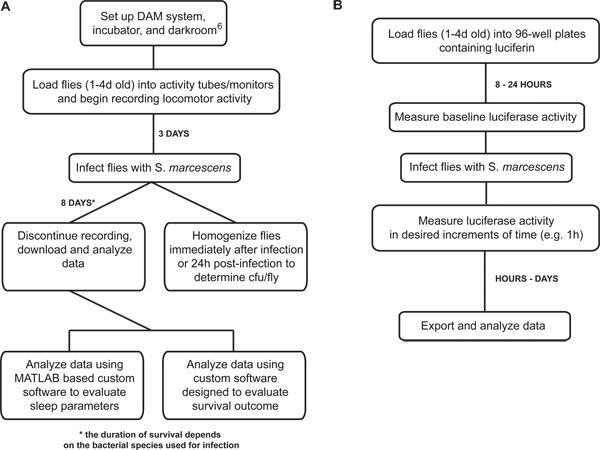 Figure 1. Flowchart that outlines the major steps of measuring the immune responses in Drosophila. (A) The sequence of steps is outlined for measuring sleep, survival, and bacterial load during an infection; (B) The sequence of steps is outlined for measuring NFκB-dependent luciferase reporter activity during infection. Experiments can continue anywhere from 1-5 days, depending on the lethality of bacterial species used.
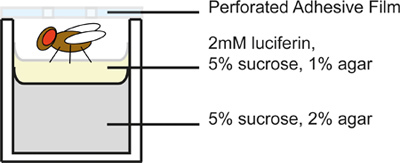 Figure 2. Schematic of an individual microplate well. Flies are placed in opaque, 96 well plates containing medium and covered as shown. Because flies will be individually handled to be infected, it is important to restrict the number of flies per plate to an amount that can be reasonably managed within a given period of time, depending on the experimental circumstances.
 Figure 3. Behavior response of flies infected with S. marcescens. (A)Mean ± SEM percent time that flies spent sleeping and (B) Mean ± SEM total activity counts are plotted in 4 hr increments for 1 day before and after infection with S. marcescens. (C) Mean ± SEM activity counts per waking minute before (BL = baseline) and after infection with S. marcescens is plotted in 8 hr increments. Behavior is reported for wild-type CS flies that survived for at least 24 hr post infection, and for immune-deficient RelE20 flies that survived for at least 8 hr post infection. n=13 for CS and for RelE20. ** = p<0.01 and *= p <0.05, student's t- test.
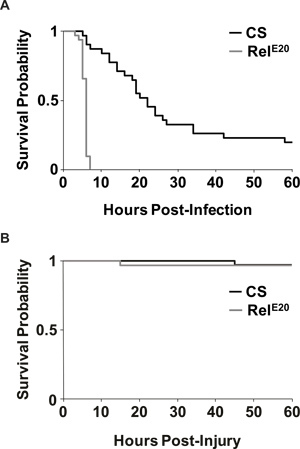 Figure 4. Survival outcome of infected and uninfected flies. (A) Representative Kaplan-Meier survival curves are plotted for both wild-type CS and immune-deficient RelE20 flies that were infected with S. marcescens. p = 8.13x 10⁻¹³, log rank test. n=31 for CS and n=32 for RelE20 flies. (B) Representative Kaplan-Meier survival curves are reported as in (A), except flies received aseptic injury by injection with liquid media without bacteria. Nearly all flies survived aseptic injury until the end of experiments (60 hr post injury). p >0.97, log rank test; n=32 for CS and RelE20 flies.
 Figure 5. Quantification of bacterial load in flies infected with S. marcescens. (A) Representative bacterial culture from CS flies infected with S. marcescens that were harvested immediately after infection (Left panel), or 24 hr after infection (Right panel). Dilution factors are indicated below each figure. In this example, 10 flies were homogenized in 400 μl solution for each group. 100 μl of the final dilution was spread onto each plate. The left plate contains 29 colony forming units (cfu). To calculate cfu/fly, divide 29 cfu by [10 flies * 0.001 (dilution factor) * 100 μl (volume spread onto plate)], which equals 29, and then multiply by the initial volume of 400 μl = 11,600. For this particular plate, we have an average of 1.16 x 10⁴ cfu/fly. The right plate contains 257 colonies. Using the same formula, we find an average of 1.03 x 10⁶ cfu/fly. (B) After calculating cfu/fly from each plate in each experimental condition, generate box-and-whisker plots as shown. In this example, the 25th, 50th (median) and 75th percentile are presented as the bottom, middle and top of the box. Error bars represent standard deviation across three independent experiments. ** p < 0.01 student's t-test.
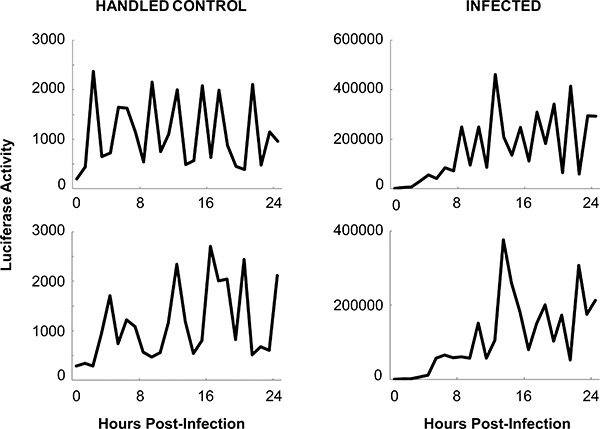 Figure 6. NFκB dependent luciferase reporter activity in individual flies infected with S. marcescens. Representative examples of raw data are shown for individual uninfected flies (handled control; left panels) and infected flies (right panels). A baseline reading (time '0') was collected immediately before infection or handling; all other time points were collected after flies were treated. Note the differences in scale in the y-axes between flies in the infected and handled control conditions. Large variation of the signal within each fly may be attributed to the movement of the fly inside the microwell.
 Figure 7. Infection with S. marcescens or injury with aseptic injection increases κB-luc reporter activity in living flies. Mean ± SEM luciferase activity (arbitrary units) is plotted every 4 hr across all flies that were infected (A) or injured by aseptic injection (B) and survived up to 24 in the assay. One-way ANOVA with repeated measures indicated that reporter activity increased significantly in infected (p< 0.05), injured (inj; p<0.01), and their handled control (HC; p<0.01) groups relative to their baseline (time '0'; Tukey's post-hoc). (Insert, panel A): Data from the HC group are plotted on a different scale. The small but significant increase in reporter activity in the HC group suggests that flies may have experienced mild stress or increased wakefulness from handling (transfer to and from the microwell plate and anesthetization equivalent to infected flies). Both the infected and injured groups showed strong inductions of κB-luc reporter activity that were significantly higher than that in the HC group at indicated time points.* = p <0 .05; ** = p <0 .01; student's t-test; For (A) n=20 HC and n=13 Infection; for (B) n=15 HC and n=14 injury.
Discussion
This protocol outlines an approach to investigate how behavior, particularly sleep, is linked to immune response parameters. These parameters include bacterial load, survival outcome, and NFκB activity as measured by a luciferase reporter in vivo. Together these parameters provide information about how well a fly can fight an infection. Bacterial load and survival outcome are immune response parameters that involve a straightforward measurement in Drosophila. RelE20 mutants, which lack an NFκB transcription factor that is central to the immune response, succumb rapidly to bacterial infection. Genetic or other manipulations of behavior may also influence these immune response parameters, possibly by affecting NFκB activity itself. For example, sleep deprivation prior to infection increases expression of Relish mRNA, and reduces cfu/fly relative to non-deprived controls11. Mutants of the clock genes, period7 and timeless8, have also been reported to reduce survival during an infection as well as bacterial clearance8. Further studies which use this approach are expected to provide mechanistic insight into how behavior may influence immune function.
The injection/infection procedure we describe here is modified from a method described previously by Wu et al16. This procedure is simple and inexpensive. However, a disadvantage is that manual control of injection volume with the use of dye as an indicator is crude and can contribute to variability. Other groups have used a microinjector to enable a constant injection volume17, or have stabbed flies with a needle dipped in bacterial culture18. Nonetheless, the method presented here has been successful in detecting changes in bacterial clearance across experimental conditions11,19.
Survival of flies during infection is typically quantified by counting the remaining flies at regularly timed intervals. Here we use the Trikinetics DAM system to monitor the time of death in individual flies, which is indicated by cessation of activity. We have verified that the survival outcome as determined by locomotor activity is the same as that determined by visual inspection of flies in the activity tubes during infection (unpublished). This method has also been used previously to measure life span20,21. However, it is important to note that evaluation of survival in the DAM system is limited to that in isolated flies, and that results derived from this condition are expected to be different from those in grouped conditions. Early studies have shown differences in survival when the host is placed in groups versus isolated conditions22. Recent work has also confirmed that life span in groups of flies is longer than that in isolated flies20.
Luciferase reporter activity has been used previously for analysis of clock gene expression in living flies (for example, ref 23). In these cases, other technical considerations are necessary, particularly the depletion of the luciferin substrate which occurs over several days of running the assay. In contrast, the assay described here is limited to the survival of infected flies and involved a straightforward measurement over 24 hr after infection. A repeated measures ANOVA was sufficient to evaluate changes from baseline within each group. Statistical approaches to analyzing a circadian oscillation of luciferase reporters, along with normalization steps to correct for substrate depletion are fully discussed elsewhere24. In either case, measuring real-time reporter activity in individual flies is a more efficient method for extracting information about its temporal dynamics than standard biochemical and immunohistochemical assays.
However, a potential disadvantage to monitoring luciferase reporter activity in vivo is that it is dependent on flies eating the luciferin substrate. Anorexia has been associated with infection in flies, and feeding may also vary with the type of infection or among genotypes25. To circumvent concern about ingestion of the substrate, flies can be dissected into separate body parts or tissues following infection, and reporter activity can be measured in culture as described previously26. Alternatively, results from the luciferase assay can also be verified using a standard assay that does not rely on feeding. For example, quantitative PCR has been a commonly used approach to measure expression levels of antimicrobial peptide (AMP) mRNA. AMPs are known targets of NFκB, and therefore indicate its level of activity.
The representative data described here recapitulate previous work showing that NFκB rises with immune challenge and a subsequent increase in sleep2. However, readers are cautioned that sleep in the Trikinetics DAM system is indicated by inactivity for a minimum of five consecutive minutes27. Measurement of sleep in the fly by videography also relies on inactivity28. This sleep definition in flies may potentially be problematic during an infection, because it is also known that immune challenged animals will become inactive for long periods without sleeping29. To overcome this issue, assays that measure sensory responsiveness are necessary to verify that flies are indeed asleep. Investigators have determined responsiveness of flies to sensory stimuli, such as a pencil tap30, brushing the activity tubes with a wooden stick31, or heating one end of a tube27. In all cases, sleeping flies are less responsive (measured either by response latency or by percent flies responding as a group) than awake flies. We have found that infected flies that are sleeping are indeed less responsive to sensory stimuli up to 6-8 hr post-infection (T-H. Kuo and J.A. Williams, unpublished observation). Despite the technical limitations, the Trikinetics DAM system provides a high throughput advantage that will be useful for future studies in flies that explore a genetic and molecular link between sleep and immune function.
Disclosures
No conflicts of interest declared.
Acknowledgments
This work was supported by the National Science Foundation under grant #IOS-1025627 and by the National Institutes of Health under grant #1R21NS078582-01 to J.A.W.
References
- Majde JA, Krueger JM. Links between the innate immune system and sleep. J. Allergy Clin. Immunol. 2005;116:1188–1198. doi: 10.1016/j.jaci.2005.08.005. [DOI] [PubMed] [Google Scholar]
- Kuo TH, Pike DH, Beizaeipour Z, Williams JA. Sleep triggered by an immune response in Drosophila is regulated by the circadian clock and requires the NFkappaB Relish. BMC Neurosci. 2010;11:1471–2202. doi: 10.1186/1471-2202-11-17. [DOI] [PMC free article] [PubMed] [Google Scholar]
- Preston BT, Capellini I, McNamara P, Barton RA, Nunn CL. Parasite resistance and the adaptive significance of sleep. BMC Evol Biol. 2009;9:7. doi: 10.1186/1471-2148-9-7. [DOI] [PMC free article] [PubMed] [Google Scholar]
- Imeri L, Opp MR. How (and why) the immune system makes us sleep. Nat. Rev. Neurosci. 2009;10:199–210. doi: 10.1038/nrn2576. [DOI] [PMC free article] [PubMed] [Google Scholar]
- Ayres JS, Schneider DS. A Signaling Protease Required for Melanization in Drosophila Affects Resistance and Tolerance of Infections. PLoS Biol. 2008;6:e305. doi: 10.1371/journal.pbio.0060305. [DOI] [PMC free article] [PubMed] [Google Scholar]
- Chiu JC, Low KH, Pike DH, Yildirim E, Edery I. Assaying Locomotor Activity to Study Circadian Rhythms and Sleep Parameters in Drosophila. J. Vis. Exp. 2010. p. e2157. [DOI] [PMC free article] [PubMed]
- Lee JE, Edery I. Circadian Regulation in the Ability of Drosophila to Combat Pathogenic Infections. Curr. Biol. 2008;18:195–199. doi: 10.1016/j.cub.2007.12.054. [DOI] [PMC free article] [PubMed] [Google Scholar]
- Stone EF, et al. The circadian clock protein timeless regulates phagocytosis of bacteria in Drosophila. PLoS Pathog. 2012;8:e1002445. doi: 10.1371/journal.ppat.1002445. [DOI] [PMC free article] [PubMed] [Google Scholar]
- Hill-Burns EM, Clark AG. X-linked variation in immune response in Drosophila melanogaster. Genetics. 2009;183:1477–1491. doi: 10.1534/genetics.108.093971. [DOI] [PMC free article] [PubMed] [Google Scholar]
- Short SM, Lazzaro BP. Female and male genetic contributions to post-mating immune defence in female Drosophila melanogaster. Proc. Biol. Sci. 2010;277:3649–3657. doi: 10.1098/rspb.2010.0937. [DOI] [PMC free article] [PubMed] [Google Scholar]
- Williams JA, Sathyanarayanan S, Hendricks JC, Sehgal A. Interaction between sleep and the immune response in Drosophila: a role for the NFkappaB relish. Sleep. 2007;30:389–400. doi: 10.1093/sleep/30.4.389. [DOI] [PMC free article] [PubMed] [Google Scholar]
- Ramsden S, Cheung YY, Seroude L. Functional analysis of the Drosophila immune response during aging. Aging Cell. 2008;7:225–236. doi: 10.1111/j.1474-9726.2008.00370.x. [DOI] [PubMed] [Google Scholar]
- Williams JA, Su HS, Bernards A, Field J, Sehgal A. A circadian output in Drosophila mediated by neurofibromatosis-1 and Ras/MAPK. Science. 2001;293:2251–2256. doi: 10.1126/science.1063097. [DOI] [PubMed] [Google Scholar]
- Hedengren M, et al. Relish, a central factor in the control of humoral but not cellular immunity in Drosophila. Mol. Cell. 1999;4:827–837. doi: 10.1016/s1097-2765(00)80392-5. [DOI] [PubMed] [Google Scholar]
- Leulier F, Rodriguez A, Khush RS, Abrams JM, Lemaitre B. The Drosophila caspase Dredd is required to resist gram-negative bacterial infection. EMBO Rep. 2000;1:353–358. doi: 10.1093/embo-reports/kvd073. [DOI] [PMC free article] [PubMed] [Google Scholar]
- Wu LP, Choe K-M, Lu Y, Anderson KV. Drosophila Immunity: Genes on the Third Chromosome Required for the Response to Bacterial Infection. Genetics. 2001;159:189–199. doi: 10.1093/genetics/159.1.189. [DOI] [PMC free article] [PubMed] [Google Scholar]
- Dionne MS, Ghori N, Schneider DS. Drosophila melanogaster is a genetically tractable model host for Mycobacterium marinum. Infect. Immun. 2003;71:3540–3550. doi: 10.1128/IAI.71.6.3540-3550.2003. [DOI] [PMC free article] [PubMed] [Google Scholar]
- Romeo Y, Lemaitre B. Drosophila immunity: methods for monitoring the activity of Toll and Imd signaling pathways. Methods Mol. Biol. 2008;415:379–394. doi: 10.1007/978-1-59745-570-1_22. [DOI] [PubMed] [Google Scholar]
- Lu Y, Wu LP, Anderson KV. The antibacterial arm of the Drosophila innate immune response requires an I{kappa}B kinase. Genes Dev. 2001;15:104–110. doi: 10.1101/gad.856901. [DOI] [PMC free article] [PubMed] [Google Scholar]
- Koh K, Evans JM, Hendricks JC, Sehgal A. A Drosophila model for age-associated changes in sleep:wake cycles. Proc. Natl. Acad. Sci. U. S. A. 2006;103:13843–13847. doi: 10.1073/pnas.0605903103. [DOI] [PMC free article] [PubMed] [Google Scholar]
- Bushey D, Hughes KA, Tononi G, Cirelli C. Sleep, aging, and lifespan in Drosophila. BMC Neurosci. 2010;11:1471–2202. doi: 10.1186/1471-2202-11-56. [DOI] [PMC free article] [PubMed] [Google Scholar]
- Allee WC. The social life of animals. W.W. Norton & Company, Inc; 1938. [Google Scholar]
- Stanewsky R, Jamison CF, Plautz JD, Kay SA, Hall JC. Multiple circadian-regulated elements contribute to cycling period gene expression in Drosophila. Embo. J. 1997;16:5006–5018. doi: 10.1093/emboj/16.16.5006. [DOI] [PMC free article] [PubMed] [Google Scholar]
- Levine JD, Funes P, Dowse HB, Hall JC. Signal analysis of behavioral and molecular cycles. BMC Neurosci. 2002;3:1. doi: 10.1186/1471-2202-3-1. [DOI] [PMC free article] [PubMed] [Google Scholar]
- Ayres JS, Schneider DS. The role of anorexia in resistance and tolerance to infections in Drosophila. PLoS Biol. 2009;7:e1000150. doi: 10.1371/journal.pbio.1000150. [DOI] [PMC free article] [PubMed] [Google Scholar]
- Plautz JD, Kaneko M, Hall JC, Kay SA. Independent photoreceptive circadian clocks throughout Drosophila. Science. 1997;278:1632–1635. doi: 10.1126/science.278.5343.1632. [DOI] [PubMed] [Google Scholar]
- Huber R, et al. Sleep homeostasis in Drosophila melanogaster. Sleep. 2004;27:628–639. doi: 10.1093/sleep/27.4.628. [DOI] [PubMed] [Google Scholar]
- Zimmerman JE, Raizen DM, Maycock MH, Maislin G, Pack AI. A video method to study Drosophila sleep. Sleep. 2008;31:1587–1598. doi: 10.1093/sleep/31.11.1587. [DOI] [PMC free article] [PubMed] [Google Scholar]
- Toth LA, Rehg JE, Webster RG. Strain differences in sleep and other pathophysiological sequelae of influenza virus infection in naive and immunized mice. J. Neuroimmunol. 1995;58:89–99. doi: 10.1016/0165-5728(94)00193-r. [DOI] [PubMed] [Google Scholar]
- Hendricks JC, et al. Rest in Drosophila is a sleep-like state. Neuron. 2000;25:129–138. doi: 10.1016/s0896-6273(00)80877-6. [DOI] [PubMed] [Google Scholar]
- Wu MN, Koh K, Yue Z, Joiner WJ, Sehgal A. A genetic screen for sleep and circadian mutants reveals mechanisms underlying regulation of sleep in Drosophila. Sleep. 2008;31:465–472. doi: 10.1093/sleep/31.4.465. [DOI] [PMC free article] [PubMed] [Google Scholar]