

Abstract
In order to better understand the effects of β-alanine (β) substitution and the number of heterocycles on DNA binding affinity and selectivity, the interactions of an eight-ring hairpin polyamide (PA) and two β derivatives as well as a six-heterocycle analog have been investigated with their cognate DNA sequence, 5′-TGGCTT-3′. Binding selectivity and the effects of β have been investigated with the cognate and five mutant DNAs. A set of powerful and complementary methods have been employed for both energetic and structural evaluations: UV-melting, biosensor-surface plasmon resonance, isothermal titration calorimetry, circular dichroism and a DNA ligation ladder global structure assay. The reduced number of heterocycles in the six-ring PA weakens the binding affinity; however, the smaller PA aggregates significantly less than the larger PAs, and allows us to obtain the binding thermodynamics. The PA-DNA binding enthalpy is large and negative with a large negative ΔCp, and is the primary driving component of the Gibbs free energy. The complete SPR binding results clearly show that β substitutions can substantially weaken the binding affinity of hairpin PAs in a position-dependent manner. More importantly, the changes in PA binding to the mutant DNAs further confirm the position-dependent effects on PA-DNA interaction affinity. Comparison of mutant DNA sequences also shows a different effect in recognition of T•A versus A•T base pairs. The effects of DNA mutations on binding of a single PA as well as the effects of the position of β substitution on binding tell a clear and very important story about sequence dependent binding of PAs to DNA.
Polyamides (PA) have been developed from AT-specific-binding natural products into a broad, sequence-specific class of minor groove binding agents1–4. These compounds have had a significant impact on our understanding of DNA molecular recognition, transcription factors binding and inhibition, and DNA allosteric transitions5–7. In a very exciting step forward in the development of these compounds, several groups have shown that they can be taken up by cells in significant amounts and in reasonable time periods. These cellular observations have led to expanded development of therapeutic applications for PAs, and animal testing has been initiated8–13.
Although PAs have been the subject of extensive development for DNA minor groove binding, they are complicated agents and more detailed information about DNA and PA sequence effects on their interaction energetics is needed for a complete understanding. In therapeutic development of PAs it is generally useful to incorporate a β in place of one or more heterocyclic units, for example, to allow the compounds to better conform to the shape of the DNA minor groove8, 14–16. In a search for compounds to inhibit transcription factor binding to the human COX2 promoter, a striking decrease in binding affinity was observed for a β substituted PA17. Because of a major development of PAs to target that eliminate the circular genomic DNA molecules of high-risk human papillomavirus (HPV) from human keratinocyte cell and tissue cultures, and the observation that antiviral efficacy varies dramatically for positional isomers in which β and N-methylpyrrole building blocks are swapped8, it is essential to better understand the positional effects of heterocyclic substitution by β to design the optimum DNA targeting drugs. In order to help define the basis for the unexpected energetic cost of β substitution, more detailed studies on several PA-DNA complexes are presented here. The original observation of an unfavorable β substitution effect was in an eight-ring hairpin PA with the β substitution on the N-terminal side of the γ hairpin loop (KA1007, Figure 1). An additional compound of the same heterocycle composition, but with the β substitution on the C-terminal side of the loop (KA1055), has now been synthesized to evaluate positional effects of substitution relative to the loop. To determine the energetic effects of simply removing heterocycles from the eight-ring PA, a six-ring PA (KA1039) that binds to the same DNA sequence has also been synthesized and evaluated. Five DNA sequences with one or two base pair mutations in different positions have been studied to evaluate the positional role of DNA base pairs in the PA-DNA complexes. A powerful and complementary set of energetic and structural methods have been used here to study the PA-DNA interactions: thermal melting (Tm), biosensor-surface plasmon resonance (SPR), isothermal titration calorimetry (ITC), circular dichroism (CD), and DNA ligation ladder polyacrylamide gel electrophoresis (PAGE). The results show a large effect of β substitution placement, DNA base mutation position and the number of heterocyclic rings on PA-DNA interaction and DNA structure.
Figure 1.

Polyamide structures and their cognate DNA sequence. Note that KA1002 has eight heterocyclic rings, KA1007 and KA1055 have 7 rings with one β linker, and KA1039 has six heterocyclic rings. All four polyamides target the TGGCTT DNA sequence (see Table 1).
Materials and Methods
Polyamides, DNAs and Buffers
All the PAs in this study were synthesized previously18 except for KA1055 (Supporting Information, Figures S1–S9). KA1055 was purified twice by RP HPLC: the first case resulted in nonstoichiometric ammonium trifluoroacetate ([NH4]+ was observed in the 1H NMR) derived from trace ammonia present in Aldrich HPLC-grade MeOH; the second case used ammonia-free mobile phase and gave the expected (TFA)3 salt with no extra ammonium ion. 1H NMR at 500 and 600 MHz (in DMSO-d6 with and without a drop of D2O), elemental analysis (for C, H, N and F) and HPLC/MS data are provided in the supporting information. High resolution mass spectrometry was also carried out to help prove the identity of KA1055: HRMS (MSn ESI+) calculated for C54H70N21O10 MH+, 1172.56145; found 1172.55845. DNA oligomers were purchased from Integrated DNA Technologies, Inc. (IDT, Coralville, IA), with HPLC purification and mass spectrometry characterization. 5′-biotin labeled hairpin DNA TGGCTT (5′-Biotin-CCTTGGCTTCTTTTGAAGCCAAGG-3′, Figure 1) with the hairpin loop sequence underlined was used in surface plasma resonance experiments. The same sequence without biotin was used for thermal melting, isothermal titration calorimetry and circular dichroism experiments. A 21 base pair duplex with two phased TGGCTT was used as the ligation ladder in polyacrylamide gel electrophoresis.
HEPES buffer containing 10 mM HEPES, 50 mM NaCl and 1 mM EDTA at pH 7.4 was used for UV-melting, ITC and CD experiments. The SPR experiments were performed in filtered, degassed HEPES buffer with 0.05% v/v surfactant P20. TBE buffer contained 89 mM Tris, 89 mM boric acid, 2 mM EDTA and pH 8.3 was used for the gel electrophoresis experiment.
Biosensor-Surface Plasmon Resonance
SPR measurements were performed with four-channel Biacore T200 and T100 optical biosensor systems (GE Healthcare, Inc., Piscataway, NJ) at 25 °C. A streptavidin-derivatized (SA) sensor-chip was prepared for use by conditioning with a series of 60 sec injections of 1 M NaCl in 50 mM NaOH (activation buffer) followed by extensive washing with HBS buffer (10 mM HEPES, 150 mM NaCl, 3 mM EDTA, 0.05% P20, pH 7.4). Biotinylated DNA samples (25–50 nM) were prepared in HBS buffer and immobilized on the flow cell surface by non-covalent capture as previously described19. Flow cell 1 was left blank as a reference, while flow cells 2–4 were immobilized with DNA by manual injection of DNA stock solutions (flow rate of 1 μL/min) until the desired amount of DNA response units was obtained (350–400 RU). Ligand solutions were prepared with degassed and filtered HEPES buffer by serial dilutions from a concentrated stock solution. Typically, a series of different ligand concentrations (1 nM to 1 μM) were injected over the DNA sensor-chip at a flow rate of 25 μL/min until a constant steady-state response was obtained (5–10 min), and this was followed by buffer flow for ligand dissociation (10–15 min). After each cycle, the sensor-chip surface was regenerated with 10 mM glycine solution at pH 2.5 for 30 sec followed by multiple buffer injections to obtain a stable baseline for the following cycles.
Steady-state equilibrium binding analyses were performed by linear averaging of the observed response (RUobs) in the steady-state region over a selected time region at different compound concentrations and converting them to the moles of bound ligand per mole of DNA, RUobs/RUmax, where RUmax is the predicted maximum response per bound compound and was calculated from the DNA molecular weight, the compound molecular weight, the amount of DNA immobilized on the flow cell, and the refractive index gradient ratio of the compound and DNA, as previously described20. The RUobs was plotted as a function of free ligand concentration (Cfree) and the equilibrium binding constants (KA) were determined with a one-site binding model using nonlinear least-squares optimization to obtain an optimal fit for RUobs using RUmax× (KA Cfree)/(1+ KA Cfree). The RUmax in the equation was used as a fitting parameter and the obtained value was compared to the predicted maximum response per bound ligand to independently evaluate the stoichiometry20. Kinetics analysis were performed by global fitting the binding results for the entire concentration series using a standard 1:1 kinetics model with integrated mass transport-limited binding parameters as described21, 22.
Isothermal Titration Calorimetry
ITC experiments were performed using a MicroCal VP-ITC (MicroCal Inc., Northampton, MA) interfaced with a computer equipped with VP-2000 software for instrument control and Origin 7.0 for data analysis. The sample cell was filled with 10 μM hairpin DNA in HEPES buffer and 30 injections of 10 μL of compound solution were performed incrementally. A delay of 300 sec was used between each injection to ensure the equilibration of baseline. The heat for each injection was obtained by integration of the peak area as a function of time. The heats of dilution, determined by injecting compound into the sample cell containing only buffer, were subtracted from those in compound/DNA titrations to present the corrected binding-induced enthalpy changes. A range of compound concentrations and temperatures were used in these experiments to optimize conditions for data collection.
UV Thermal Melting
DNA melting (Tm) curves were recorded with a Cary 300 UV visible spectrophotometer (Varian Inc., Palo Alto, CA) equipped with a thermoelectrically controlled cell holder. The absorbances of the free DNA and PA-DNA complex were measured at 260 nm in 1 cm quartz cuvettes from 25 °C to 95 °C with a heating rate of 0.5 °C/min. The DNA concentration was 3 μM in hairpin, while the concentrations of PAs ranged from 0 to 6 μM. The Tm curves were normalized to give equimolar DNA concentrations. All the thermal melting experiments were conducted three times.
Circular Dichroism
CD spectra were collected using a Jasco J-810 spectrometer (Jasco Inc., Easton, MD) from 450 nm to 230 nm with 1 cm quartz cuvettes at 25 °C. The spectra were averaged over four scans with a scan speed of 50 nm/min and a buffer blank correction. A 5 μM DNA solution was first scanned and the compounds at increasing concentration ratios were then titrated into the same cuvette and the complexes were scanned under the same conditions.
Ligation Ladders and Gel Electrophoresis
A 21 base single-strand DNA with two phased TGGCTT sites and its complementary strand were combined in 1:1 molar ratio and annealed in 1X ligation buffer (New England Biolabs, Ipswich, MA) containing 50 mM Tris–HCl, 10 mM MgCl2, 10 mM dithiothreitol and 1 mM ATP. Annealed duplexes were 5′ phosphorylated using T4 polynucleotide kinase (New England Biolabs, Ipswich, MA) for 30 min at 37 °C followed by enzyme deactivation at 65 °C for 20 min. These duplexes were then ligated with T4 DNA ligase (New England Biolabs, Ipswich, MA) at room temperature for 20 min followed by an inactivation time of 20 min at 65 °C. M21, a 21-mer sequence used as the mobility standard, and A5, which is the reference sequence for curvature calculation, were annealed and ligated in the same procedure. For an additional set of markers varying in length by 20 bp (Bayou Biolabs, Metairie, LA), a commercially available standard sequence with the 100 bp band in double intensity was used.
Ligation ladders were separated on 8% native polyacrylamide gel (1.5 mm thick, 20 cm long) prepared from a 40% acrylamide solution (29:1 acrylamide: bisacrylamide; EMD, Gibbstown, NJ) in 1X TBE buffer. Electrophoresis was at 200 V (10 V/cm) at 25 °C for 170 min in a Bio-Rad Protean II xi gel apparatus using a Bio-Rad PowerPac Basic 300. Each sample contained 2 μM of ligation ladders and compounds in 4:1 concentration ratio of ligand to TGGCTT site. After electrophoresis, gels were stained with SYBR Gold Nucleic Acid Gel Stain (Invitrogen, Carlsbad, CA) at the concentration recommended by the manufacturer for 1 h. The stained gels were imaged using an UltraLum Omega 10gD Molecular Imaging System (UltraLum, Claremont, CA). Migration analysis and molecular weight assignment were performed with Image Quant TL (GE Healthcare, Inc., Piscataway, NJ).
Results
Thermal Melting: Qualitative Comparison of Binding Affinity
Thermal melting is a rapid and qualitative method for comparison of relative compound binding affinities for DNA23. PA screening experiments by thermal melting were conducted with the target sequence TGGCTT and the PAs of Figure 1. The ΔTm value, the Tm of complex minus the Tm of free DNA, for each PA at 1:1 molar ratio of compound: DNA allows ranking of the binding affinities. Melting curves are compared in Figure S10, and ΔTm values are in Table 1. KA1002 increased the Tm of DNA the most, 6.8 °C, while the ΔTm values for KA1007, KA1055 and KA1039 were 0.6 °C, 5.3 °C and 3.2 °C, respectively, with ± 0.5 °C error.
Table 1.
T m analyses, kinetic rate constants, and equilibrium affinities for the different hairpin PAs with their cognate DNA sequence.
KA1002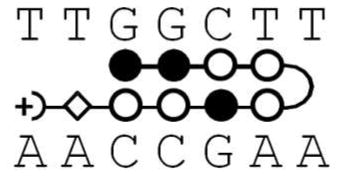
|
KA1007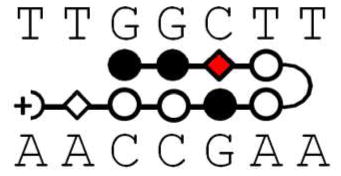
|
KA1055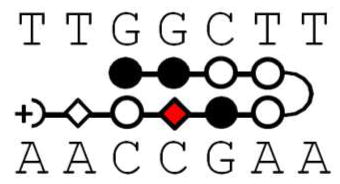
|
KA1039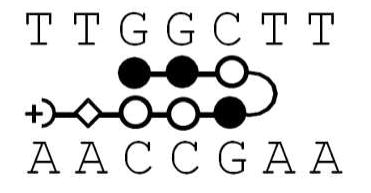
|
|
|---|---|---|---|---|
| ΔTm ± 0.5 °C | 6.8 | 0.6 | 5.3 | 3.2 |
| ka (×106 M−1s−1) | 44 ± 15 | 5 ± 2 | 5 ± 2 | 3 ± 1.5 |
| kd (×10−3 s−1) | 12 ± 2 | 170 ± 10 | 6 ± 1 | 21 ± 5 |
| KA (×108 M−1) | 37 ± 7 | 0.29 ± 0.01 0.27 ± 0.02§ |
12 ± 2 | 1.4 ± 0.2 |
| KD (nM) | 0.3 ± 0.1 | 35 ± 3 | 0.9 ± 0.2 | 7.1 ± 0.7 |
The errors in these values are based on experimental reproducibility.
Only KA1007 could the KA value be determined by both kinetic (top) and steady-state (bottom) fitting using a single-site binding model (Materials and Methods).
The binding affinities of KA1002 and KA1055 with five mutant-DNA sequences (Figure S11) were evaluated by thermal melting at a 1:1 molar ratio and the results are shown in Table 2. The thermal stability of the mutant sequence TGCCTT was enhanced by the PAs compared to the original site TGGCTT, while the ΔTm values for the other mutant sites are all smaller than for TGGCTT. Since TGCCTT has a cognate binding site for KA1002 and KA1055, while the other mutant DNAs do not, the reduced ΔTm values are as expected but the sequence dependence of the effects is large. The sequence effects are discussed in detail below.
Table 2.
T m analyses for KA1002 and KA1055 with TGGCTT and five mutant sequences.
| Cognate and mutant DNA sequences |
Tm (°C) Free DNA |
ΔTm* (°C) KA1002 |
ΔTm* (°C) KA1055 |
|
|---|---|---|---|---|
| TGGCTT | 74.0 | 6.8 | 5.3 | |
| 1 | TGCCTT | 74.1 | 11.3 | 6.2 |
| 2 | TGTCTT | 68.2 | 4.5 | 3.4 |
| 3 | TGGGTT | 73.5 | 0.7 | 0.6 |
| 4 | TGGCCT | 78.8 | 3.1 | 1.3 |
| 5 | TGATTT | 65.6 | 0.5 | 0.8 |
The error of these ΔTm values is ± 0.5 °C, based on experimental reproducibility.
Surface Plasmon Resonance: Quantitative Determination of Binding Affinity and Kinetics
Biosensor-SPR provides a sensitive technique to monitor the progress of reactions in real-time to obtain the kinetics as well as the equilibrium binding affinities of biomolecular interactions19. To quantitatively evaluate the binding interactions of the hairpin PAs with their target DNA sequence and also to provide details on the positional effects of the substitution of Py by the internal β, SPR experiments were conducted with a hairpin duplex containing the cognate binding site, 5′-TGGCTT-3′ (Figure 2). It is clear from the shape of the binding curves that different PAs have varying on and off rates with the DNA with a strong effect of β substitution. The rate constants obtained from global kinetics fitting of the sensorgrams and the equilibrium binding constants for the different PAs are listed in Table 1.
Figure 2.

SPR sensorgrams (color) and the global kinetics fits (black overlays) for all PAs with the cognate TGGCTT DNA sequence. The concentrations from bottom to top are 1.5, 2, 2.5, 3, 5, 6, 9 nM for KA1002; 5, 10, 20, 40, 60 nM for KA1007; 2, 3, 4, 6, 8, 15 and 2, 3, 4, 5, 8, 10, 20, 30 nM for KA1055 and KA1039, respectively.
KA1002, the parent PA without β substitutions, clearly stands out as the strongest binder with the cognate sequence (KA= 37±7 × 10⁸ M−1; Table 1). The strong binding observed with this compound can be attributed to the fast association and the very slow dissociation rates (Table 1). The single substitution of one of the pyrrole moieties with a β on the N-terminal side of the KA1002 hairpin loop results in a dramatic 120-fold decrease in the binding affinity of KA1007 with the cognate sequence (KA= 0.29±0.01 × 10⁸ M−1). This β substitution decreases the association rate of the ligand by a factor of 10 (Table 1) when compared to KA1002, but much of the decrease in the binding affinity observed is the consequence of a faster dissociation rate of KA1007 from DNA (~15-fold larger kd than for KA1002). The faster dissociation of KA1007 is evident in the sensorgrams (Figure 2) where much of the compound has dissociated from DNA within the first few seconds of the dissociation phase.
Interestingly, a similar β substitution of a pyrrole unit on the C-terminal side of the γ hairpin loop (KA1055) results in only a 3-fold decrease in the binding affinity relative to KA1002. Although the association rate constant of KA1055 is 10-fold lower than for KA1002, the binding affinity is only 3-fold lower due to a dissociation rate for KA1055 that is two-fold slower than for KA1002. It should be noted that even though the association rates of the two PAs with a single β substitution (KA1007 vs. KA1055) are very similar, the dissociation rates differ by a factor of 30 thereby significantly affecting the equilibrium binding affinities. While this large difference at first seems remarkable, it can be explained by sequence effects as described below.
A six-ring hairpin PA without a β substitution, KA1039, was also tested to evaluate the effects of the number of ring systems on the equilibrium binding and kinetics with the same cognate DNA. As expected, the binding affinity of KA1039 was weaker and the data shows that it decreased by a factor of 25 relative to KA1002 with eight rings. The reduction of the number of rings significantly decreased the association rate of KA1039 relative to KA1002 whereas only a 2-fold increase in the dissociation rate was observed. It is appealing that the six-ring compound actually binds more strongly than the eight-ring, KA1007. All of the experiments have been repeated at least three times and the results are quite reproducible. The experimental errors in Table 1 are based on the repeat variations.
ITC: Thermodynamics of polyamide--DNA interactions
While the large ΔG for polyamide binding can be obtained most accurately from SPR, a more detailed energetic understanding of the interactions requires direct enthalpy determination by ITC24, 25. Due to the experimental limitations for the large K values for the binding of PAs to TGGCTT, only the binding enthalpies, ΔH, could be obtained at the concentrations required in ITC experiments. ΔH was determined at low molar ratios of compounds to DNA due to potential strong aggregation of the hairpin PAs at high concentrations and molar ratios to DNA. In this type of experiment, all added compound is bound to DNA and the binding ΔH can be directly determined from the average binding heat/mole without any specific fitting model by simply subtracting the integrated peak areas for ligand/buffer titration from the ligand/DNA titration26, 27. Several concentrations of the PA and DNA were used to test for possible aggregation effects of the PA in ITC titrations. Figure 3 shows a titration of KA1039 into TGGCTT with the buffer blank correction, and the ΔH value for binding is −11.1 ± 0.5 kcal/mol at 25 °C. The ΔH values for the titration at concentrations from 25 μM to 50 μM were similar (not shown) and suggest that with this PA, aggregation is not a problem under ITC conditions. ITC experiments for the larger eight-ring or the β containing PAs were tried at several concentrations but with no success. Increasing the temperature of the ITC experiment to 45 °C still did not allow consistent determination of ΔH of the large PAs. Based on the erratic and noisy titration curves obtained, this is probably due to aggregation of the longer PAs at ITC concentrations28.
Figure 3.

An ITC titration of 37.5 μM KA1039 into 10 μM TGGCTT hairpin duplex at 25 °C is shown in the top panel. The integrated heats after subtraction of the heat of dilution are plotted versus KA1039/DNA molar ratio in the bottom panel.
The heat capacity (ΔCp) of KA1039 has been determined by conducting the ITC titrations at different temperatures. The profile of ΔH versus temperature is shown on Figure 4, and a linear fit yields a ΔCp of −287 cal M−1 K−1. Based on SPR binding free energy values, ΔG = −RT ln K, and the ITC enthalpy values, the T ΔS values were calculated from ΔG = ΔH−T ΔS at different temperatures (Figure 4). Comparison of the contributions of the enthalpy and entropy to the free energy shows that PA complex formation is dominated by the favorable binding enthalpy.
Figure 4.

Thermodynamic results, ΔG from SPR, ΔH from ITC, and TΔS calculated from ΔG= ΔH-T ΔS, for binding of KA1039 to the TGGCTT site at different temperatures.
CD: Evaluation of Binding mode and DNA Structural Changes
Binding of PAs to the TGGCTT site as a function of compound concentration are evaluated by CD spectroscopy. The CD signals monitor the asymmetric environment of the compounds when bound to DNA and thus can be used to obtain information on the binding mode29. In Figure 5, the CD results for the hairpin PA complexes are characterized by large, positive induced signals from 300 nm to 400 nm, where the compounds absorb and the DNA signals do not interfere. The large positive induced CD signals indicate a minor groove mode of binding as expected for these PAs30. All the titrations were conducted incrementally from 0:1 to 2:1 molar ratio of ligand to binding site. The strongest binder among four ligands, KA1002, induced the largest CD signals upon binding followed by KA1055, KA1039 and the weaker binder, KA1007. Moreover, negative induced signals have been observed with KA1002 and KA1039 around 300 nm where they absorb, but not with the β containing KA1007 and KA1055. This observation could be simply due to the loss of one heterocyclic unit in the β derivatives and/or that the introduction of β changes the environment of the PA-DNA minor groove complex. There is not a large change in the DNA CD signals on binding of any of the compounds, suggesting that they do not cause major changes in DNA base stacking.
Figure 5.

Induced CD signals for TGGCTT with all PAs in HEPES buffer at 25 °C. Molar ratios of compound to DNA hairpin are from 0 to 2.0 as the induced CD signal for the PAs increases.
Gel Electrophoresis: Mobility and Curvature Changes Induced By Polyamides Binding
Ladders of ligated DNA sequences, which have phased binding sequences (Figure 6A), provide an excellent method to evaluate binding induced structural changes in different sequences31, 32. The method provides complementary information about structure and binding induced effects to the results from CD, such as the DNA bending angles which cannot be obtained through CD. PAGE results for ligation ladders of the sequence TGGCTT without and with PAs are compared in Figure 6B. The molecular weight of each gel band was assigned by adding 21 bp to each sequential band starting from the one with the highest mobility and using both the M21 and 20 bp ligation markers for additional reference. In Figure 6B, as indicated by the arrows, the 252 bp ligated multimers were used to compare the DNA mobility. This DNA size was used for comparison since its mobility changes are more prominent than the shorter ladders and it is well separated from other ligated multimers. The gel results show that the unbound TGGCTT migrated at approximately the same rate as the random-sequence, mobility-marker, M21, which indicates that TGGCTT is relatively straight. Mobility retardation of TGGCTT is observed with addition of KA1002, KA1055 and KA1039, but not with KA1007. Among all the ligands, KA1039, the compound containing six-heterocyclic rings, decreased the target sequence’s mobility the most.
Figure 6.

(A) Ligation ladder sequence of TGGCTT, AAAAA and M21. (B) 8% (29:1) native polyacrylamide gel of TGGCTT with four PAs. All PAs were incubated with TGGCTT duplex in the molar ratio of 4:1 ligand: binding site. A 21 bp (M21) and a 20 bp marker are loaded as the migration standards, and AAAAA is shown as the curvature standard. Arrows indicate the 252 bp ligated multimers. (C) Plot of the relative mobility, RL, as a function of Lact for AAAAA and TGGCTT in the absence and the presence of the PAs.
The relative mobility (RL), where RL=Lapparent/Lactual, was calculated for each ligation ladder and plotted as a function of Lactual for each sample (Figure 6C). Lactual is the actual molecular weight in bp of each ligated multimer and Lapparent is the apparent molecular weight in bp determined according to the distance, relative to the standard, each ladder migrates in the gel. The RL values of the marker M21 have been normalized to 1.0 and thus an RL value greater than 1.0 indicates lower mobility, which suggests a more curved DNA structure33. From the RL values, it is obvious that the RL value of unbound TGGCTT is slightly greater than 1, and the enhancement of RL values is the most significant with the binding of KA1039, followed by KA1055 and KA1002. KA1007 increased the RL values very slightly and the change is not detectable until the multimers are longer than 210 bp. The retarded mobilities and increasing RL values suggest that the relatively straight TGGCTT sequence has been bent upon binding of the PAs.
In order to quantitatively evaluate the PA effects on DNA curvature, a well-studied sequence, AAAAA (A5, Figure 6A), was used as a reference. The phased A5 containing sequences migrate much slower than their true molecular weight in the gel (Figure 6B) since A5 tracts bend the DNA structure by 18° per helical turn31, 34. The PA curvature calculations are as described previously31, 33, 34. Briefly, RL values for ligated multimers in range of 105 bp ≤ Lactual ≤ 189 bp were averaged over three gel experiments for the A5. Data were fitted to , where Cr is the relative curvature and equals to 1.0 for AAAAA by definition. From the linear fit, values for a and b were determined giving . Using this equation, the relative curvature, Cr values, for unbound TGGCTT and the complexes can be determined (Table 3). The Cr values can be converted to bending angles with a 1.0 Cr value equivalent to an 18° bending. Free TGGCTT is a straight sequence, Cr≈0, while the binding of KA1002, KA1055 and KA1039 bent TGGCTT by 3°, 3.7° and 5.4° per helical turn respectively. The bending angle for KA1007 is essentially zero.
Table 3.
Relative curvature (Cr) and calculated bend angle (θ) for free DNAs and hairpin PA complexes.
| Cr* | θ (°) | |
|---|---|---|
| AAAAA | 1.00 | 18 |
| TGGCTT | ≈0 | 0 |
| KA1002 | 0.165 | 3.0 |
| KA1007 | ≈0 | 0 |
| KA1055 | 0.203 | 3.7 |
| KA1039 | 0.302 | 5.4 |
Error of Cr is less than ± 0.025.
Discussion
PAs have reached a level of development where they can effectively compete with transcription factors in terms of both affinity and sequence specificity3, 5, 35. Part of their development has been the replacement of one or more of the pyrrole or imidazole heterocycles with flexible β. This substitution can allow improved conformational adjustment and matching of PAs to the local DNA minor groove shape. Dervan, Sugiyama and others have shown the advantages of replacing a heterocycle with a β in terms of improved affinity, particularly as the number of heterocycles in the PAs is increased8, 14, 16. There have, however, been relatively few published studies of effects of substitution of a single heterocycle with a β. Preliminary studies17 suggested that a single β could cause a significant decrease in affinity of sequences targeted to an Ets transcription factor binding site. With other sequence contexts a single β substitution can increase the PA affinity for its cognate site14. To obtain additional information on the molecular basis for the unexpected decrease in affinity, a Py residue was substituted by β in the same PA but on the C-terminal side of the γ hairpin loop (Figure 1) while the original analysis was with a β on the N-terminal side. More detailed studies of both β substituted compounds as well as the unsubstituted parent PA have been conducted with additional DNA sequences, including both thermodynamics and structural methods.
PA and DNA Sequence Effects on Relative Binding Affinity
It is important that the influence of a β on the PA binding varies significantly with position (KA1055 vs. KA1007). In order to better understand the positional effects of β substitution, five mutant DNA sequences have been studied with KA1002 and KA1055 (Table 2). KA1002 binds more strongly to the mutant 1 sequence, 5′-TGCCTT-3′, than to the cognate. Although this seems striking, the switch of the middle G/C base pair into C/G base pair actually can reverse the binding orientation of KA1002. The original orientation is N→C (ImImPyPy) of KA1002 bound 5′→3′ to 5′-TTGGCTT-3′, while with the mutant 1 sequence it becomes N→C (ImImPyPy) targeting 5′→3′ to 5′-AAGCCAA-3′. The stacked Py/Py near the γ loop might be targeting the A•T base pair more strongly in the mutant than the T•A base pair in the original sequences to give a greater ΔTm value. For the mutant sequences 2–5, ΔTm values are smaller than for the cognate site as expected. Through the comparison of ΔTm values for mutants 2–4 and their substitution positions, it is clear that mutation of the fourth bp of the 5′-TGGCTT-3′ site (mutant 3, 5′-TGGGTT-3′) decreases the thermal stability much more significantly than for the fifth bp (mutant 4, 5′-TGGCCT-3′), while the mutant at the third bp (mutant 2, 5′-TGTCTT-3′) influences the binding the least. Once both the third and fourth base pairs have been mutated, mutant 5 (5′-TGATTT-3′), there is only a weak interaction between KA1002 and DNA as indicated by the very slight increase of ΔTm. The ΔTm values for KA1055 show that this β substitution containing PA also prefers mutant 1, 5′-TGCCTT-3′, more than the cognate sequence, TGGCTT, but the increase is less than for KA1002. The ΔTm values with mutant sequences 3 and 5 are similar but weaker than for the cognate site. This indicates that in some cases β substitution can not only weaken the PA’s binding affinity but can also reduce the selectivity of DNA recognition on both binding and flanking sites. Moreover, the ΔTm values clearly show that the mutation of the fourth bp reduces the binding affinity more than the mutations of the third and fifth bps as observed with KA1002 binding. The PA position-dependent effects on DNA interactions are in agreement with the mutation results, and provide new insight into PA-DNA interaction affinity. KA1055, which has the β targeting the least sensitive third bp of TGGCTT, displays comparable binding affinity to KA1002; while KA1007, which has the β targeting the most sensitive fourth bp of TGGCTT, shows much weaker binding than for KA1002. In summary, the different contributions of the base pairs in the targeting site cause distinct affinity reductions for the β substituted PA and different effects on binding affinities for the PA-bound DNA mutants.
SPR Binding Affinity and Kinetics
In an effort to better understand the energetic effects of incorporating a β in PA on DNA recognition, comprehensive kinetic studies were conducted with biosensor-surface plasmon resonance techniques. SPR results show that the PAs exhibit a wide range of equilibrium binding affinities with significant differences in their association and dissociation rates (Table 1). The unsubstituted parent eight-ring PA, KA1002, has the highest affinity and its association rates suggest a well-optimized shape for the minor groove. The very slow dissociation rates and large negative ΔH for binding indicate very efficient H-bond indexing with the cognate DNA sequence and a high energetic penalty required to break all of favorable interactions to release the compound from the groove. PAs, such as KA1002, have a number of conformations in solution due to single bond rotational possibilities about the amide bonds. They must, however, adopt only the single conformation with an appropriate crescent shape to match the minor groove structure in the DNA complex. In addition, they form numerous interactions with DNA that must be appropriately aligned in the complex. The rearrangement and alignment slow the association reaction but once formed, the complex can be exceptionally stable, as with KA1002, with a very slow dissociation reaction. The two β substituted PAs, KA1007 and KA1055, have much slower association rates than KA1002. This can be explained due to the increased flexibility of the β group and the increased number of conformations in solution that do not have a shape to match the DNA minor groove. To bind DNA requires additional time than for PAs with only heterocycles and will slow the kinetics of association.
The association rates for β substituted KA1007 and KA1055 are very similar but there is a significant difference in the first order dissociation rates. The N-terminal side β substituted KA1007 exhibits a faster dissociation rate whereas the C-terminal β substituted KA1055 has a slower dissociation rate than KA1002. The position of the β on affinity that was noted in the ΔTm results also has a strong effect on the dissociation rates. This is the first instance where the position of the β was also shown to have such a large effect on dissociation rates and affinities of PAs in the same binding site.
KA1039 is a six-heterocycle PA that is very similar to the eight-ring KA1002 but binds to a shorter sequence in the same DNA site. The reduction in the number of heterocycles in KA1039 not only decreases the binding affinity, as expected due to the decrease in the number of potential H-bonding moieties, but also reduces the association rate of KA1039 as the slowest among all four PAs. This result suggests that the smaller PA has a larger number of nonspecific binding orientations that effectively reduce its available concentration for binding and result in a slower association rate. Once bound, however, KA1039 forms strong H-bonds with a large negative ΔH for binding to the cognate DNA site and dissociates more slowly than KA1007. KA1039 has the same critical N-terminal Im-Im-Py sequence as the strong binders KA1002 and KA1055, and this accounts for its slower dissociation and stronger binding than KA1007.
All PAs in this study have relatively large molecular weights and very high binding constants but only a single charge (Figure 1). Therefore, the effect of electrostatic contributions on binding of them to DNA and the effects of salt concentrations on binding affinity are expected to be small under the experimental conditions used in this study.
Binding Thermodynamics
ITC experiments were not successful at the required concentrations (> 5 μM) for the larger PAs, presumably due to aggregation28, but have been conducted successfully for the six-ring KA1039. To our knowledge, there are no reports of calorimetric studies for eight-ring PAs in the literature, probably also due to aggregation effects at ITC concentrations. Breslauer and coworkers observed comparable ITC results to KA1039 for a different six-ring polyamide, ImImPy-γ-PyPyPy-β-Dp36 and although additional studies are needed, the similarity of the two results suggests that a large negative enthalpy is a common feature of PA-DNA complexes. For the eight-ring KA1002 and its β substituted analog KA1055, the SPR free energies are higher than for KA1039 which suggests that their binding affinities are also quite enthalpy dependent.
The full thermodynamic data for binding of KA1039 to the TGGCTT site is summarized in Figure 4. The SPR Gibbs free energy of KA1039-DNA complex formation changes very little at temperatures from 15 °C to 45 °C while the binding-induced enthalpy becomes remarkably more negative, more favorable for complex formation, as the temperature is increased. The calculated TΔS values also become more negative, less favorable for complex formation. Figure 4 shows that the binding of KA1039 is strongly enthalpy driven at temperatures below 25 °C and becomes entirely enthalpy driven above 25 °C. A large and negative ΔCp for KA1039 binding (−287 cal M−1 K−1) has been calculated from the slope of ΔH versus temperature. The favorable enthalpy and unfavorable entropy terms suggest that the interaction of KA1039 and DNA is largely driven by the H-bonding between them and little high entropy water, as is observed in the narrow A-tract minor grooves, has been released due to the relatively wide minor groove in TGGCTT. The thermodynamic profile is characteristic of biomolecular processes, such as protein folding, that are stabilized by numerous relative weak individual interactions that sum to a quite favorable net ΔG.
Minor groove geometry and overall DNA structure
Gel electrophoresis with ligation ladder assays is a well-established, sensitive method to evaluate the DNA overall curvature and the minor groove geometry through changes in DNA mobility. An A-tract (Figure 6A), narrows the minor groove and induces an intrinsically curved overall structure which displays anomalously slow mobilities in ligation ladder PAGE31, 34. Results with TGGCTT indicate that the overall structure is essentially straight and the minor groove of the TGGCTT site is relatively wide. This observation is consistent with previous studies that the minor groove is widened by the introduction of G/C base pairs37.
A relatively small amount of DNA bending has been observed by the binding of KA1002, KA1055 and KA1039 to the cognate DNA (Table 2). This bending can be either towards the major groove or the minor groove depending on the changes of local geometry of minor groove. In the literature, the dimer formation of a natural PA, distamycin, at an alternating AT site widens the minor groove and changes the DNA bending directionality from minor groove to major groove with a 15°~20° curvature38. Dervan and Chenoweth have shown that cyclic eight-ring PAs also widen the minor groove and compress the major groove with bending towards the major groove by around 20° upon minor groove targeting (PDB 3OMJ, Figure S12A)39, 40. It seems likely, therefore, that the hairpin PAs binding-induced bending in this study should be the consequence of an expanded minor groove with bending towards the major groove. The small bending angles indicate a relative small change in overall DNA structure as in ref. 41 (Figure S12B)41, and this evaluation agrees with the small DNA spectral changes in CD spectra with PA complexes (Figure 5).
Through the comparison of gel mobility and the binding-induced DNA bending angle for each polyamide complex, it is clear that the substitution of Py by β can influence the minor groove geometry in addition to its strong effect on the binding affinity and kinetics. The β substituted molecule KA1055 bends DNA slightly more than the parent KA1002, while KA1007, the other β substituted PA studied here, bends DNA less. This result suggests a poor minor groove interaction of KA1007 without a significant effect on the DNA conformation. KA1055, however, which has β adjacent to a different, more important DNA base position, has a significant effect on DNA structure. Interestingly, the binding of the six-ring PA, KA1039, affects the minor groove structure more than the larger PAs, resulting in the most curved DNA conformation described here. A possible cause of this large effect is that the six ring PA has a better fit to the DNA minor groove shape and is able to optimize affinity by inducing a larger conformational change in DNA. As PAs increase in size, they become too curved and rigid to match and alter the DNA minor groove shape42, 43 and this may account for the effects of the six-ring system. The structural effects of the number of heterocycles, however, need to be investigated in more detail with additional PAs. The observed binding-induced DNA conformational changes might allow KA1002, KA1055 and KA1039 to perform as allosteric modulators of DNA transcription in terms of compressing the major groove and reducing the binding affinity of major groove targeting transcription factors. Studies to evaluate this possibility are in progress.
In summary, the energetic and structural effects of positional substitution of Py by a β and reduction in the number of heterocycles on hairpin PA-DNA binding have been investigated in detail. Reduced binding affinity has been observed for all the modified PAs, KA1007, KA1055 and KA1039, relative to KA1002. It is very exciting, however, that the effects of DNA mutation on binding of a single PA as well as the effects of the position of β substitution on binding tell a very important story about PA-DNA complexes. It is clear that the heterocycles and β interact very differently with DNA bases in a minor groove, position-dependent manner. Comparison of mutant DNA sequences with KA1002 and KA1055 also shows a significantly different effect in recognition of T•A versus A•T base pairs. Clearly these differences need additional investigation with other PA sequences and DNAs and such studies are underway.
Supplementary Material
Acknowledgments
This work was supported by the National Institutes of Health NIAID (AI064200 to W.D.W), National Institutes of Health NIAID (AI083803 to J.K.B), NanoVir, LLC financial support (to J.K.B), and by a Georgia State University Molecular Basis of Disease Fellowship (to S.W). We thank the Danforth Plant Science Center for HRMS (NSF-DBI 0922879). We thank the NSF for a grant (CHE-0959360) to purchase the 600 MHz NMR used in this work. J.K.B. declares that he is part-owner of NanoVir, LLC.
Abbreviations
- PA
polyamide
- Tm
thermal melting
- SPR
biosensor-surface plasmon resonance
- ITC
isothermal titration calorimetry
- CD
circular dichroism
- PAGE
polyacrylamide gel electrophoresis
- bp
base pair
- β
β-alanine
Footnotes
Supporting figures (Figures S1–S12). This material is available free of charge via the Internet at http://pubs.acs.org.
References
- 1.Dervan PB. Molecular recognition of DNA by small molecules. Bioorg Med Chem. 2001;9:2215–2235. doi: 10.1016/s0968-0896(01)00262-0. [DOI] [PubMed] [Google Scholar]
- 2.Bando T, Sugiyama H. Synthesis and biological properties of sequence-specific DNA-alkylating pyrrole-imidazole polyamides. Acc Chem Res. 2006;39:935–944. doi: 10.1021/ar030287f. [DOI] [PubMed] [Google Scholar]
- 3.Suckling CJ. Molecular recognition and physicochemical properties in the discovery of selective antibacterial minor groove binders. J Phys Org Chem. 2008;21:575–583. [Google Scholar]
- 4.Lacy ER, Madsen EM, Lee M, Wilson WD. Polyamide dimer stacking in the DNA minor groove and recognition of TG mismatched base pairs in DNA. In: Demeunynck M, Bailly C, Wilson WD, editors. DNA and RNA Binders, From Small Molecules to Drugs. Vol. 1. WILEY-VCH Verlag GmbH & Co; KGaA, Weinheim: 2003. pp. 384–413. [Google Scholar]
- 5.Moretti R, Donato LJ, Brezinski ML, Stafford RL, Hoff H, Thorson JS, Dervan PB, Ansari AZ. Targeted chemical wedges reveal the role of allosteric DNA modulation in protein - DNA assembly. ACS Chem Biol. 2008;3:220–229. doi: 10.1021/cb700258r. [DOI] [PMC free article] [PubMed] [Google Scholar]
- 6.Chaires JB. Allostery: DNA does it, too. ACS Chem Biol. 2008;3:207–209. doi: 10.1021/cb800070s. [DOI] [PubMed] [Google Scholar]
- 7.Matsuda H, Fukuda N, Ueno T, Katakawa M, Wang X, Watanabe T, Matsui S, Aoyama T, Saito K, Bando T, Matsumoto Y, Nagase H, Matsumoto K, Sugiyama H. Transcriptional inhibition of progressive renal disease by gene silencing pyrrole-imidazole polyamide targeting of the transforming growth factor-[beta]1 promoter. Kidney Int. 2011;79:46–56. doi: 10.1038/ki.2010.330. [DOI] [PubMed] [Google Scholar]
- 8.Edwards TG, Koeller KJ, Slomczynska U, Fok K, Helmus M, Bashkin JK, Fisher C. HPV episome levels are potently decreased by pyrrole-imidazole polyamides. Antiviral Res. 2011;91:177–186. doi: 10.1016/j.antiviral.2011.05.014. [DOI] [PMC free article] [PubMed] [Google Scholar]
- 9.Franks A, Tronrud C, Kiakos K, Kluza J, Munde M, Brown T, Mackay H, Wilson WD, Hochhauser D, Hartley JA, Lee M. Targeting the ICB2 site of the topoisomerase II alpha promoter with a formamido-pyrrole-imidazole-pyrrole H-pin polyamide. Bioorg Med Chem. 2010;18:5553–5561. doi: 10.1016/j.bmc.2010.06.041. [DOI] [PubMed] [Google Scholar]
- 10.Raskatov JA, Meier JL, Puckett JW, Yang F, Ramakrishnan P, Dervan PB. Modulation of NF-kappa B-dependent gene transcription using programmable DNA minor groove binders. Proc Natl Acad Sci U S A. 2012;109:1023–1028. doi: 10.1073/pnas.1118506109. [DOI] [PMC free article] [PubMed] [Google Scholar]
- 11.Wang X, Nagase H, Watanabe T, Nobusue H, Suzuki T, Asami Y, Shinojima Y, Kawashima H, Takagi K, Mishra R, Igarashi J, Kimura M, Takayama T, Fukuda N, Sugiyama H. Inhibition of MMP-9 transcription and suppression of tumor metastasis by pyrrole-imidazole polyamide. Cancer Sci. 2010;101:759–766. doi: 10.1111/j.1349-7006.2009.01435.x. [DOI] [PMC free article] [PubMed] [Google Scholar]
- 12.Raskatov JA, Hargrove AE, So AY, Dervan PB. Pharmacokinetics of Py-Im polyamides depend on architecture: Cyclic versus linear. J Am Chem Soc. 2012;134:7995–7999. doi: 10.1021/ja302588v. [DOI] [PMC free article] [PubMed] [Google Scholar]
- 13.Kamei T, Aoyama T, Tanaka C, Nagashima T, Aoyama Y, Hayashi H, Nagase H, Ueno T, Fukuda N, Matsumoto Y. Quantitation of pyrrole-imidazole polyamide in rat plasma by high-performance liquid chromatography coupled with UV detection. J Biomed Biotechnol. 2012 doi: 10.1155/2012/715928. [DOI] [PMC free article] [PubMed] [Google Scholar]
- 14.Wang CCC, Ellervik U, Dervan PB. Expanding the recognition of the minor groove of DNA by incorporation of beta-alanine in hairpin polyamides. Bioorg Med Chem. 2001;9:653–657. doi: 10.1016/s0968-0896(00)00282-0. [DOI] [PubMed] [Google Scholar]
- 15.Urbach AR, Love JJ, Ross SA, Dervan PB. Structure of a beta-alanine-linked polyamide bound to a full helical turn of purine tract DNA in the 1:1 motif. J Mol Biol. 2002;320:55–71. doi: 10.1016/S0022-2836(02)00430-8. [DOI] [PubMed] [Google Scholar]
- 16.Fukuda N, Ueno T, Tahira Y, Ayame H, Zhang W, Bando T, Sugiyama H, Saito S, Matsumoto K, Mugishima H, Serie K. Development of gene silencing pyrrole-imidazole polyamide targeting the TGF-beta 1 promoter for treatment of progressive renal diseases. J Am Soc Nephrol. 2006;17:422–432. doi: 10.1681/ASN.2005060650. [DOI] [PubMed] [Google Scholar]
- 17.Bashkin JK, Aston K, Ramos JP, Koeller KJ, Nanjunda R, He G, Dupureur CM, Wilson WD. Promoter scanning of the Human COX-2 gene with 8-ring polyamides: Unexpected weakening of polyamide-DNA binding and selecticity by replacing an internal N-Me-pyrrole with β-alanine. Biochimie. 2012 doi: 10.1016/j.biochi.2012.09.023. In Press. [DOI] [PMC free article] [PubMed] [Google Scholar]
- 18.Dupureur CM, Bashkin JK, Aston K, Koeller KJ, Gaston KR, He G. Fluorescence assay of polyamide-DNA interactions. Anal Biochem. 2012;423:178–183. doi: 10.1016/j.ab.2012.01.017. [DOI] [PMC free article] [PubMed] [Google Scholar]
- 19.Nanjunda R, Munde M, Liu Y, Wilson WD. Real-time monitoring of nucleic acid interactions with biosensor-surface plasmon resonance. In: Wanunu M, Tor Y, editors. Methods for Studying Nucleic Acid/Drug Interactions. CRC Press; Boca Raton: 2011. pp. 91–122. [Google Scholar]
- 20.Davis TM, Wilson WD. Determination of the refractive index increments of small molecules for correction of surface plasmon resonance data. Anal Biochem. 2000;284:348–353. doi: 10.1006/abio.2000.4726. [DOI] [PubMed] [Google Scholar]
- 21.Morton TA, Myszka DG. Kinetic analysis of macromolecular interactions using surface plasmon resonance biosensors. Methods Enzymol. 1998;295:268–294. doi: 10.1016/s0076-6879(98)95044-3. [DOI] [PubMed] [Google Scholar]
- 22.Karlsson R. Affinity analysis of non-steady-state data obtained under mass transport limited conditions using BIAcore technology. J Mol Recognit. 1999;12:285–292. doi: 10.1002/(SICI)1099-1352(199909/10)12:5<285::AID-JMR469>3.0.CO;2-Y. [DOI] [PubMed] [Google Scholar]
- 23.Wilson WD, Tanious TA, Fernandez-Saiz M, Rigl CT. Evaluation of drug-nucleic acid interactions by thermal melting curves. Methods Mol Biol. 1997;90:219–240. doi: 10.1385/0-89603-447-X:219. [DOI] [PubMed] [Google Scholar]
- 24.Mazur S, Tanious FA, Ding D, Kumar A, Boykin DW, Simpson IJ, Neidle S, Wilson WD. A thermodynamic and structural analysis of DNA minor-groove complex formation. J Mol Biol. 2000;300:321–337. doi: 10.1006/jmbi.2000.3869. [DOI] [PubMed] [Google Scholar]
- 25.Wang L, Kumar A, Boykin DW, Bailly C, Wilson WD. Comparative thermodynamics for monomer and dimer sequence-dependent binding of a heterocyclic dication in the DNA minor groove. J Mol Biol. 2002;317:361–374. doi: 10.1006/jmbi.2002.5433. [DOI] [PubMed] [Google Scholar]
- 26.Ren JS, Jenkins TC, Chaires JB. Energetics of DNA intercalation reactions. Biochemistry. 2000;39:8439–8447. doi: 10.1021/bi000474a. [DOI] [PubMed] [Google Scholar]
- 27.Liu Y, Kumar A, Depauw S, Nhili R, David-Cordonnier MH, Lee MP, Ismail MA, Farahat AA, Say M, Chackal-Catoen S, Batista-Parra A, Neidle S, Boykin DW, Wilson WD. Water-mediated binding of agents that target the DNA minor groove. J Am Chem Soc. 2011;133:10171–10183. doi: 10.1021/ja202006u. [DOI] [PMC free article] [PubMed] [Google Scholar]
- 28.Hargrove AE, Raskatov JA, Meier JL, Montgomery DC, Dervan PB. Characterization and solubilization of pyrrole-Imidazole polyamide aggregates. J Med Chem. 2012;55:5425–5432. doi: 10.1021/jm300380a. [DOI] [PMC free article] [PubMed] [Google Scholar]
- 29.Rodger A, Norden B. Circular Dichroism and Linear Dichroism. Oxford University Press; New York: 1997. [Google Scholar]
- 30.Lyng R, Rodger A, Norden B. The CD of ligand-DNA systems. 2 Poly (dA-dT) B-DNA. Biopolymers. 1992;32:1201–1214. doi: 10.1002/bip.360320910. [DOI] [PubMed] [Google Scholar]
- 31.Tevis DS, Kumar A, Stephens CE, Boykin DW, Wilson WD. Large, sequence-dependent effects on DNA conformation by minor groove binding compounds. Nucleic Acids Res. 2009;37:5550–5558. doi: 10.1093/nar/gkp558. [DOI] [PMC free article] [PubMed] [Google Scholar]
- 32.Hunt RA, Munde M, Kumar A, Ismail MA, Farahat AA, Arafa RK, Say M, Batista-Parra A, Tevis D, Boykin DW, Wilson WD. Induced topological changes in DNA complexes: Influence of DNA sequences and small molecule structures. Nucleic Acids Res. 2011;39:4265–4274. doi: 10.1093/nar/gkq1362. [DOI] [PMC free article] [PubMed] [Google Scholar]
- 33.Ross ED, Den RB, Hardwidge PR, Maher LJ. Improved quantitation of DNA curvature using ligation ladders. Nucleic Acids Res. 1999;27:4135–4142. doi: 10.1093/nar/27.21.4135. [DOI] [PMC free article] [PubMed] [Google Scholar]
- 34.Crothers DM, Drak J. Global features of DNA-structure by comparative gel-electrophoresis. Methods Enzymol. 1992;212:46–71. doi: 10.1016/0076-6879(92)12005-b. [DOI] [PubMed] [Google Scholar]
- 35.Oyoshi T, Kawakami W, Narita A, Bando T, Sugiyama H. Inhibition of transcription at a coding sequence by alkylating polyamide. J Am Chem Soc. 2003;125:4752–4754. doi: 10.1021/ja029196o. [DOI] [PubMed] [Google Scholar]
- 36.Pilch DS, Poklar N, Baird EE, Dervan PB, Breslauer KJ. The thermodynamics of polyamide-DNA recognition: Hairpin polyamide binding in the minor groove of duplex DNA. Biochemistry. 1999;38:2143–2151. doi: 10.1021/bi982628g. [DOI] [PubMed] [Google Scholar]
- 37.Wemmer DE, Geierstanger BH, Fagan PA, Dwyer TJ, Jacobsen JP, Pelton JG, Ball GE, Leheny AR, Chang W-H, Bathini Y, Lown JW, Rentzeperis D, Marky LA, Singh S, Kollman P. Minor groove recognition of DNA by distamycin and its analogs. In: Sarma RH, Sarma MH, editors. Structural Biology: The state of the art. Vol. 2. Adenine Press; New York: 1994. pp. 301–323. [Google Scholar]
- 38.Wang S, Munde M, Wang S, Wilson WD. Minor groove to major groove, an unusual DNA sequence-dependent change in bend directionality by a distamycin dimer. Biochemistry. 2011;50:7674–7683. doi: 10.1021/bi201010g. [DOI] [PMC free article] [PubMed] [Google Scholar]
- 39.Chenoweth DM, Dervan PB. Structural basis for cyclic Py-Im polyamide allosteric inhibition of nuclear receptor binding. J Am Chem Soc. 2010;132:14521–14529. doi: 10.1021/ja105068b. [DOI] [PMC free article] [PubMed] [Google Scholar]
- 40.Chenoweth DM, Dervan PB. Allosteric modulation of DNA by small molecules. Proc Natl Acad Sci U S A. 2009;106:13175–13179. doi: 10.1073/pnas.0906532106. [DOI] [PMC free article] [PubMed] [Google Scholar]
- 41.Wang Y, Ma N, Wang Y, Chen G. Allosteric analysis of Glucocorticoid Receptor-DNA interface induced by cyclic Py-Im polyamide: A molecular dynamics simulation stuty. PLoS One. 2012;7:e35159. doi: 10.1371/journal.pone.0035159. [DOI] [PMC free article] [PubMed] [Google Scholar]
- 42.Kelly JJ, Baird EE, Dervan PB. Binding site size limit of the 2:1 pyrrole-imidazole polyamide-DNA motif. Proc Natl Acad Sci U S A. 1996;93:6981–6985. doi: 10.1073/pnas.93.14.6981. [DOI] [PMC free article] [PubMed] [Google Scholar]
- 43.Turner JM, Swalley SE, Baird EE, Dervan PB. Aliphatic/aromatic amino acid pairings for polyamide recognition in the minor groove of DNA. J Am Chem Soc. 1998;120:6219–6226. [Google Scholar]
Associated Data
This section collects any data citations, data availability statements, or supplementary materials included in this article.