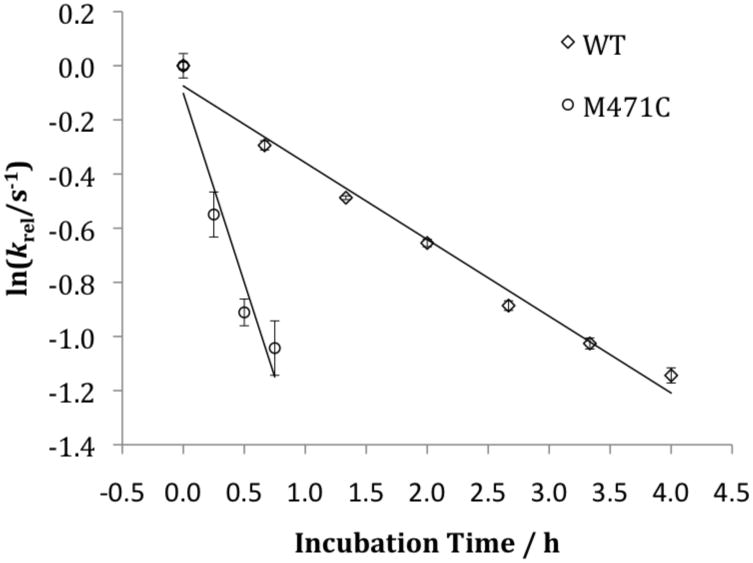
Figure 3.
Plot of ln(kobs) versus incubation time. For these assays Met471Cys or WT TβM was incubated at 23 °C with 100 mM KPi, pH 6.0, 100 mM KCl, 50 mM ascorbate, and 100 μg/mL catalase (no tyramine) for 0, 40, 80, 120, 160, 200, 240 min before addition of 1 mM tyramine. After the incubation time was complete, end-point assays were executed at 35 °C and product versus time curves generated in order to determine a kobs as a function of incubation time.

