

Abstract
Bacterioferritin (Bfr) is a spherical protein composed of 24 subunits and 12 heme molecules. Bfrs contribute to regulate iron homeostasis in bacteria by capturing soluble but potentially toxic Fe2+ and by compartmentalizing it in the form of a bioavailable ferric mineral inside the protein’s hollow cavity. When iron is needed, Fe3+ is reduced and mobilized into the cytosol as Fe2+. Hence, key to the function of Bfr is its ability to permeate iron ions in and out of its interior cavity, which is likely imparted by a flexible protein shell. To examine the conformational flexibility of Bfrs in a native-like environment and the way in which the protein shell interacts with monovalent cations, we have performed molecular dynamics (MD) simulations of BfrB from Pseudomonas aeruginosa (Pa BfrB) in K2HPO4 solutions at different ionic strengths. The results indicate the presence of coupled thermal fluctuations (dynamics) in the 4-fold and B-pores of the protein, which is key to enable passage of monovalent cations through the protein shell using B-pores as conduits. The MD simulations also show that Pa BfrB ferroxidase centers are highly dynamic and permanently populated by transient cations exchanging with other cations in the interior cavity, as well as the solution bathing the protein. Taken together, the findings suggest that Fe2+ traffic across the Pa BfrB shell via B-pores and that the ferroxidase pores enable capture and oxidation of Fe2+, followed by translocation of Fe3+ to the interior cavity, aided by the conformationally active H130.
Keywords: Ferritin, iron homeostasis, Pseudomonas aeruginosa, molecular dynamics
Iron is the fourth most abundant metal on Earth and an indispensable cofactor in the active sites of proteins and enzymes, where it functions as an integral component of physiological processes such as respiration, DNA synthesis, gene regulation, degradation of peroxides and superoxides, oxygen transport and oxygen activation, and degradation of xenobiotics (1). Fe2+ is soluble (~ 0.1 M at pH 7.0) but readily oxidized by molecular oxygen to the Fe3+ form, which is extremely insoluble (~10−18 M at pH 7.0) (1, 2). The oxidation of Fe2+ by O2 generates hydrogen peroxide, which is also a byproduct of aerobic respiration; Fe3+ can be reduced to Fe2+ by reducing agents in the cell and rapidly react with hydrogen peroxide to produce Fe3+ and the hydroxyl radical, thus creating a cycle conducive to the formation of the highly reactive ·OH which indiscriminately attacks biological molecules (2, 3). Thus, the potential toxicity of Fe2+ and the insolubility of Fe3+ pose enormous challenges to living cells. These challenges have been largely ameliorated by evolution of the ferritins and ferritin-like molecules, which specialize in the handling and storage of iron. These molecules function by oxidizing the soluble but potentially toxic Fe2+ using O2 or H2O2 as electron acceptors and by storing the otherwise insoluble Fe3+ in the form of a mineral in a compartment (internal cavity) that is isolated from cellular processes. When necessary, iron stored in the internal cavities of ferritin-like molecules can be reduced, mobilized from the interior cavity and incorporated into cellular processes (1).
The crucial contribution of ferritin-like molecules to iron metabolism is evident in their presence in all three domains of life with remarkable conservation of structure in spite of very low conservation in sequence (4). Three types of ferritin-like molecules are found in bacteria, bacterioferritin (Bfr), ferritin (Ftn), and DNA binding proteins from starved cells (Dps) (1). Bfrs and Ftns are spherical proteins composed of 24 subunits that encase a hollow cavity of approximately 80 Å in diameter where the iron mineral is stored. Dps are also spherical proteins but are composed of 12 subunits encasing a hollow cavity approximately 45 Å in diameter. Structures of Bfr from several organisms (5–11) reveal that the canonical fold of a Bfr subunit (Figure 1A) is composed of a four-helix bundle (helices A to D) and a short C-terminal helix E nearly perpendicular to the bundle. Each subunit harbors a ferroxidase center in which a di-Fe2+ moiety is oxidized to a di-Fe3+ species, prior to their storage as an iron mineral in the Bfr interior cavity. A unique property of the Bfrs, which only occur in archaea and in bacteria (4), is that they bind heme between two subunits (subunit-dimer) (Figure 1B) such that the 24-mer protein consists of 12 subunit dimers and 12 heme molecules.
Figure 1.

The bacterioferritin architecture. (A) View of a Pa BfrB subunit illustrating the ferroxidase center (green) and the ferroxidase pore (pink), which enables access of iron from the protein exterior to the ferroxidase center; heme is in black, K+ in the 4-fold pore and in the 3-fold pore are shown as magenta and cyan spheres, respectively. (B) Subunit dimer showing heme coordinated axially by a M52 from each subunit. (C) View along a 3-fold symmetry axis depicting a 3-fold pore and a phosphate ion. (D) View along a 4-fold symmetry axis illustrating a 4-fold pore and the associated K+ ion. Each 4-fold pore is surrounded by 4 B-pores, highlighted by red squares. (E) The electrostatic potential mapped on the interior surface of Pa BfrB. Four front subunits were removed for a clear view of the internal cavity. (F) The electrostatic potential mapped on the exterior surface of a Pa BfrB with the same orientation as in (E). Negative electrostatic potential is in red, positive electrostatic potential is in blue, and the unit is kcal/(mol·e). The figures were produced using the molecular visualization program PyMOL (37).
The protein shells of ferritin-like molecules function similar to cell membranes in that they separate the iron mineral from the cytosol. Four types of pores are thought to communicate the interior cavity of a 24-mer assembly with the exterior milieu: eight 3-fold pores (Figure 1C), six 4-fold pores (Figure 1D), a ferroxidase pore in each subunit (Figure 1A) and four B-pores located near each of the 4-fold pores (Figure 1D) (11). Notably, the surface lining the interior cavity (interior surface) of Bfrs exhibits a very large negative potential (Figure 1E) (6, 11), whereas the surface of the protein exposed to the protein exterior (exterior surface) shows less pronounced positive and negative electrostatic potentials (Figure 1F).
Structural studies showed that the 3-fold pores of eukaryotic ferritins are lined with conserved negatively charged residues. Substitution of these conserved residues caused decreased rates of iron uptake, leading to the suggestions that Fe2+ ions may traffic in and out of eukaryotic ferritins via 3-fold pores (12–15). In comparison, the function of the 3-fold pores in the Bfrs, which are lined by layers of alternating positive and negative charge, is much less clear. Sulfate and phosphate ions have been observed in 3-fold pores in the crystal structures of Pseudomonas aeruginosa BfrB (Pa BfrB) (16), Pa FtnA (17) and Desulfovibrio desulfuricans Bfr (Dd Bfr) (18), suggesting that in the Bfrs and bacterial Ftns the 3-fold pores may be conduits for anion traffic across the 24-mer shell. The 4-fold pores of Bfrs and bacterial Ftns are also structurally different from those of eukaryotic ferritins. The 4-fold pores in eukaryotic ferritins are lined by hydrophobic residues and are narrower than the 3-fold pores. In agreement, substantial barriers for the entry of Fe2+ and Na+ ions into eukaryotic ferritin 4-fold pores have been calculated (19). In contrast, the 4-fold pores of Bfrs typically contain hydrophilic residues and in some instances are observed to bind monovalent and divalent cations in X-ray crystal structures. The presence of these positively charged ions in the 4-fold pores of Bfrs has led to the hypothesis that these channels may serve as conduits for the traffic of Fe2+ in and out of the Bfr shell (16, 20, 21). The protein shells of bacterial ferritins (Bfr and Ftn) also have channels at the intersection of three subunits, not aligned with any axis of symmetry in the structure. These channels have been termed B-pores (18). In all known Bfr structures the B-pores are lined by hydrophilic residues and have a relatively large number of negatively charged residues. Mg2+ ions coordinated by water molecules have been observed within the B-pores of Azotobacter vinelandii (Av) (21) and Mycobacterium smegmatis (Ms) Bfrs (5). A more recent structure of Pa BfrB in complex with its cognate electron donor partner, Pa ferredoxin (Bfd), shows Na+ ions in the B-pores, where they are coordinated by three negatively charged residues lining the narrowest section of the pores (22). Although the function of the B-pores is unknown, it has been noted that B-pores are sufficiently large to accommodate a Fe2+ ion, thus suggesting that B-pores may function to facilitate trafficking of iron in and out of Bfrs and bacterial Ftns.
Clearly, the different pores in the ferritin structure are likely important to the dual function of iron uptake and release exhibited by ferritins and ferritin-like molecules. However, current understanding of how the pores enable these functions is limited. Although the perception of ferritin-like molecules has evolved from that of a rigid cage to that of a dynamic supramolecular assembly, virtually nothing is known about their dynamic properties, and how dynamics enable their function. In an attempt to bridge these gaps, to the best of our knowledge, we report the first molecular dynamics (MD) simulation study of the 24-mer Pa BfrB. Results from these MD simulations reveal that significant cooperative dynamics at 4-fold pores and B pores are linked to the traffic of K+ ions across the protein shell, using B-pores as conduits. Moreover, the simulations show highly dynamic ferroxidase centers permanently populated by transient K+ ions, which can access the centers from the interior cavity as well as from the protein exterior. The traffic and distribution of K+ observed during the simulations is discussed in the context of iron uptake and release from the Bfrs.
MATERIALS AND METHODS
Constructing the Pa BfrB system
The Pa BfrB structure used in the simulations (PDB:3ISF) (6) was retrieved using the PDB Reader module in CHARMM-GUI (www.charmm-gui.org) (23). The terminal residues including M1, D157, and D158 were missing in some of the Pa BfrB subunits. These residues were added using the IC BUILD command in CHARMM (24) and were patched with acetylated N-termini and N-methylamide C-termini, respectively. Since the MD simulations of Pa BfrB were carried out in K2HPO4 solution (see below), ions were added in the 3-fold pores in place of the ions found in the crystal structure of the iron-soaked Pa BfrB structure (PDB:3IS8) (6); this structure was not used in the simulations because it was obtained from Pa BfrB containing ~600 iron atoms inside the central cavity (6). Hence, the structure used in the simulations consists of a protein shell made of 24 Pa BfrB subunits, 12 heme molecules, K+ in each of the six 4-fold pores, and in each of the eight 3-fold pores (Figure 1A–D).
Estimating initial ion positions from GCMC/BD simulations
Having a proper starting system configuration for a MD simulation is extremely important. In the case of Pa BfrB, how to place the ions to initialize the MD simulations is the key issue, because Pa BfrB has a net negative charge of +378 and an uncorrelated system could take a long time to equilibrate. Under such a scenario, randomly placing the ions through out a Pa BfrB may not be an optimal option. Therefore, GCMC/BD simulations were employed to generate the initial ion positions that follow the electrochemical potential in the system for the subsequent MD simulations.
The structure of Pa BfrB was centered in the origin of a cubic simulation box with 160 Å on each side. The vectors connecting two 4-fold pores on the opposite sides of the protein shell were aligned with the X-, Y-, and Z-axis. The CHARMM-GUI GCMC/BD ion simulator module (25) was employed to calculate the grid-based potential maps for the grand canonical Monte Carlo/Brownian dynamics (GCMC/BD) simulations. The grid spacing was set to 0.5 Å. To account for the influence of different protein dielectric constants (εp) on the electrostatic potential, a series of εp (εp = 2, 4, 10, 20, and 40) were used in the calculations, resulting in five sets of potential maps. They were denoted by E2, E4, E10, E20, and E40. Each set contains the electrostatic potential φsf, the reaction field potential φrf, and the core-repulsive steric potential Ucore. From these, a space dependent multi-ion potential of mean force,
 ({ri}), can be evaluated by
| (1) |
where ri is the position of the ith ion and Uij denotes the pair-wise ion-ion interactions (26).
({ri}) was used to guide the GCMC/BD simulations following the BD equation of motion (27, 28),
| (2) |
with Di and ζ(t) representing the diffusion constant of the ith ion and the stochastic water bombardment on ions.
Five GCMC/BD simulations (GCMC/BD_E2-E40) with 30,000 steps each were performed using the last step input file from the GCMC/BD ion simulator module (25). The positions of the protein atoms, heme molecules, and crystal ions in the pores were fixed. In each simulation K+ and Cl− were added to the system from the GCMC buffer region equivalent in size to the simulation box and distributed by the subsequent BD simulations. K+ instead of Fe2+ were used as the cation species in the GCMC/BD and the following MD simulations because of (i) the accessibility of accurate force field parameters for K+ but not for Fe2+ and (ii) the similarity of K+ and Fe2+ in that they are both soluble cations. The anion in the GCMC/BD simulations is Cl−, which is different from the present in the MD simulations. This is because there are no accurate Lennard-Jones and short-range ion-ion interaction parameters for K2HPO4 available in GCMC/BD, but those parameters for KCl are well established and frequently used (25, 26). The total number of ions after each cycle was plotted for each system (Figure S1 in Supporting Information). A snapshot of ion positions was selected after the ion number in each system reached a plateau value. To generate the initial ion configuration for the MD simulation systems, half of the Cl− were randomly chosen and discarded, and the other half was replaced with to keep the total negative charge constant. Table 1 shows the number of ions in each system. Clearly, the resulting number of ions is strongly dependent on εp and increases with decreasing εp. Instead of choosing a particular εp, all systems with different εp are considered in this study to reflect the different ionic strengths.
Table 1.
Numbers of K+ (NK-total), (Nphos-total), cavity K+ (NK-cavity), cavity (Nphos-cavity), water molecules (Nwater), and total atoms (Natom-total) in the MD simulations systems.
| NK-total | Nphos-total | NK-cavity | Nphos-cavity | Nwater | Natom-total | |
|---|---|---|---|---|---|---|
| E2 | 2,840 | 1,231 | 1,430 | 0 | 110,172 | 404,112 |
| E4 | 1,800 | 711 | 918 | 1 | 112,343 | 406,465 |
| E10 | 1,042 | 332 | 512 | 1 | 113,992 | 408,380 |
| E20 | 788 | 205 | 334 | 2 | 114,487 | 408,849 |
| E40 | 714 | 168 | 246 | 3 | 114,478 | 408,526 |
MD simulations of Pa BfrB in K2HPO4 solution
In the preparation of the all-atom MD simulations, each of the five resulting systems from the GCMC/BD simulations (MD_E2-E40) was immersed in a pre-equilibrated water box of the same size as in the GCMC/BD systems (160 × 160 × 160 Å3). Water molecules within 2.4 Å from the ions and the Pa BfrB heavy atoms were removed. The systems were then subjected to a 210-ps equilibration cycle with decreased positional harmonic restraints on heavy atoms excluding water oxygen. During the equilibration process some water molecules infiltrated the Pa BfrB shell, creating vacuum pockets in the K2HPO4 solution inside and outside Pa BfrB. Therefore, the water molecules in the systems were removed after the first cycle of equilibration followed by addition of water in the manner described above except that 2.0 Å was used as a distance cutoff instead of 2.4 Å, and a second cycle of 780-ps equilibration was conducted. At the end of this cycle, small vacuum regions were still observed, but only in the central cavity. Therefore, a sphere of pre-equilibrated water with a radius of 40 Å was appended, and newly added water molecules within 2.4 Å of any heavy atoms in the system were deleted. The whole system was then equilibrated without restraints for 20 ps, and was followed by a 40-ns production. The system information is summarized in Table 1.
All the simulations were carried out in NPT ensembles using NAMD2.8 (29) with the CHARMM all-atom parameter set PARAM22 (30) including the dihedral cross-term corrections (CMAP) (31) and a modified TIP3P water model (32). The van der Waals interactions were smoothly switched off at 10–12 Å by a force switching function (33) and the electrostatic interactions were calculated using the particle-mesh Ewald method with a mesh size of ~1 Å. The temperature (300 K) and pressure (1 atm) were kept constant during all the simulations by Langevin dynamics and the hybrid Nose-Hoover Langevin piston method, respectively. The Langevin damping coefficient was set to 1 ps−1; the decay period and damping timescale were 50 fs and 25 fs, respectively.
Principal Component Analysis
Principal component analysis (PCA) was performed to investigate the intrinsic dynamics of the Pa BfrB monomers and the assembly. Prior to calculating the covariance matrix for PCA, we superimposed all the Pa BfrB structures to the starting structure to remove the protein’s translation and rotation during the simulations. For each of the Pa BfrB monomers, the coordinates of all the Cα atoms (R) were recorded at each trajectory snapshot,
| (3) |
where r3n−2,t, r3n−1,t, and r3n,t represent the X, Y, Z-coordinates of the nth Cα atom at time t, and N (N = 158) is the total number of Cα atoms in a subunit. Using R, a covariance matrix (Σ) can be constructed, where the covariance of ri and rj, cov time points is defined by
| (4) |
where the covariance of ri and rj, cov (ri, rj), over a total of T time points is defined by
| (5) |
and and are the time averages of all the ri,t and rj,t respectively. The eigenvalues and eigenvectors of the matrix Σ were computed. The eigenvector corresponding to the largest eigenvalue was then recorded and grouped into three groups for each Cα atom. The vector formed by these three values gives the principal direction of motion of a specific Cα.
The calculation of the principal motional modes of the entire Pa BfrB assembly is rooted on the same concept. Rather than using the coordinates of all the Cα atoms in the assembly, the center of mass coordinates of helical fragments were used. To distinguish motions occurring in different portions on helices A to D, each of them was divided into three fragments with each one containing approximately 10 residues. Helix E contains only six residues and thus the entire helix was used. The center of mass coordinates of these helical fragments were recorded and used to construct the R matrix with N = 13. The rest of the calculation follows the description given above.
RESULTS AND DISCUSSION
Structure stability and dynamics of Pa BfrB
The calculated backbone root-mean-squared deviation (RMSD) of Pa BfrB bathed in K2HPO4 solution indicates that the protein is stable during the simulations (Table S1 in Supporting Information). Even the systems with most flexibility (E2 and E4) show RMSD values well under 4.0 Å. The greater RMSD in these systems likely stems from enhanced flexibility in specific regions of a Pa BfrB subunit, as can be seen in the per-residue RMS fluctuations (RMSF) in Figure 2A–C. Nonetheless, the characteristic 432-point symmetry of the Bfr assembly is preserved during the simulations, which is a strong indicator that the integrity of the Pa BfrB structure is well maintained.
Figure 2.

Intrinsic flexibility in Pa BfrB. The per-residue RMSF observed in system MD_E2 mapped onto a subunit viewed from the (A) interior and (C) exterior surface of Pa BfrB. Flexibility increases in the color scale from white to red. (B) Per-residue RMSF in a subunit of Pa BfrB plotted for systems MD_E2 (red), E4 (green), E10 (blue), E20 (magenta), and E40 (cyan). Per-residue B factors from the X-ray structure (PDB:3ISF) are shown in the black trace; helices A to E are indicated as boxes and ferroxidase center residues are highlighted in green. (D) Per-residue RMSF mapped on six subunits of the 24-mer assembly show relatively large dynamic behavior near 4-fold and B-pores, and considerable less dynamic activity near 3-fold pores. To facilitate visualization, the pores are highlighted by black (B-), green (3-fold) and blue (4-fold) stars. (E) Principal motional mode of Cα atoms on helices B and D (blue) in subunit H in MD_E40 shown by arrows. (F) The principal motional mode of six subunits of the 24-mer assembly shown in the same orientation as in (D). The helices were segmented into 10-residue pieces and the motions were calculated based on the centers of mass of these structural segments. The arrows (red) indicate the directions of motion. Subunits exhibiting overall motion along and perpendicular to the assembly plane are colored white and cyan, respectively.
A per-residue RMSF plot (Figure 2B) illustrates the relative fluctuations in a Pa BfrB subunit for each of the MD systems (E2, E4, E10, E20, and E40). In addition to the N- and C-termini, it is apparent that specific regions of a subunit are significantly more dynamic than average. The relative extent of per-residue RMSF mapped onto a BfrB subunit is shown in Figure 2A and C with white representing the lowest propensity and red the highest propensity to fluctuate. In addition to the N- and C-termini, the long loop connecting helices B and C (BC loop) and the C-terminus of helix D exhibit the highest tendency to fluctuate, followed by the C-terminal half of helix D, and by the N-terminal half of helix C. The sections with higher than average flexibility also exhibit higher B-factors than the rest of the subunit in the Pa BfrB crystal structure (black trace in Figure 2B). It is also interesting that the mobility of these regions increases with the increase of K2HPO4 concentration (Figure 2B). Nevertheless, analyses of the principal motional modes of Cα atoms reveal absence of correlated motions within each of the helices and among different helices in a subunit (Figure 2E).
Although no clear functional implications can be derived from fluctuations within an individual subunit, their significance emerges in the context of the 24-mer assembly. This is illustrated in Figure 2D by a minimal assembly of six Pa BfrB subunits containing a 3-fold pore (green star), a 4-fold pore (blue star), and a B-pore (black star). Clearly, the regions that exhibit increased mobility in each of the subunits constitute the pores in the Bfr structure. This is particularly evident in the area surrounding the 4-fold pores, including the B-pores. In comparison, the regions comprising the 3-fold pores have much less dynamical activity. These observations suggest that while the less mobile sections of a Pa BfrB subunit may be important to maintain the structural integrity of the four-helix bundle and the 24-mer assembly, the fluctuations of high mobility residues impart the dynamic behavior to the pores in the Bfr shell. This aspect is further elaborated below after some salient points regarding each of the pores have been addressed. In addition to the fluctuation of residues near the pores, neighboring subunits can also adjust their orientations relative to one another, effectively creating breathing motions in the 24-mer protein. Figure 2F illustrates the principal motional modes of subunits within the minimal Pa BfrB assembly that includes each of the 3-fold, 4-fold and B-pores. Motions of subunits that are in immediate vicinity are usually coupled (share similar directionality), although in some cases adjacent subunits may move in orthogonal directions.
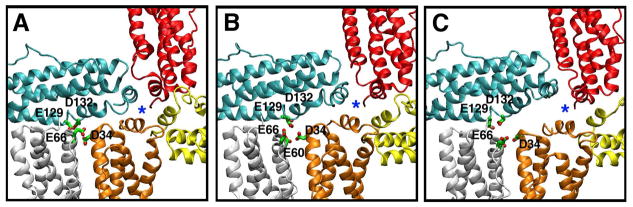
The 3-fold, 4-fold, and B-pore conformations are mostly maintained during the simulations. As shown in Figure 3A, the 3-fold pore is lined by three subunits; specifically, the C-terminus of helix C forms the outermost layer of the pore, while the N-terminus of helix D forms the innermost layer. Near its narrowest section, there is a replacing the observed in the crystal structure (see Materials and Methods). During the course of the simulations, the is always coordinated by the side chains of R117 and K121 (Figure 3A) and does not exit the 3-fold pores. As shown in Figure 3B, a 4-fold pore is formed by four E-helices adopting an orientation that is more or less parallel to the pore axis. The BfrB crystal structure contains a K+ ion in each 4-fold pore where it is coordinated by the side chains of N148 and Q151. During the simulations many of these K+ stay inside the 4-fold pores as in the crystal structure (Figure 3B). In some cases, however, K+ ions exit the pore. When this happens, the side chains of N148 and Q151 in E-helices located on opposite sides of the pore interact, leading to temporary obstruction of the 4-fold pore. Unlike 3-fold or 4-fold pores, B-pores are not at a crystallographic axis of symmetry. As shown in Figure 3C, the side chains of D34, E60, E66, D132, and E129 in BfrB protrude the pore interior thus creating the narrowest section of the B-pores. In the course of all simulations K+ ions traverse B-pores aided by transient coordinative interactions with these negatively charged residues (Figure 3C). The fashion in which K+ ions traffic through B-pores in our simulations is in agreement with recent experimental observations showing that Na+ ions are coordinated by D34 from one subunit and by D132 and T136 from another subunit in the B-pores of Pa BfrB in complex with its cognate electron transfer Pa Bfd (22). Along the same vein, Mg2+ ions have also been observed within the B-pores of Av BfrB (21) and Ms BfrB (5), where they are coordinated by water molecules. These observations taken together strongly suggest that B-pores are conduits for ion traffic in and out of the Pa BfrB central cavity.
Figure 3.

Architecture and dynamic properties of the pores in BfrB taken from a snapshot in system MD_E40. (A) 3-fold, (B) 4-fold, and (C) B-pores. Each pore type is shown viewed from the protein exterior (top) and from a transverse perspective (middle) with the internal cavity at the bottom and with the subunit closer to the viewer removed for clarity. (Bottom) The intrinsic flexibility of each type of pore is highlighted by mapping the RMSF fluctuations (see Figure 2B) from lowest (white) to highest (red). The phosphate ions in the 3-fold pores (cyan spheres) are coordinated by the side chains of R117 and K121 from each of the three subunits forming the pore. The K+ ions (magenta spheres) in the 4-fold pores are coordinated by N148 and N151 from each of the four E-helices forming the pore. B-pores harbor negatively charged residues including D34, E60, E66, D132, and E129. These residues attract K+ ions and translocate them across the protein shell during the simulations.
The bottom row in Figure 3 clearly illustrates that 3-fold pores show modest dynamic behavior. In contrast, a significant concentration of fluctuating domains is observed in the external perimeter of 4-fold pores, extending toward B-pores. Key residues contributing to the enhanced dynamics observed in these regions are located in the C-terminus of helix D and the loop connecting helices D and E; specifically, residues Q137 to G145. Moreover, in high ion concentration systems (e.g., MD_E2) the C-termini of helices D undergo frequent transitions between folded and unfolded states; Figure 4 and Movie S1 in Supporting Information document this transition and its impact on a 4-fold and one of its surrounding B-pores. The unfolding events in helices D enhance the mobility of the entire E helices: one pair of diagonally opposed E helices comes close to one another while the other pair is separated further apart. When the C-termini of helices D refold, the corresponding E helices return to their original positions. In extreme cases, the folding and unfolding events yield a ratio of up to 0.58 for the distance between two diagonally opposed E helices in close proximity relative to the distance separating two E-helices moved further apart. (Figure 4B and C). Despite their dynamic nature, the 4-fold pores are mostly closed during the simulations as the deformation caused by their dynamics always places two E-helices in close contact. The folding-unfolding equilibrium of the C-terminal portions of helices D affects the conformation of B-pores as well. Unfolding of the C-termini in helices D expands the passageway across the B-pores (Figure 4B), while refolding either returns the pore to its initial closed state or keeps the pore open by deforming the nearby 4-fold pore (Figure 4C). The dynamic opening and narrowing of B-pores supports the notion that ions traffic across the Pa BfrB shell using B-pores as conduits. Further evidence will be provided in the following section where the analysis of ion distribution and motions is presented.
Figure 4.
Snapshots illustrating the dynamic behavior of the 4-fold and B-pores. (A) A 4-fold pore (blue star) and one of its surrounding B-pores highlighted by its negatively charged residues in green, as seen in the crystal structure. (B) Melting of the C-terminal sections of helices D (Figure 2C) opens up the B-pore and increases the mobility of the entire E helix in the cyan subunit. This marks the start of the 4-fold pore deformation. (C) The E helix in the cyan subunit moves further away from its neighboring E helix (orange) toward the D-helix in the same subunit, which is now refolded. The displacement of the E helix results in deformation of the 4-fold pore and the further expansion of the B-pore. All the structure snapshots were taken along the MD_E2 trajectory.
Ion Distributions in the Pa BfrB systems
Although the interior surface of the protein shell exhibits a relatively large negative electrostatic potential (Figure 1E), the largest concentrations of negatively charged residues occur in the middle of each subunit near the ferroxidase center and in the perimeters surrounding 3-fold, 4-fold, and B-pores. Because of the significant electrostatic potential gradients created by these residues, during the simulations, K+ ions migrate toward the interior surface of BfrB and penetrate into the protein shell (black dashed lines in Figure 5) even though the majority of them stayed away from the protein shell in the GCMC/BD simulations with rigid BfrB (black line in Figure 5A). This is evident in Figure 5A, which plots the potassium ion concentration (CK) along the radial distance (R) from the center of the interior cavity for systems GCMC/BD_E10 (black) and MD_E2-E40. Clearly, systems with different ionic strengths share similar profiles of CK, strongly suggesting that ion distribution has reached a steady state in all the systems and that the concentration profiles represent the real likelihood of having ions in different regions in a given system.
Figure 5.
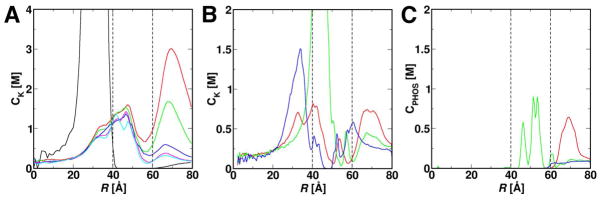
Potassium and phosphate ion concentration profiles (CK and CPHOS). CK in (A) was calculated along the radial distance (R) from the center of the interior cavity with a bin size of 0.5 Å. The results for systems MD_E2 (red), E4 (green), E10 (blue), E20 (magenta), E40 (cyan), and GCMC/BD_E10 (black) are shown. To calculate CK and CPHOS in (B) and (C), a cone is constructed with apex at the center of BfrB interior cavity and axis collinear with the pore axis. The volume enclosed by the cone is then divided into 0.5-Å slabs along its axis and concentrations of K+ and phosphate ions are computed inside each slab. Results are shown for the 3-fold (green), 4-fold (blue), and B-pores (red) in MD_E10. The estimated positions of the inner and outer protein surfaces along R are indicated by the dashed black lines.
K+ also concentrate near the 3-fold, 4-fold, and B-pores. This is clearly shown in the CK profiles along the axes of the 3-fold, 4-fold, and B-pores in Figure 5B. The peaks observed in the profiles at R = 32, 43 and 48 Å denote accumulation of K+ near 4-fold, B- and 3-fold pores, respectively. The accumulation of K+ near the three types of pores can be viewed from the protein interior (Figure 6A) and exterior (Figure 6C), where the K+ density is rendered in mesh (magenta) and the density in cyan. Figure 6A also shows that the regions with high CK, especially those near the 3-fold pores, B-pores, and ferroxidase centers are connected by bridges with lower CK. Importantly, in all simulations there is a dynamic flow that exchanges ions between these “reservoirs”; Movie S2 in Supporting Information shows individual ion trajectories visiting these reservoirs. There is also occasional exchange of K+ between the 4-fold pore and the rest of the reservoirs.
Figure 6.

Potassium ions concentrated near pores in BfrB are in dynamic exchange. (A) Representative density of K+ (magenta mesh) and (cyan mesh) in a minimal portion of the Pa BfrB assembly bearing a 3-fold, 4-fold and a B-pore viewed from the interior cavity. An identical view devoid of ion density is shown in (B) to facilitate identification of the 3-fold, 4-fold, and B-pores, which are highlighted by green, blue and red stars, respectively. This view also shows the ferroxidase center residues (green) of subunit A (yellow). The views in (C) and (D) are from the protein exterior.
In the context of the above-described observations, the significance of a network of negative potential on the inner surface of Pa BfrB is that it provides routes for cations to move along the interior surface. It is therefore plausible that Fe3+ ions exiting the ferroxidase center into the interior cavity (6, 10, 11) move along the interior surface in a similar fashion to nucleation sites where the ferric mineral grows. Similarly, Fe2+ that enters the cavity via B-pores may be efficiently transported to a ferroxidase center where it is oxidized to Fe3+ and subsequently transported to a nucleation site.
Unlike K+, which localize mainly within the subunit four-helix bundles or at the interior surface of BfrB, usually remain associated with the protein exterior surface, near the ferroxidase and B-pores (Figure 6C). As indicated above, the phosphate ions present within the 3-fold pores remain in their positions throughout the simulations (Figure 5C). The fact that not many are inside the central cavity is probably the result of the initial placement of these anions. Since the electrostatic potential inside the cavity is very negative (Figure 1E), are located predominantly in the solution bathing the protein exterior at the start of the simulations (Table 1). A few phosphate ions get fairly close to the protein during the simulations, especially in regions near the outermost layer of the B-pores. In systems with the highest concentration (MD_E2), the anion can co-appear with K+ in the outer layer of the B-pores, but unlike K+ the anions do not penetrate the B-pores. Given the predominantly negative potential within the B-pores, it is unlikely that phosphate ions use this conduit to traffic across Pa BfrB. It is tempting to speculate that phosphate ions utilize 3-fold pores and there are two plausible reasons why this traffic is not observed in the simulations: First, the timescale of the simulation is short. Second, the possibility exists that phosphate access to the interior cavity is promoted by the presence of iron concentrations within the cavity. As iron accumulates in the cavity, the positive charge carried by iron ions compensates and eventually exceeds the negative potential created by the negatively charged Pa BfrB interior surface, thus allowing the entrance of phosphate, which is incorporated into the ferric mineral.
Ion trafficking and its relation to Pa BfrB dynamics
The simulations suggest that K+ moves in and out of Pa BfrB exclusively through the B-pores (Table 2 and Movies S3 and S4). The path traveled by K+ across a B-pore consists of a series of negatively charged residues: E66 at the outermost layer, D34 and D132 in the middle, and E60 and E129 in the interior opening (Figure 3C). Among these residues, D34 and D132 are also found to coordinate Na+ in the crystal structure of Pa BfrB in complex with Pa Bfd (22). In the crystal structure of Av BfrB, three of these residues D34, E66 and D132, and two additional ones, E135 and D139, are probably responsible for the presence of the Mg2+ ions inside the B-pores (21). Considering the ability of these negatively charged residues to attract cations into the B-pores and further transport them across the protein shell, it is reasonable to suggest that Fe2+ ions enter and/or exit the BfrB central cavity via B-pores.
Table 2.
Number of K+ ions escaped/entered (Nescaped/Nentered) via the B-pores during the 40-ns trajectories in the MD systems E2 to E40.
| E2 | E4 | E10 | E20 | E40 | |
|---|---|---|---|---|---|
| Nescaped | 63 | 56 | 63 | 23 | 0 |
| Nentered | 5 | 2 | 4 | 3 | 4 |
The net number of K+ moving out of the protein cage displays a slight dependence on the initial CK inside the Pa BfrB cage. In general, higher interior CK results in more K+ exiting the interior cavity, which is in agreement with the intuitive notion that K+ flux occurs in response to concentration gradients across the protein shell. Also in agreement with the idea of flux controlled by a chemical potential is the observation that the total numbers of K+ released in systems MD_E2, E4, and E10 in the 40-ns duration are not significantly different because the CK in the external solution is high and comparable to the concentration of K+ in the interior.
Communication between the ferroxidase center and the K2HPO4 solution
The ferroxidase centers communicate with the K2HPO4 solution by allowing K+ to enter from either the exterior or the interior K2HPO4 solution. At the beginning of the simulations, all the ferroxidase centers were devoid of cations. As the simulations proceed, there is one incidence of K+ penetrating into the ferroxidase centers from the external K2HPO4 solution via the previously identified ferroxidase pore (6). The low frequency of this occurrence is probably linked to the fact that K+ entering the protein from the exterior solution has to work against the concentration gradient. K+ enters the pore steered by one of the ferroxidase center residues, E94, and reaches a pocket within the four-helix bundle, which is adjacent to the ferroxidase center and harbors two negatively charged residues, E44 and D90. Movie S5 documents this trajectory. These observations are in agreement with the notion derived from X-ray crystallographic and kinetic studies in solution that the ferroxidase pores in Pa BfrB serve as entry ports of iron into the ferroxidase center (6).
In the simulations K+ ions enter the ferroxidase centers from the interior K2HPO4 solution with much higher frequency (Movie S6). The events follow a well-defined path composed of several negatively charged residues (E47, D50, and E129) on helices B and D near the inner opening of the ferroxidase centers. Permeation of K+ into the ferroxidase center from the interior cavity creates a unique organization of cations in and around the ferroxidase centers as depicted in Figure 7. Four sites are favored by K+; two of them (➀ and ➁) are close to the previously identified ferroxidase iron binding sites, the third (➂) is near the exterior surface, and the fourth (➃) is located adjacent to the ferroxidase center in the pocket created by E44 and D90, close to H130. The observation that cations such as K+ are stabilized within the apo-ferroxidase centers is in line with the crystal structure of Pa FtnA, where Na+ ions were found in the ferroxidase centers (17). In this context, the presence of K+ within the ferroxidase centers is not only expected, but it provides an important correlation to experimental observations which largely validate our approach and additional insights derived from the MD simulations.
Figure 7.

Potassium ions exchange in and out of ferroxidase centers. Stereo views showing the distribution of potassium ions (magenta mesh) close to the ferroxidase ligands (green) viewed from (A) the interior cavity of BfrB with helices B and D in the front and (B) the side of the subunit with helices C and D in the front. In (B), the interior cavity is at the bottom and the protein exterior at the top. (A) and (B) are related by a 90° rotation along the horizontal axis. Iron ions in the ferroxidase center of Pa BfrB (PDB:3IS8) are shown as orange spheres. Different helices are indicated by red letters.
Although sites ➀–➃ are always observed with K+ bound, these K+ do not necessarily remain at these sites during the entire course of the simulations. Rather, they exchange sites, predominantly between sites ➁ and ➃. K+ at site ➁ can also be released and replaced by another K+ coming in from the interior cavity. The dynamic reorganization of K+ in and around the ferroxidase centers is likely facilitated by H130 side chains. Two dominant side chain conformations of H130 are detected in all the simulations, with χ1 angles at −180° and −60° (Figure 8) that correspond to the “gate closed” and “gate open” conformations in the crystal structures of Pa BfrB obtained with and without iron in the ferroxidase center (6). The transition between these two conformations swings the imidazole ring of H130 and disrupts interactions between K+ and the ferroxidase center residues at the K+ binding sites, especially site ➁, which harbors the K+ that exchanges frequently with the K2HPO4 solution in the interior cavity. Movie S6 exhibits the trajectory of a K+ ion getting into site ➁ from the internal K2HPO4 solution assisted by H130 side chain motion.
Figure 8.

H130 in its “gate-closed” (magenta) and “gate-open” (green) conformations. For a clear view, K+ ions are not included.
The above observations taken together provide unique insights into the influence exerted by dynamics on the function of the ferroxidase centers in Pa BfrB. Cations such as K+ and Na+ are likely ubiquitously present in the ferroxidase centers, to where they gain access from either side of the protein shell. The monovalent ions flow in and out of the ferroxidase centers in large part aided by the dynamic pedaling of the H130 side chain. In this context, the translocation of K+ from the ferroxidase center to the interior cavity observed during the simulations, which is gated by the conformational exchange of the H130 side chain, is reminiscent of the mechanism proposed for gating Fe3+ from the ferroxidase center to the interior cavity (6). Hence, the MD simulations lend support to the gating role played by the side chain of H130 and provide unprecedented insight into the protein motions that enable cations to traffic through ferroxidase centers.
SUMMARY AND CONCLUSIONS
Bacterioferritin (Bfr) regulates cytosolic iron concentrations by oxidizing Fe2+ ions, compartmentalizing the Fe3+ as a mineral in its interior, and when necessary releasing Fe2+ to the cytosol for their incorporation in metabolism. Hence, the Bfr shell separates the iron mineral from the cytosolic environment and protects it from indiscriminate reduction by reducing agents in the cell. In order to function as effective regulators of cytosolic iron concentrations, Bfrs must allow the efficient and directional flow of iron, either into their cavity (iron uptake) or out to the cytosol (iron mobilization). In the process of iron uptake, Fe2+ is thought to access the ferroxidase centers via ferroxidase pores and bind to ferroxidase center ligands to form di-Fe2+ complexes. These are subsequently oxidized to di-Fe3+ moieties, which are then translocated from the ferroxidase centers to the interior cavity, where the iron mineral is formed. Structural and kinetic studies carried out with Pa BfrB (6) have shown that H130, a ferroxidase center ligand, coordinates iron when its side chain is in a “closed gate” conformation; a change to its “open gate” conformation allows Fe3+ to move from the ferroxidase center to the interior cavity. Hence, the ferroxidase center of Pa BfrB is thought to function in the dual capacity of both a pore and a catalytic site (6). In comparison, kinetic and structural studies with E. coli Bfr (Ec Bfr) showed that iron bound to the ferroxidase centers of Ec Bfr is not translocated into the interior cavity, but functions as a cofactor that catalyzes the oxidation of Fe2+ that gained access to the interior cavity via a yet unknown type of pore (3-fold, 4-fold or B-) in its structure (8, 35).
The current MD simulations are performed in K2HPO4 solutions. Although K+ and Fe2+ are different in many ways, they share a certain degree of similarity. Both ions are soluble and carry positive charges. We suggest that the results obtained for K+ in our simulations may be indicative of the behavior of Fe2+ as it traffics in and out of the Bfr molecule. Clearly, the rich redox chemistry of iron (Fe2+/Fe3+) cannot be replicated using K+. Nevertheless, the traffic of K+ ions across the Bfr structure observed in our simulations is either in agreement with prior experimental observations, or adds new insights, such as the traffic of K+ through B-pores.
The simulation results reveal dynamically active ferroxidase centers (devoid of iron) in Pa BfrB, which are readily accessed by K+ ions from the solution bathing the 24-mer, or from the interior cavity. In the simulations K+ in the external solution is seen to enter the ferroxidase center through the ferroxidase pore (Movie S5), an observation that is in agreement with prior structural reports suggesting that as part of the iron uptake process Fe2+ ions access the ferroxidase center via ferroxidase pores (6, 11). The MD simulations also reveal that K+ in the ferroxidase centers is in dynamic exchange with K+ in the interior cavity (Movie S6). Access and exit of K+ to and from ferroxidase centers is facilitated by the dynamic behavior of the H130 side chain (Figure 8 and Movie S6), which is seen to periodically alternate between a conformation similar to the iron-bound (closed gate) state in the iron-bound BfrB crystal structure and a conformation similar to the iron-free (open gate) state in the crystal structure of iron-free BfrB (6). Consequently, the dynamic nature of the ferroxidase centers in Pa BfrB is reflected correctly in the MD simulations. The differences in the iron uptake process observed for Pa and Ec Bfr, despite their nearly identical structures, cannot be explained from the available data. Nevertheless, future efforts aiming at understanding the source of the differences is likely to provide important additional insights that will illuminate the details of how bacteria regulate cytosolic iron concentrations.
The recovery of Fe2+ from the Bfr cavity (iron mobilization) requires specific protein-protein interactions that enable electron transfer from the [2Fe, 2S] cluster of Bfr-associated Bfd to the iron mineral in Bfr (22, 36). Although Fe2+ is thought to exit the protein via pores in the structure, the type of pore used as conduit is unknown. Crystal structures of Bfrs typically exhibit monovalent or divalent cations in the 4-fold pores, which has led to the suggestion that Fe2+ may utilize 4-fold pores to traffic across the Bfr protein shell. The MD simulations show that K+ ions do not cross the Pa BfrB shell via 4-fold pores. Instead K+ ions traverse the BfrB shell using B-pores, assisted by conserved negatively charged residues (Movies S3 and S4). The simulations also suggest that K+ traffic through B-pores is enabled by folding-unfolding fluctuations in the C-termini of helices D, which cause the B-pores to expand and contract (Figure 4 and Movie S1). The folding-unfolding fluctuations of helices D also cause lateral displacement of the E-helices, placing two opposed E-helices closer to each other while the other two are separated further apart (Figure 4 and Movie S1). Such displacement of the E-helices has the effect of narrowing the 4-fold pores. This not only causes some of the K+ ions to exit the pores early in the simulations, but also prevents ion traffic through them. It is important to note that the folding-unfolding fluctuations in the C-termini of helices E are facilitated by the architecture of the 4-fold pores, which absorb the lateral translation of E-helices with minimal perturbation to the 24-mer assembly. Hence, the coordinated fluctuations in and around 4-fold pores allow the B-pores to undergo “breathing” motions that enable ion traffic through the Bfr shell. In this context, it is noteworthy that B-pores are not present in the structures of eukaryotic ferritins, where ion traffic is thought to occur through 3-fold pores.
Supplementary Material
Acknowledgments
This work was supported in part by NIH R01-GM092950 (to W.I.), TeraGrid/XSEDE resources (TG-MCB070009 to W.I), and NSF MCB-1158469 (to M.R.).
Footnotes
Table S1 listing the RMSD of Pa BfrB in the MD simulations, Figure S1 depicting ion number during the GCMC/BD simulations, Movie S1 documenting the folding-unfolding transition of the C-terminal region of helix D and its impact on the 4-fold and B-pores, Movie S2 illustrating K+ ion exchange between K+ density reservoirs at the 3-fold pore, the B-pore and the ferroxidase center, Movie S3 depicting K+ escaping the Pa BfrB cage from the B-pores, Movie S4 demonstrating K+ entering the central cavity using the B-pores, Movie S5 illustrating K+ entering the ferroxidase center via the ferroxidase pore, and Movie S6 illustrating K+ entering the ferroxidase center from the central cavity aided by H130 side chain orientation change. This material is available free of charge via the Internet at http://pubs.acs.org.
References
- 1.Andrews SC, Robinson AK, Rodríguez-Quiñones F. Bacterial Iron Homeostasis. FEMS Microbio Rev. 2003;27:215–237. doi: 10.1016/S0168-6445(03)00055-X. [DOI] [PubMed] [Google Scholar]
- 2.Touati D. Iron and oxidative stress in bacteria. Arch Biochem Biophys. 2000;373:1–6. doi: 10.1006/abbi.1999.1518. [DOI] [PubMed] [Google Scholar]
- 3.Lewin A, Moore GR, Le Brun NE. Formation of protein-coated iron minerals. Dalton Trans. 2005;22:3597–3610. doi: 10.1039/b506071k. [DOI] [PubMed] [Google Scholar]
- 4.Andrews SC. The Ferritin-like Superfamily: Evolution of the Biological Iron Storeman from a Ruberythrin-Like Ancestor. Biochim et Biophys Acta. 2010;1800:691–705. doi: 10.1016/j.bbagen.2010.05.010. [DOI] [PubMed] [Google Scholar]
- 5.Janowski R, Auerbach-Nevo T, Weiss MS. Bacterioferritin from Mycobacterium smegmatis contains zinc in its di-nuclear site. Protein Science. 2008;17:1138–1150. doi: 10.1110/ps.034819.108. [DOI] [PMC free article] [PubMed] [Google Scholar]
- 6.Weeratunga SK, Lovell S, Yao HL, Battaile KP, Fischer CJ, Gee CE, Rivera M. Structural Studies of Bacterioferritin B from Pseudomonas aeruginosa Suggest a Gating Mechanism for Iron Uptake via the Ferroxidase Center. Biochemistry. 2010;49:1160–1175. doi: 10.1021/bi9015204. [DOI] [PMC free article] [PubMed] [Google Scholar]
- 7.Cobessi D, Huang LS, Ban M, Pon NG, Daldal F, Berry EA. The 2.6 A resolution structure of Rhodobacter capsulatus bacterioferritin with metal-free dinuclear site and heme iron in a crystallographic ‘special position’. Acta Crystallogr D Biol Crystallogr. 2002;58:29–38. doi: 10.1107/s0907444901017267. [DOI] [PMC free article] [PubMed] [Google Scholar]
- 8.Crow A, Lawson TL, Lewin A, Moore GR, Le Brun NE. Structural basis for iron mineralization by bacterioferritin. J Am Chem Soc. 2009;131:6808–6813. doi: 10.1021/ja8093444. [DOI] [PubMed] [Google Scholar]
- 9.Frolow F, Kalb AJ, Yariv J. Structure of a unique twofold symmetric haem-binding site. Nat Struct Biol. 1994;1:453–460. doi: 10.1038/nsb0794-453. [DOI] [PubMed] [Google Scholar]
- 10.Liu HL, Zhou HN, Xing WM, Zhao JF, Li SX, Huang JF, Bi RC. 2.6 A resolution crystal structure of the bacterioferritin from Azotobacter vinelandii. FEBS Lett. 2004;573:93–98. doi: 10.1016/j.febslet.2004.07.054. [DOI] [PubMed] [Google Scholar]
- 11.Macedo S, Romao CV, Mitchell E, Matias PM, Liu MY, Xavier AV, LeGall J, Teixeira M, Lindley P, Carrondo MA. The nature of the di-iron site in the bacterioferritin from Desulfovibrio desulfuricans. Nat Struct Biol. 2003;10:285–290. doi: 10.1038/nsb909. [DOI] [PubMed] [Google Scholar]
- 12.Levi S, Santambrogio P, Corsi B, Cozzi A, Arosio P. Evidence that Residues Exposed on the Three-Fold Channels Have Active Roles in the Mechanism of Ferritin Iron Incorporation. Biochem J. 1996;317:467–473. doi: 10.1042/bj3170467. [DOI] [PMC free article] [PubMed] [Google Scholar]
- 13.Treffry A, Bauminger ER, Hechel D, Hodson NW, Nowik I, Yewdall SJ, Harrison PM. Defining the Roles of the Threefold channels in Iron Uptake, Iron Oxidation and Iron-Core Formation in Ferritin: A Study Aided by Site-Directed Mutagenesis. Biochem J. 1993;296:721–728. doi: 10.1042/bj2960721. [DOI] [PMC free article] [PubMed] [Google Scholar]
- 14.Tosha T, Behera RK, Ng HL, Bhattasali O, Alber T, Theil EC. Ferritin Protein Nanocage Ion Channels: Gating by N-Terminal Extensions. J Biol Chem. 2012;287:13016–13025. doi: 10.1074/jbc.M111.332734. [DOI] [PMC free article] [PubMed] [Google Scholar]
- 15.Hempstead PD, Yewdall SJ, Fernie AR, Lawson DM, Artymiuk PJ, Rice DW, Ford GC, Harrison PM. Comparison of the three-dimensional structures of recombinant human H and horse L ferritins at high resolution. J Mol Biol. 1997;268:424–448. doi: 10.1006/jmbi.1997.0970. [DOI] [PubMed] [Google Scholar]
- 16.Weeratunga S, Lovell S, Yao H, Battaile KP, Fischer CJ, Gee CE, Rivera M. Structural Studies of Bacterioferritin B (BfrB) from Pseudomonas aeruginosa Suggest a Gating Mechanism for Iron Uptake via the Ferroxidase Center. Biochemistry. 2010;49:1160–1175. doi: 10.1021/bi9015204. [DOI] [PMC free article] [PubMed] [Google Scholar]
- 17.Yao H, Jepkorir G, Lovell S, Nama PV, Weeratunga S, Battaile KP, Rivera M. Two distinct ferritin-like molecules in Pseudomonas aeruginosa: the product of the bfrA gene is a bacterial ferritin (FtnA) and not a bacterioferritin (Bfr) Biochemistry. 2011;50:5236–5248. doi: 10.1021/bi2004119. [DOI] [PMC free article] [PubMed] [Google Scholar]
- 18.Macedo S, Romão CV, Mitchell E, Matias PM, Liu MY, Xavier AV, LeGall J, Teixeira M, Lindley P, Carrondo MA. The Nature of the Di-Iron Site in the Bacterioferritin from Desulfovibrio desulfuricans. Nat Struct Biol. 2003;10:285–290. doi: 10.1038/nsb909. [DOI] [PubMed] [Google Scholar]
- 19.Takahashi T, Kuyucak S. Functional properties of threefold and fourfold channels in ferritin deduced from electrostatic calculations. Biophys J. 2003;84:2256–2263. doi: 10.1016/S0006-3495(03)75031-0. [DOI] [PMC free article] [PubMed] [Google Scholar]
- 20.Liu H-L, Zhou H-N, Xing W-M, Zhao J-F, Li S-X, Huang J-F, Bi R-C. 2.6 Å Resolution Crystal Structure of the Bacterioferritin from Azotobacter vinelandii. FEBS Lett. 2004;573:93–98. doi: 10.1016/j.febslet.2004.07.054. [DOI] [PubMed] [Google Scholar]
- 21.Swartz L, Kuchinskas M, Li H, Poulos TL, Lanzilotta WN. Redox-dependent structural changes in the Azotobacter vinelandii bacterioferritin: new insights into the ferroxidase and iron transport mechanism. Biochemistry. 2006;45:4421–4428. doi: 10.1021/bi060146w. [DOI] [PubMed] [Google Scholar]
- 22.Yao H, Wang Y, Lovell S, Kumar R, Ruvinsky AM, Battaile KP, Vakser IA, Rivera M. The Structure of the BfrB-Bfd Complex Reveals Protein-Protein Interactions Enabling Iron Release from Bacterioferritin. J Am Chem Soc. 2012 doi: 10.1021/ja305180n. [DOI] [PMC free article] [PubMed] [Google Scholar]
- 23.Jo S, Kim T, Iyer VG, Im W. CHARMM-GUI: a web-based graphical user interface for CHARMM. J Comput Chem. 2008;29:1859–1865. doi: 10.1002/jcc.20945. [DOI] [PubMed] [Google Scholar]
- 24.Brooks BR, Brooks CL, III, MacKerell JAD, Nilsson L, Petrella RJ, Roux B, Won Y, Archontis G, Bartels CBS, Caflisch A, Caves L, Cui Q, Dinner AR, Feig M, Fischer S, Gao M, Hodoscek M, Im W, Kuczera K, Lazaridis T, Ma J, Ovchinnikov V, Paci E, Pastor RW, Post CB, Pu JZ, Schaefer M, Tidor B, Venable RM, Woodcock HL, Wu X, Yang W, York DM, Karplus M. CHARMM: The Biomolecular Simulation Program. J Comput Chem. 2009;30:1545–1614. doi: 10.1002/jcc.21287. [DOI] [PMC free article] [PubMed] [Google Scholar]
- 25.Lee KI, Jo S, Rui H, Egwolf B, Roux B, Pastor RW, Im W. Web interface for brownian dynamics simulation of ion transport and its applications to beta-barrel pores. J Comput Chem. 2012;33:331–339. doi: 10.1002/jcc.21952. [DOI] [PMC free article] [PubMed] [Google Scholar]
- 26.Im W, Roux B. Ion permeation and selectivity of OmpF porin: a theoretical study based on molecular dynamics, Brownian dynamics, and continuum electrodiffusion theory. J Mol Biol. 2002;322:851–869. doi: 10.1016/s0022-2836(02)00778-7. [DOI] [PubMed] [Google Scholar]
- 27.Ermak DL, Mccammon JA. Brownian Dynamics with Hydrodynamic Interactions. J Chem Phys. 1978;69:1352–1360. [Google Scholar]
- 28.Chandrasekhar S. Stochastic problems in physics and astronomy. Rev Mod Phys. 1943;15:0001–0089. [Google Scholar]
- 29.Phillips JC, Braun R, Wang W, Gumbart J, Tajkhorshid E, Villa E, Chipot C, Skeel RD, Kale L, Schulten K. Scalable molecular dynamics with NAMD. J Comput Chem. 2005;26:1781–1802. doi: 10.1002/jcc.20289. [DOI] [PMC free article] [PubMed] [Google Scholar]
- 30.MacKerell AD, Bashford D, Bellott M, Dunbrack RL, Evanseck JD, Field MJ, Fischer S, Gao J, Guo H, Ha S, Joseph-McCarthy D, Kuchnir L, Kuczera K, Lau FTK, Mattos C, Michnick S, Ngo T, Nguyen DT, Prodhom B, Reiher WE, Roux B, Schlenkrich M, Smith JC, Stote R, Straub J, Watanabe M, Wiorkiewicz-Kuczera J, Yin D, Karplus M. All-atom empirical potential for molecular modeling and dynamics studies of proteins. J Phys Chem B. 1998;102:3586–3616. doi: 10.1021/jp973084f. [DOI] [PubMed] [Google Scholar]
- 31.Mackerell AD, Feig M, Brooks CL. Extending the treatment of backbone energetics in protein force fields: Limitations of gas-phase quantum mechanics in reproducing protein conformational distributions in molecular dynamics simulations. J Comput Chem. 2004;25:1400–1415. doi: 10.1002/jcc.20065. [DOI] [PubMed] [Google Scholar]
- 32.Durell SR, Brooks BR, Benniam A. Solvent-induced forces between two hydrophillic groups. J Phys Chem. 1994;98:2198–2202. [Google Scholar]
- 33.Steinbach PJ, Brooks BR. New Spherical-Cutoff Methods for Long-Range Forces in Macromolecular Simulation. J Comput Chem. 1994;15:667–683. [Google Scholar]
- 34.Shannon R. Revised effective ionic radii and systematic studies of interatomic distances in halides and chalcogenides. Acta Crystallogr A. 1976;32:751–767. [Google Scholar]
- 35.Le Brun NE, Wilson MT, Andrews SC, Guest JR, Harrison PM, Thomson AJ, Moore GR. Kinetic and structural characterization of an intermediate in the biomineralization of bacterioferritin. FEBS Lett. 1993;333:197–202. doi: 10.1016/0014-5793(93)80404-i. [DOI] [PubMed] [Google Scholar]
- 36.Weeratunga SK, Gee CE, Lovell S, Zeng Y, Woodin CL, Rivera M. Binding of Pseudomonas aeruginosa apobacterioferritin-associated ferredoxin to bacterioferritin B promotes heme mediation of electron delivery and mobilization of core mineral iron. Biochemistry. 2009;48:7420–7431. doi: 10.1021/bi900561a. [DOI] [PMC free article] [PubMed] [Google Scholar]
- 37.DeLano WL. The PyMOL Molecular Graphics System. Palo Alto, CA, USA: 2002. [Google Scholar]
Associated Data
This section collects any data citations, data availability statements, or supplementary materials included in this article.