Abstract
Airway cilia depend on precise changes in shape to transport the mucus gel overlying mucosal surfaces. The ciliary motion can be recorded in several planes using video microscopy. However, cilia are densely packed, and automated computerized systems are not available to convert these ciliary shape changes into forms that are useful for testing theoretical models of ciliary function. We developed a system for converting planar ciliary motions recorded by video microscopy into an empirical quantitative model, which is easy to use in validating mathematical models, or in examining ciliary function, e.g., in primary ciliary dyskinesia (PCD). The system we developed allows the manipulation of a model cilium superimposed over a video of beating cilia. Data were analyzed to determine shear angles and velocity vectors of points along the cilium. Extracted waveforms were used to construct a composite waveform, which could be used as a standard. Variability was measured as the mean difference in position of points on individual waveforms and the standard. The shapes analyzed were the end-recovery, end-effective, and fastest moving effective and recovery with mean (± SE) differences of 0.31(0.04), 0.25(0.06), 0.50(0.12), 0.50(0.10), μm, respectively. In contrast, the same measures for three different PCD waveforms had values far outside this range.
Keywords: model, empirical, video, ciliated epithelia, primary ciliary dyskinesia
cilia and flagella are cellular organelles, which undergo dynamic cyclic shape changes that propel fluid. Most epithelial cells of the conducting airways of the lung are ciliated, and it is the function of these cells to propel mucus so that the airway is cleared of inhaled microbes and particulates. Impaired ciliary or flagellar motion is a characteristic of a number of human diseases (18, 22); primary ciliary dyskinesia (PCD) and cystic fibrosis typify failures of ciliary function as a result of defects intrinsic to cilia and the result of the ciliary environment, respectively.
Because the geometry of dynein-tubulin interactions and the periodic nature of dynein activation are lost when the axoneme is dismantled, it is not possible to elucidate the mechanism generating the dynamics from experiments with isolated dynein motors processing on microtubules. It is necessary to study the dynamics directly. For flagella, clear video images allow the accurate recording organelle shapes by hand and the derivation of parameters such as curvature (17, 23). Automated video analysis that can be used to digitize flagellar shapes and extract dynamics has been demonstrated by Baba and Mogami (1). Given the symmetry of the flagellar beat, Eshel and Brokaw (9) showed that recording shear angle from video frames enabled the fitting of the dynamics over many cycles to a trigonometric function, thus allowing the dynamics to be described with a smooth parameter set. Some theoretical dynamics have been coupled to the experimentally acquired dynamics. For example, the shear angle of the flagellar dynamics has been used to analyze dynamics under different conditions (9, 34), to estimate doublet sliding velocities (9), and to create an empirical dynamic model (4). The high degree of confidence in the accuracy of the experimental flagellar dynamics arises from the length of flagella, their low speed, the symmetry of their dynamics, and the clarity of images that preparations of free swimming cells yield. Furthermore, the low background noise of such high contrast images allows automated software analysis of flagellar dynamics (1).
Analysis of ciliary dynamics has been more problematic; cilia are less than one-tenth the length of many spermatozoan flagella (which can reach several hundred micrometers long), and their speed and the curvatures generated are much greater. Recently Bayly et al. (2, 3) have developed a system for the semiautomated extraction of Chlamydomonas reinhardtii flagellar dynamics from videos. These organelles have two types of waveform, one of which is similar to the mammalian ciliary waveform. They are only about 13 to 15 μm long and beat at 60 to 70 Hz. The system produced a smooth description of the shape changes of cilia (2) from which it was possible to make theoretical calculations of the forces generated (3). Although mammalian respiratory cilia have a much slower beat (7 to 20 Hz) than those of Chlamydomonas, they are even shorter (around 7 μm), and they are densely packed, 100–200 per cell. The density of these cilia and the organization of the cells as epithelial sheets interfere with the automated extraction of ciliary shape changes. For these reasons, ciliary dynamics, as we presently know them, have been traced by hand, e.g., Sanderson and Dirksen (25) and Weaver and Hard (33). The highest level of sophistication for analysis of cilia used a computer-generated projection to illustrate an entire ciliary dynamics in 3-D (7). However, in this case, there was never a direct presentation of the images with the model or a mathematical description of the dynamics.
A number of fundamentally different approaches have been used to construct theoretical models that generate ciliary dynamics, but the different dynamics so generated have gross qualitative differences. Lindemann (16) demonstrated a general theoretical model for axonemes that was constructed to reproduce the flagellar dynamics and that was also able to produce ciliary dynamics by altering some parameters. Dillon and Fauci (8) presented a theoretical model that included hydrodynamic interactions between cilia and the overlying liquid. Gueron and Levit-Gurevich (12) presented a model that incorporated many cilia and the interactions between the cilia. They also demonstrated the ability of these models to generate smooth data sets useful in the investigation of axonemal mechanisms (12). Unlike the flagellar models, the theoretical ciliary models have not had clear empirical models with which they could be compared. As expected, these models were qualitatively different. For example, Lindemann's model retained a curved distal cilium at the end of the recovery stroke; Dillon and Fauci's model had mirror-image end-effective and end-recovery shapes; and Gueron and Levit-Gurevich's model was the only one with a broad negative curvature along most of the cilium at the end of the effective stroke. Consequently, there is a major need for a quantitatively accurate empirical model of the ciliary dynamics.
Given the difficulties in visualizing cilia, the efficiency necessary for the generation of an empirical model can only be achieved with a system that allows the model to be easily altered and compared with a video of beating cilia. The empirical system presented here allows a smooth representation of the dynamics that can be used to validate theoretical models of the ciliary beat.
MATERIALS AND METHODS
Cell culture.
The cell culture medium was purchased from Gibco (Gaithersburg, MD) and its supplements from Collaborative Research (Bedford, MA). Dulbecco's modified Eagle's medium-Ham's F12 nutrient mixture (DMEM-F12) used during experiments was also purchased from Gibco. Twelve-millimeter Transwell-Col permeable supports (T-Cols, Costar) were obtained from Costar (Cambridge, MA).
Human bronchial epithelial cells (HBE) were obtained from normal human bronchi and grown in primary culture as described previously (11, 24). Briefly, HBE cells were isolated and grown on plastic culture dishes in bronchial epithelial cell growth medium (BEGM), passaged at ∼70% confluence, and first-passage cells were seeded onto collagen-coated T-Cols, at 250,000 cells per support. After confluence, the cells were maintained under air-liquid interface (ALI) conditions in ALI culture medium, BEGM modified (per Ref. 11), which was changed at the basolateral surface three times a week. HBE cell cultures were used for experiments 4–6 wk after confluence, when the columnar cells are well differentiated. Human nasal epithelial (HNE) cells were obtained from scrape biopsies of the inferior surface of the inferior nasal turbinates using a nasal curettage technique (22), which was preceded with several saline rinses without anesthetic agent. Both procedures were performed in accordance with protocols approved by the University of North Carolina Institutional Review Board.
HNE cells were isolated and prepared for culture as follows. The sample from each scrape biopsy was placed in ice-cold MEM containing a cocktail of antibiotics (actomycin and vancomycin) and antifungals (nystatin, diflucan, and amphotericin B) (per Ref. 11). Dithiothreitol (10 mM) was added to depolymerize the mucus, with vigorous mixing by pipette at room temperature for 2 min. The samples were then diluted 1:10 in ice cold MEM, centrifuged gently, and resuspended in DMEM-F12. After being washed, the sample was treated with 1% Protease XIV for 120 min on a rocker at 4°C, following which an equal amount of FBS was added to neutralize the protease. The cells were collected by centrifugation, resuspended in BEGM, and seeded onto Vitrogen-coated plates; samples with <500,000 cells were plated onto 24-well plates, whereas samples with >500,000 cells were plated onto 12-well plates. After 24 h, the unattached cells were collected, treated with 10 mM dithiothreitol, centrifuged, washed, and plated in a new well. After cultures were 70% confluent, the cells were passaged using double trypsinization, neutralized with soybean trypsin inhibitor, gently centrifuged, resuspended in ALI, plated onto either 12-mm (220,000 cells) or 6.5-mm (100,000 cells) T-Cols, and subsequently treated like HBE cell cultures (above).
Microscopy and experimental setup.
Permeable supports bearing fully differentiated HBE and HNE cell cultures were excised from their T-Col holders, mounted as described immediately below, and the cells observed with a Nikon Eclipse TE-2000 microscope equipped with a ×60/1.4 NA oil immersion objective, a 0.85 NA condenser, and DIC optics, with up to ×3 postobjective magnification. The objective was fitted with an objective heater (Bioptechs, Butler, PA), which was used to warm both the objective and the bath, when desired, to 37°C. A Megaplus ES-310 T camera (Redlake, Tucson, AZ) was used to record ciliary activity at 125–250 frames per second (fps), under the control of SAVA video acquisition software (Ammons Engineering, Mt. Morris, MI).
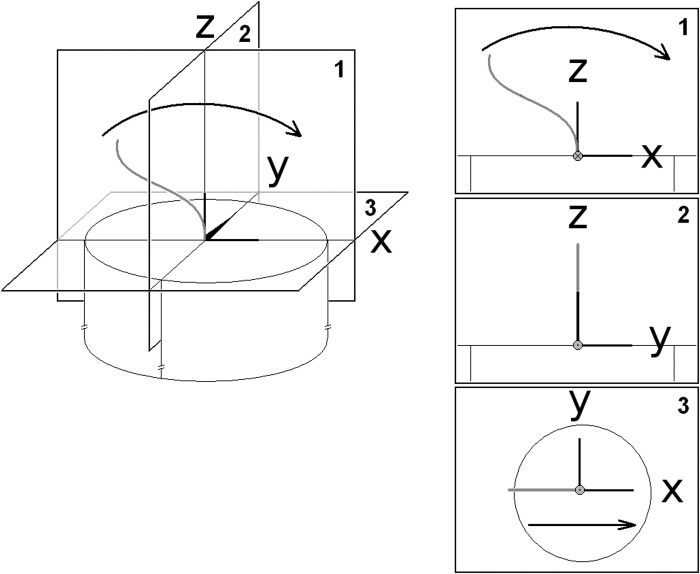
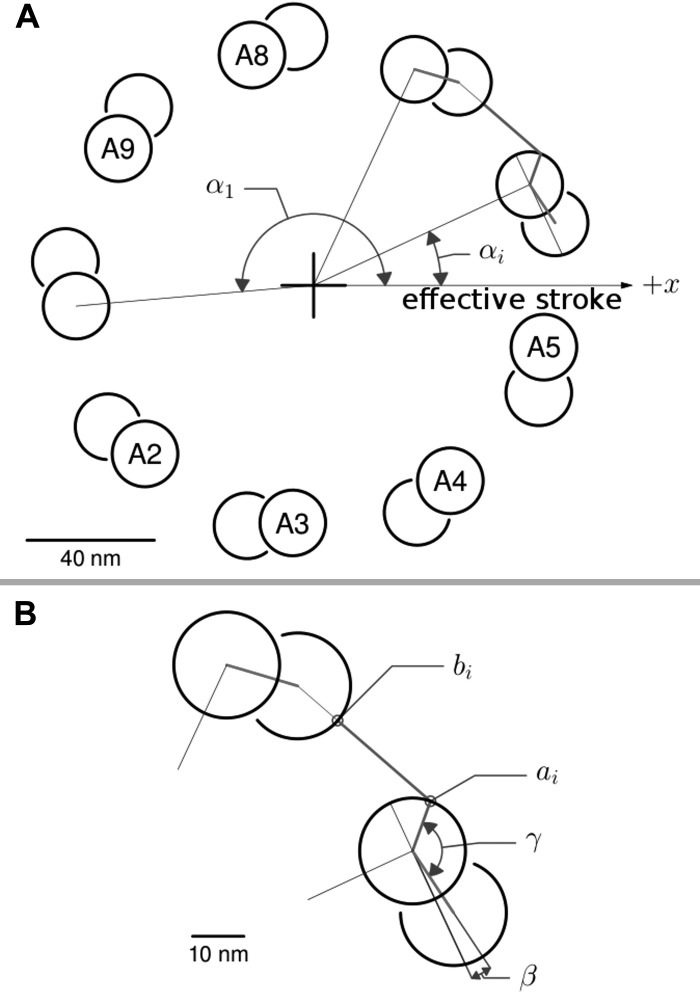
With the use of two experimental chamber configurations, videos for the characterization of cultured epithelial cells were taken from three angles: top-down, profile, and frontal planes of the dynamics. Unless specified, the frontal plane will refer to images of cilia beating both toward and away from the objective. Analyses used a right-handed global coordinate system with the x-axis in the direction of flow, the z-axis upward, and the origin placed at the base, or proximal, end of the cilium (Fig. 1). This arrangement resulted in coordinate planes x,y (top-down), x,z (profile), and y,z (frontal). Occasionally, a local coordinate system was used with its origin at some point along the cilium, and the global system was rotated about the y-axis to align the z-axis with the local ciliary axis. The structural framework used to convert shear angles to distances is shown in Fig. 2. Although the shear angles are independent of the internal structure, distances in micrometers are easier to conceptualize, and we did not find large changes in these distances using acceptable structures.
Fig. 1.
Orientation axes used for the empirical model with end-recovery cilium (gray). The 3 views depicted in 3D (left) and singly (right) were defined as 1, the profile view (x,z); 2, the frontal view (y,z); and 3, the top view (x,y). The cilium beats in the x,z plane. The direction of average flow is in the x direction. The z-axis is normal to the cell surface. The y-axis is chosen to make the system right-handed orthonormal.
Fig. 2.
Doublet geometry used for displacement calculations. The cross section of the cilium is shown in the nonstandard tip-to-cell view to place the x and y axes (see Fig. 1) with their conventional orientation. The doublet numbering scheme was chosen for easy comparison with other organisms in which structures in the axoneme allow easy orientation relative to the effective stroke and in which doublet 1 has been placed at the trailing (-x) edge (24, 11). A: doublets were placed at a constant distance from the center of the axoneme starting with doublet A1 at the angle αi (185°) from the x-axis. B: effective separation between doublets used in calculations of doublet displacement was the component along the x-axis of segment (bi, ai) for that particular doublet. The values used for placing the segment were as follows: radial position of doublet A-tubule center, 74 nm; tubule radius, 10 nm; separation between A and B tubules, 14 nm; β, 8°; γ, 127°.
Top-down images were acquired from T-Col culture inserts placed on a cover glass on the microscope stage with 100 μl of buffer on the apical side. Both profile and frontal images were acquired from cultures that were wrapped around the edge of a cover glass or a slide so that the epithelium could be viewed along an edge.
A glass coverslip (160 μm) or slide (1 mm) bearing a culture, wrapped around an edge for profile and frontal viewing, was placed flat on a 55 × 25 mm #1 cover glass, then covered with second 18 × 18 mm cover glass to form a sandwich with a gap along the edge of the glass bearing the culture. The gap allowed cilia on cells located along the edge to beat freely. Silicone grease secured the assembly and confined the medium (DMEM-F12) to a channel 1 cm wide, 1.8 cm long, and 200 μm high when a cover glass was used or 1 mm high when a slide was used.
Development and testing of the empirical model.
To analyze ciliary shapes, we initially traced cilia in their end-effective and end-recovery positions from individual video images. Curvature along the length of the cilium was one of the parameters of interest and, during its calculation, it became evident that errors in tracing the cilium were amplified. Pixelation was especially detrimental in that it caused positions to be forced into quanta, which then turned curvatures into sharp edges. Smoothing procedures did not eliminate these errors without introducing bias and were not useful in correlating changes in ciliary shape.
The chosen solution was to use an empirical model that defined ciliary shapes with a smooth function and to fit the model by directly controlling function parameters while visualizing the model superimposed on the video images of cilia. This allowed the correlation of shapes from one frame to another because a single function would define all the shapes in a cycle by the changes in its parameters over time.
The digitized shapes derived from our manual tracing of end-effective and end-recovery positions were used to test empirical models. A model had to replicate these two extreme shapes, and its parameters had to be few and suitable for visual manipulation. A number of models were tested, and models that define the curvature as a function of length were found to be best suited to manipulation by a user trying to match a model shape to a video image. The model dynamics fitted to the digitized ciliary shapes were intrinsically smooth, completing the first step in bypassing the manual point-by-point tracing. The most commonly used model was one that defined the curvatures at the proximal and distal ends of the cilium as Gaussian functions, and it is the model that will be used in this paper.
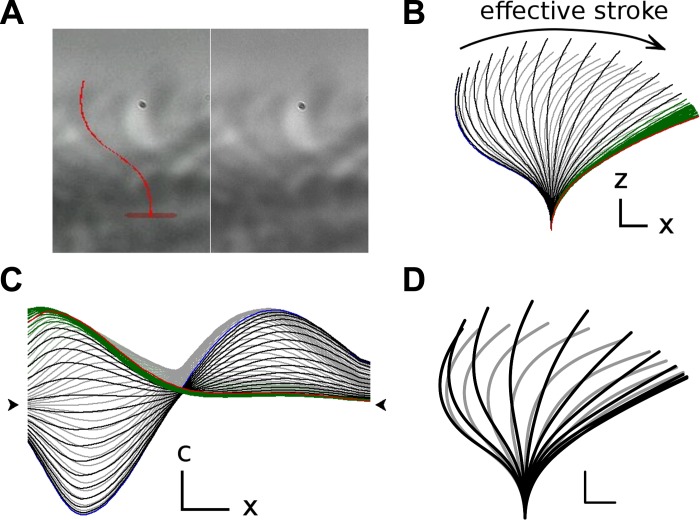
The final step was the development of a system for fitting the graphical model to beating cilia recorded on video. We developed software that implemented the real-time superposition of our empirical models onto running videos of beating cilia combined with the control of all the variables needed to create a fit between the model and the ciliary dynamics (see Supplemental Video 1; supplemental material for this article is available online at the American Journal of Physiology Lung Cellular and Molecular Physiology website). A video of beating cilia with the superimposed model (Fig. 3A) was observed to assess the quality of the fit, and the video was stopped to make adjustments to the model for particular images. The fit between the model and the video was achieved by alternating between these two practices. The dynamics generated (Fig. 3B) were a sequence of shapes controlled by model parameters that changed over time. These changes over time were smooth curves defined by control points, and it was these control points that changed when a user adjusted model dynamics to fit the one seen in the video (Fig. 3C). Composite dynamics (Fig. 3D) were generated by averaging the ciliary shapes relative to the cycle ends from individually extracted dynamics (n = 11). Although the calculations of the model appear complicated, the user was only concerned with the visual task of adjusting a moving shape superimposed over a video. Copies of the software are available from the authors upon request.
Fig. 3.
Reconstructed waveform. The video image (A) of a ciliated cell was viewed with a superimposed model cilium (here in red at the end-recovery position). Left: image when the fit has been completed. The original image without the superimposed model. The waveform was extracted by looking at the video with the superimposed model and adjusting the parameters to match a 2-Gaussian-based model to the original waveform. The result of the waveform reconstruction was a set of curvature parameters for each time point. The ciliary shapes (B) were then calculated from the curvature data (plotted in C as curvature functions of ciliary length). The recovery, effective, and rest phases are drawn in gray, black, and green, respectively. The graphs corresponding to the end-effective and end-recovery times are drawn in red and blue, respectively. D: composite waveform is plotted. It was generated by averaging the shapes from 11 separate empirical waveforms. Scale bars represent 1 μm (x or z in B, C horizontal) and a 1 μm−1 (c in C vertical). The arrow heads in C designate the level with 0 curvature.
For each of the cultures used in creating the composite waveform, there is a Supplemental Video to show the model cilium superimposed on microscopy video images. This is one way the model cilium is seen during the fitting procedure. They all run at 30 fps, which is slowed about eight times relative to the acquisition speed. They are composed of images from one ciliary beat cycle with the model cilium superimposed followed by the same images without the model. The flicker seen while playing the video as a loop has two causes; there is a real mismatch from the beginning of one cycle to the beginning of the next due to the inherent variability of the cycle, and there is a mismatch caused by the use of an integral number of frames to generate the videos. Apart from slightly different lighting conditions due to the variability in the light passing through entire fields of cilia, there is also variability in the ciliary beat frequency over time (35). The images were collected at 250 fps, so the latter mismatch is expected to be about 4 ms or less.
When imaging sheets in profile, it was occasionally possible to distinguish the position of cilia throughout the entire cycle. This was more often the case when the cultures were sparsely ciliated. As can be seen in many of the videos, the physical interaction between the cilia on two different cells does not result in an obviously distorted waveform. The most coordinated ciliary fields were found in densely ciliated areas, and such areas occurred only in cultures that were highly ciliated overall.
In all videos, the tracking of the most coordinated group of cilia through one cycle was favored over tracking individual cilia that may have been more precisely visible but that may not have reflected the motion of the group. It was determined that the best way to visualize the model cilium superimposed over the video images was while watching the video in motion. This allowed the motion of the cilia to guide the eye in a way that is not available with manual frame advance. The analysis was completed by inspecting the videos at 30 fps (one-eighth live speed).
RESULTS
Planar beating.
Information derived from top-down (x,y) and frontal (y,z) views (Fig. 1) of cultured HBE and HNE cells allowed us to determine whether the beat was planar or otherwise. Top-down views of cilia yielded the clearest tracks toward the end of the effective stroke, but the tracks near the end-recovery position were not as clear because of the sigmoid shape of the cilium. Frontal views with the cilia facing the objective (y,z images) gave strong signals during the entire cycle at positions where individual cilia cut through the optical section. These were most useful in determining the extent to which cilia traveled out of plane.
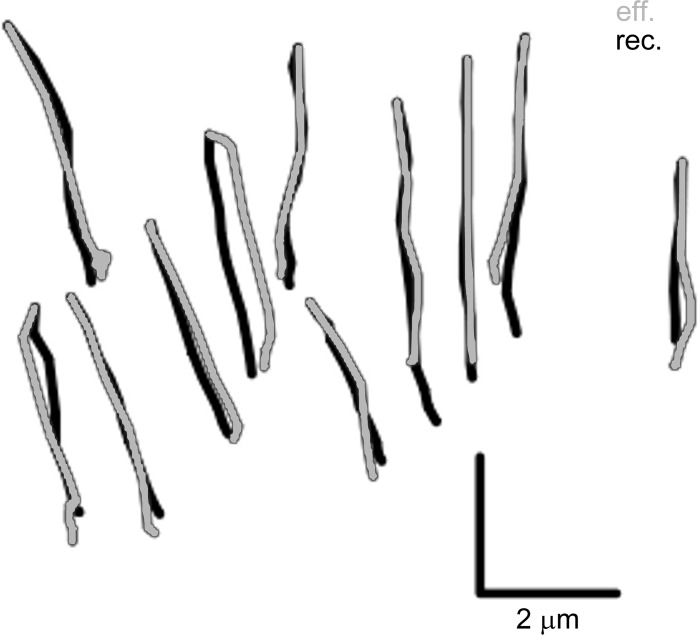
In frontal views, when fully erect at midcycle, cilia lay entirely within the optical section of the objective; otherwise, the point at which the ciliary shaft crossed the optical section was identified by a circular diffraction pattern in the image. During a ciliary beat cycle in these y,z (frontal) views, deviations of the path of the cilium crossing the optical plane would therefore be revealed as side-to-side movements of this circular diffraction pattern. Figure 4 shows manually recorded frontal paths for cilia on one cell, from which we determined that systematic y,z deviations of the cilia crossing the optical section were not significant; rather, linear trajectories of the diffraction pattern were traced out over the course of effective and recovery strokes, and the two overlaid one another. For the 11 cilia of a single cell shown in Fig. 4, the angle difference between the two trajectories was 3.6° ± 4° (mean ± SD), n = 11. Chilvers and O'Callaghan (6) saw a systematic 5.3° deviation with a 3.5° standard deviation for y,z views. Supplemental Video 2 shows frontal videos from three cultures (two bronchial and one nasal) in sequence, and cilia can be seen beating with little deviation from a single plane.
Fig. 4.
Paths of cilia intersecting the optical plane traced from a video showing cilia in frontal view. For each cilium, the place on the video at which it crossed the optical section was recorded for each frame, and the paths were constructed from the time series for each cilium. Unlike for top-down or profile views, it was easy to identify single cilia in frontal view. Most cilia stayed within 1 degree of their mean plane, whereas few cilia had paths that deviated more than 5 degrees.
The two-Gaussian model of the ciliary dynamics.
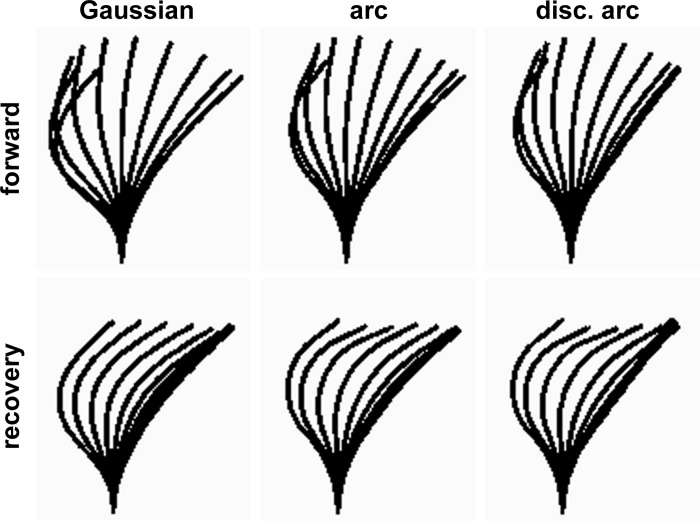
One convenient way to describe the ciliary dynamics was to use the sum of two asymmetrical Gaussian functions describing the curvatures as time-based functions of length along the proximal and distal sections of the cilium (Equation 1), c(l,t) = ∑ai(t)exp[−(l − pi(t))2/si(l,t)], where ai is the amplitude of curvature, pi is its central position along the proximal or distal cilium, and si is either of two scale parameters, with si = si,l if l ≤ pi, or si,h if l > pi. Because we used two Gaussians, a set of eight parameters (ai, pi, si,l, and si,h, i = {1,2}) therefore fully defined the ciliary shape at each point in a beat cycle. Each parameter was changed smoothly over time by a set of control points. A complete ciliary cycle consisted of all the control points. For normal waveforms, only six control points were needed for the a and p parameters, whereas the s parameters could all be kept constant. The two-Gaussian model is an empirical model that provides parameters useful from the point of view of the person doing the fitting. It is not meant to describe the internal mechanics of the cilia. Although we have chosen to restrict the presentation to the two-Gaussian model, the software provides other models that can be used to extract the observed dynamics, and some dynamics will require these other models. In particular, modeling the dynamics of mammalian flagella would require circular arcs that propagate distally. Figure 5 shows dynamics extracted from a video using three different models: the two-Gaussian model presented here, a model using two circular arcs instead of the two Gaussians, and a model using two arcs with parameters that are discontinuous over time (see Supplemental Video 3). The discontinuity in the third model allows the modeling of the propagation distally with a jump back to the proximal end for the next cycle. This is a feature that would be required to model flagella with many arcs. The differences between the extracted dynamics in Fig. 5 result from variability introduced by the software user rather than from the inability of any of the models to generate the desired shapes.
Fig. 5.
Empirical models describing normal ciliary dynamics. The choice of the model used to describe ciliary or flagellar dynamics will depend first on the ability of the model to represent the dynamics and second on the conceptual usefulness of the model to the person doing the fitting. The columns show 3 of the models developed for the fitting software. Top: effective phase (forward). Bottom: recovery phase. Left: 2-Gaussian model used in this paper (Gaussian). Middle: 6-parameter model that describes the waveform as 2 circular arcs each with a constant curvature for a particular shape, a start position, and an end position (arc). Right: (disc. arc), a similar model is shown in which the parameters are allowed to have discontinuities over time. This allows an arc to be propagated distally and then jumped back to the proximal end for “reuse” during a later cycle. The same cycle and position on the video was fitted in each case so that the variability seen comes from the combination of differences in the models and the differences in user action during fitting. None of the differences could be attributed to differences in the models.
The two-Gaussian model has eight parameters available to handle a wide range of shapes. In practice, a fit is started with a standard waveform and adjusted as needed. The standard waveform contains preset p and s parameters that have been found to be usable for all normal waveforms so far. It has constant s parameters set at the following values: s1,l = s1,h = 2.194 μm, s2,l = s2,h = 3.867 μm. The a and p parameters for this waveform vary over time, and six control points are used (Table 1). Several fitting procedures were timed, and it was found that, for an experienced user starting from a vertical nonmotile cilium, the fit could be achieved in 15 to 20 min. Starting from the standard waveform, only 8 min were required. Several caveats apply. The software has a minimal user input interface so that the learning curve is steep. An inexperienced user would currently require a long time to achieve such speed. Second, unusual waveforms can take a much longer time to fit than expected because of the interplay between parameters when they all require changing. Finally, for each fit, much more time was spent processing the video images, deciding which cycles to use, and looking up frame rate and magnification values than doing the actual fitting itself. All these issues are unrelated to our system of superimposing an empirical model over video images to extract a waveform. Presumably, much of this extra time is due to the nature of the development process and could be streamlined. Supplemental Video 1 shows the software as it appears during a fitting procedure. The image with the superimposed model are shown in the top left. Below this, a scale shows the time in the video (vertical yellow bar), the main cycle (horizontal purple bar), and the limits of other cycles. Below this is a graph over time of the parameter that was selected to be altered (red) with the control points (green dots). At the bottom, yellow markers show adjustable time points for the end of the effective/forward phase, the end of the recovery phase, and the start of the rest phase. At right top, the current full forward phase (at left in red and blue) and recovery phase (at right in green) is shown with the shape for the current time highlighted. Below this (still at right) several parameter graphs can be seen at the same time. In this case, a1, p1, and the constant s1,l and s1,h parameters. This allows the continuous monitoring of many of the changes resulting from stopping the video and altering the parameter value at a particular time or moving a control point along the time axis. The user would run the video with the superimposed model, stop the video at a time that was not well matched, alter the parameter that would best improve the match, and repeat. The greatest benefit of this procedure was the ability to match a moving shape to the motion seen in the video rather than tracing a single shape on each static frame of the video. Although videos with hundreds of closely packed cilia per cell will always present a challenge for the extraction of waveforms, the procedure presented here consistently gave waveforms that appeared to give a better and faster fit compared with videos that were fitted by static fitting and for which the shapes were then superimposed over the original video and observed in motion.
Table 1.
Starting and composite two-Gaussian parameters used in Eq. 1
| Control Points | Fractional Cycle Time | a1, μm−1 | p1, μm | a2, μm−1 | p2, μm |
|---|---|---|---|---|---|
| Starting Parameters | |||||
| 1 | 0.00000 | 0.54011 | 0.62585 | 0.08872 | 4.44922 |
| 2 | 0.22300 | 0.04933 | 0.69162 | 0.38339 | 4.10976 |
| 3 | 0.50000 | −0.43649 | 1.34122 | 0.50942 | 4.88524 |
| 4 | 0.59525 | −0.16149 | 1.63209 | 0.21424 | 5.23502 |
| 5 | 0.71050 | 0.27102 | 1.86896 | 0.04406 | 5.51480 |
| 6 | 0.87400 | 0.51723 | 1.36275 | 0.01912 | 4.96477 |
| Composite Parameters | |||||
| 1 | 0.00000 | 0.42511 | 0.62585 | 0.08872 | 4.45522 |
| 2 | 0.22300 | −0.07467 | 0.83162 | 0.38339 | 4.10976 |
| 3 | 0.50000 | −0.48149 | 1.34122 | 0.50942 | 5.01024 |
| 4 | 0.59525 | −0.19649 | 1.60509 | 0.30924 | 5.23502 |
| 5 | 0.71050 | 0.23602 | 1.86896 | 0.07906 | 5.51480 |
| 6 | 0.87400 | 0.42723 | 1.36275 | 0.01912 | 4.96477 |
The starting parameters were used when starting a fit. The composite parameters were derived from 11 normal waveforms. The a and p parameters were variable. The s parameters were constant for these two sets: s1,l = s1,h = 2.194 μm, s2,l = s2,h =3.867 μm.
General properties of the dynamics.
Ciliary curvatures seen in profile views were defined to be positive for bends in the direction of flow, i.e., of the effective stroke. Oriented with flow to the right, the proximal cilium, that portion adjacent to the cell surface, develops positive values of curvature during the effective stroke, and negative values during the recovery stroke (Fig. 3). The distal cilium, however, is asymmetric, developing positive curvature only during the recovery stroke. Hence, at the end of the recovery stroke, the cilium possesses negative curvature proximally and positive curvature distally (Fig. 3D), whereas, at the end of the effective stoke, it possesses positive curvature proximally while it is more or less straight distally (Fig. 3D). Notably, because the central section does not develop curvature during the ciliary cycle, there is an apparent absence of propagation of curvature from base to tip as occurs in flagella; however, an internal propagating mechanism is not precluded.
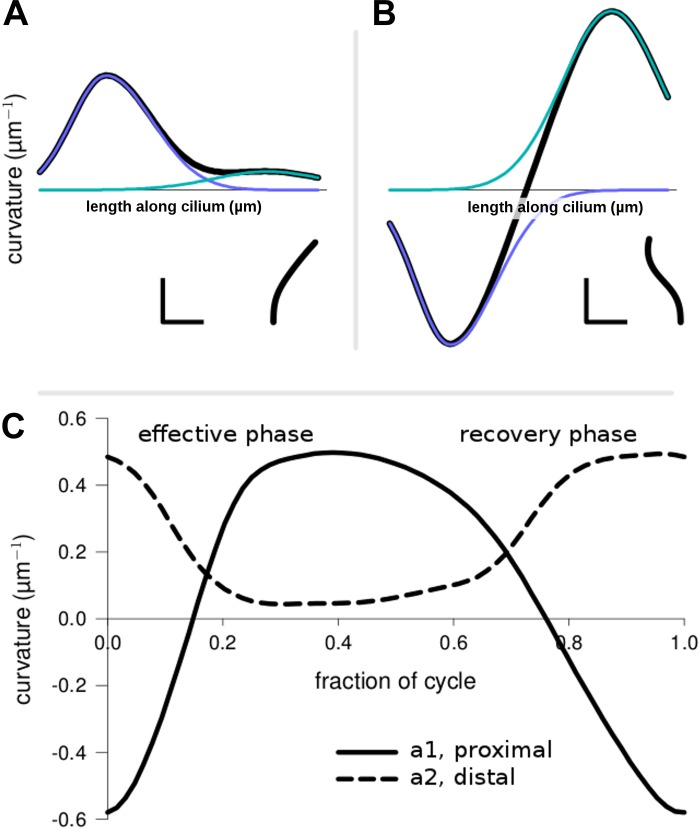
The parameters used during cycle dynamics extraction (Eq. 1) offer the point of view taken by the software user and can be interpreted by considering how they define the curvature and hence the ciliary shape. Figure 6, A and B, shows how the Gaussians are related to the overall curvature and associated ciliary shapes. Figure 6C shows how the Gaussian amplitude of curvature parameters, a1 and a2, change over time. Of all the parameters, these parameters had the clearest sequence of changes. From the start of the effective phase, both amplitudes moved toward zero curvature as the cilium assumed an erect posture at midcycle. The proximal amplitude continued through to positive values without any noticeable break as the cilium approached the end-effective stroke, whereas changes in the distal amplitude became negligible as it approached zero. Curved sections propagated distally, locally, along the cilium for part of the cycle, but did not propagate over its entire length. However, some changes were distally directed locally along the cilium for part of the cycle.
Fig. 6.
Waveform as defined by the 2-Gaussian parameters. A and B: curvature is graphed as a function of length along the cilium for 2 different shapes. Inset: corresponding shape. The proximal (blue) and distal (green) Gaussian curves are defined by the parameters in Eq. 1. The scale bars are 1 μm (horizontal) and 1 μm−1 (vertical). C: most important parameters, curvature amplitudes (ai) during the effective and recovery strokes, are plotted over 1 cycle. The graph starts at the end-recovery position when a parameters had large magnitudes and opposite signs. For this waveform, the a2 parameter never became negative, which was the case with most extracted waveforms.
Creation of the composite dynamics and assessment of variability.
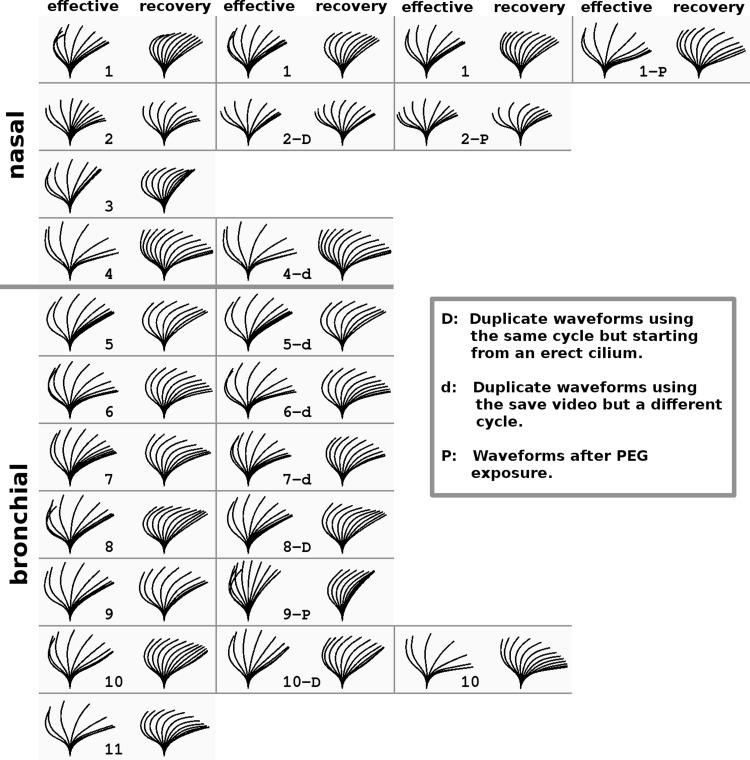
Eleven cultures were analyzed to create composite dynamics for further analysis (Table 1). Because no major differences between nasal and bronchial waveforms were apparent, the composite waveform was created from the combined sets. In addition, a number of data extractions was performed to investigate the variability arising from the imaging of the cultures and the fitting procedures. Figure 7 shows all the dynamics from all the cultures used in this analysis. The dynamics of each of the cultures are shown in Supplemental Videos. Variability in the data was assessed in three ways by simple, qualitative examination of waveform patterns. First, variability from one cycle to another was assessed for Cultures 4–7 by analyzing two different cycles within a single video record and altering the fitting parameter from the first cycle so as to match the second (marked d in the figure). In most cases, no significant change could be discerned in the fitting parameters, and at most a small change was required to a single parameter. The similarity of these paired analyses is reflected in a visual inspection of waveform patterns, which appear practically identical even though changes were made to the parameters of some waveforms (Fig. 7, Cultures 4–7). Second, ciliary waveforms recorded in different fields of view (Fig. 7, Cultures 1 and 10; indicated by the sequence of repeated numbers) were inspected to assess the variability among different groups of cilia. Again, the resulting waveform patterns appear very similar to identical. Third, a major concern was analyses being affected by cilia crossing the focus plane, such that a single set of cilia might not be followed throughout the cycle. Because of their large depth of field, commonly used phase-contrast videos tend to mask this effect, and our DIC videos showed it to be a frequent problem. We found that the presence of polyethylene glycol increased the coordination of the cilia and thus made it easier to discern the cilia during the beat cycle. Cilia dynamics extracted in such conditions are shown for Cultures 1, 2, and 9 in Fig. 7 (marked with a P) and Supplemental Videos 7–9. This technique may be useful in comparing cilia from different samples; however, it needs to be tested rigorously for potential artifacts. Waveforms extracted following polyethylene glycol exposure in Cultures 1 and 2 were very similar visually to those recorded before exposure, but the postexposure waveform of Culture 9 was affected significantly.
Fig. 7.
Eleven cultures were used to create the composite waveform. In addition, the cultures were refitted after imaging in different places and conditions. Also, some cycles were fitted twice, keeping the model cilium in the same position but starting from a constant vertical cilium. Each waveform is shown in a bordered panel with the effective phase on the left and the recovery phase on the right. The cultures are numbered sequentially in the panels with all the nasal cultures presented first and separated from the bronchial cultures with a double panel border. Two panels with identical culture labels refer to 2 fittings from different videos of the culture done at different times. In addition, some panels have a culture number followed by -d, -D, or -P and refer to a change to be compared with the waveform in the adjacent panel to the left. Duplicate fits (-d) done on the same video but using a different cycle show the variability due inherent in the cycle and in having to reposition the cilium (Cultures 4−7). Sometimes no useful change in the waveform was found. Duplicate fits (-D) done on the exact same cycle but starting from a constant vertical cilium describe the variability that comes purely from the user attempting to fit the cilium to a particular motion seen in the video (Cultures 2, 8, and 10). Duplicate fits (-P) that were done on a culture after it was exposed to polyethylene glycol (PEG, MW 8 × 10³) have videos in the Supplemental Videos that show how PEG tends to increase coordination of cilia, making an accurate fitting of PEG-exposed cilia easier than for cilia beating in plain buffer. Each of the videos shows the culture before PEG exposure and then after. Culture 1-P (Supplemental Video 7) shows the cilia during the washout of 40% PEG, which completely stopped motion. Culture 2-P (Supplemental Video 8) shows cilia exposed to 15% PEG. They are very easy to track, but the PEG has caused excessive clumping of cilia. Culture 9-P (Supplemental Video 9) shows cilia exposed to 30%. This was an almost ideal exposure; the ciliary coordination was greatly improved without the clumping seen in Culture 2-P even though the PEG concentration was higher. Other culture-specific factors may have been responsible for the differences seen.
A quantitative assessment of variability was made for the waveforms of the 11 cultures used to construct the composite ciliary waveform and for duplicate analyses of single waveforms of Cultures 2, 8, and 10 conducted on separate days (duplicate fits are marked D in the figure and in Supplemental Videos 4–6). These latter analyses all started with an initial set of parameters representing a straight, vertical cilium, rather than the standard set of starting parameters, which were generally used for more efficient throughput. Variability in ciliary waveforms was assessed by comparing the cilia at four positions in the waveform (Table 2). The end-recovery and end-effective positions, taken as the extreme positions reached at each end of the waveform, are most sensitive to extremes in shape and to the amplitude of the waveform. The other two points, taken during the effective and recovery periods where ciliary velocity was at its highest, and referred to in Table 2 as fast-effective and fast-recovery, are most sensitive to the acceleration of cilia. These latter points occur close to the centerline and are highly sensitive to acceleration during the two phases. For each analysis, a pair of ciliary waveforms was assessed for point by point differences in position (x,z) along the length of the cilium, expressed in μm, for each of the four positions, with the data presented as a simple average for all the points. For the 11 cultures whose ciliary waveforms contributed to the composite standard waveform, the analysis compared each individual waveform against the standard waveform. For example, the variability of the 11 cilia in the end-recovery position of the waveform, expressed as the average difference in position relative to the standard waveform, was 0.31 ± 0.04 μm (mean ± SE; Table 2). Note that the measure of variability is the mean difference itself and that the standard error represents a measure of the precision of our estimate. This variability in end-recovery position comes from both the fitting procedure and the natural variability of the waveform between cultures. The variability estimated for the end-effective shapes was similarly small (0.25 ± 0.06 μm). However, the variabilities estimated for the fast-effective and fast-recovery positions were larger (0.50 ± 0.12 and 0.50 ± 0.10, respectively) as might be expected because ciliary motility is maximal at those points in the respective phases. The variabilities (differences) calculated for the 11 waveforms were normally distributed for the shapes at all four positions. Ciliary beat frequency was purposely ignored in this analysis, as it is commonly examined independently of waveform analysis to evaluate other aspects of ciliary function.
Table 2.
Mean differences between points on corresponding shapes (μm) with standard errors (SE) where appropriate
| Waveforms Making Up the Standard (n = 11) |
Duplicate Waveforms (n = 3) |
Waveforms from Fig. 11 Panels |
||||||
|---|---|---|---|---|---|---|---|---|
| Mean | SE | Mean | SE | Panel A | Panel B | Panel C | Panel D | |
| End-recovery | 0.31 | 0.04 | 0.43 | 0.05 | 1.60 | 2.05 | 1.74 | 0.25 |
| End-effective | 0.25 | 0.06 | 0.18 | 0.11 | 1.06 | 1.72 | 1.24 | 0.89 |
| Fast-effective | 0.50 | 0.12 | 0.89 | 0.42 | 0.56 | 0.89 | 1.48 | 0.49 |
| Fast-recovery | 0.50 | 0.10 | 0.60 | 0.25 | 0.18 | 0.23 | 2.45 | 0.51 |
Waveforms making up the standard and waveforms from Fig. 11 are compared to the standard waveform.
Variability of the fitting procedure itself was estimated for cilia from three cultures (Fig. 7, Cultures 2, 8, and 10) by calculating the differences in position between duplicate analyses of a single waveform, conducted on different days, with each beginning with a straight, vertical cilium (Table 2, duplicate waveforms). The differences are generally similar to those from the individual waveforms compared with the standard (for example 0.43 μm compared with 0.31 μm for end-recovery shapes) although the fast-motion differences are slightly higher and may be due to the lower number of fits.
Waveform comparisons.
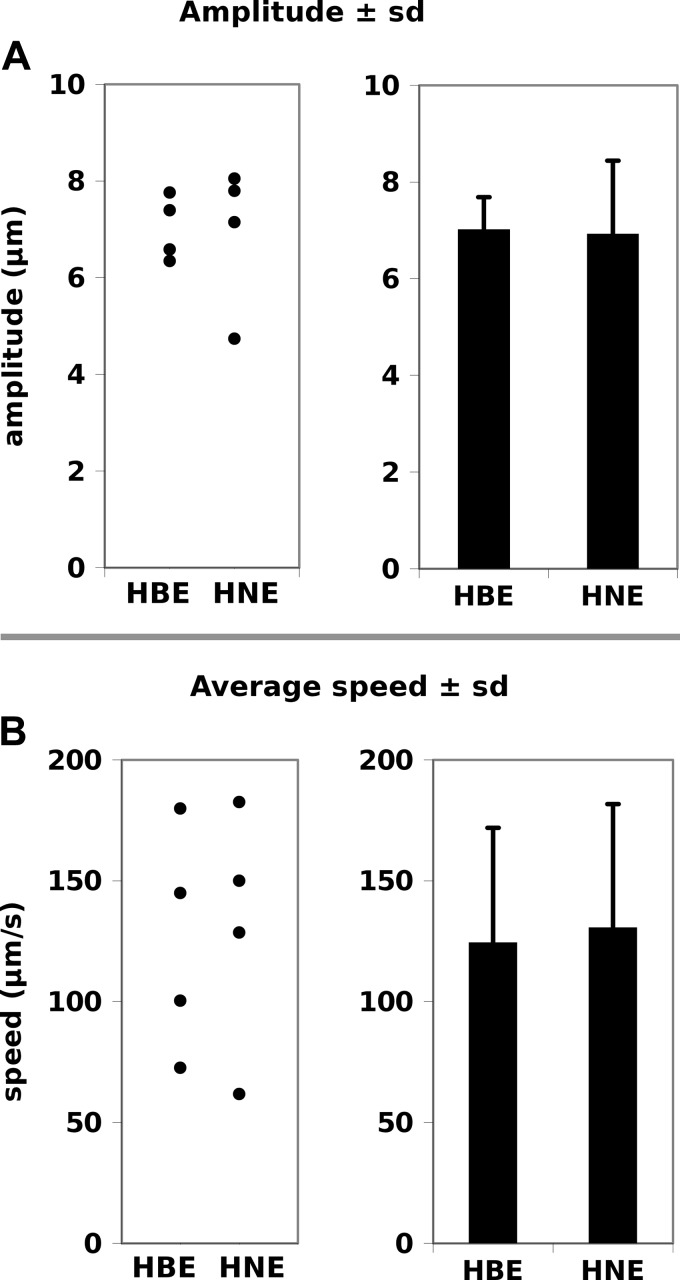
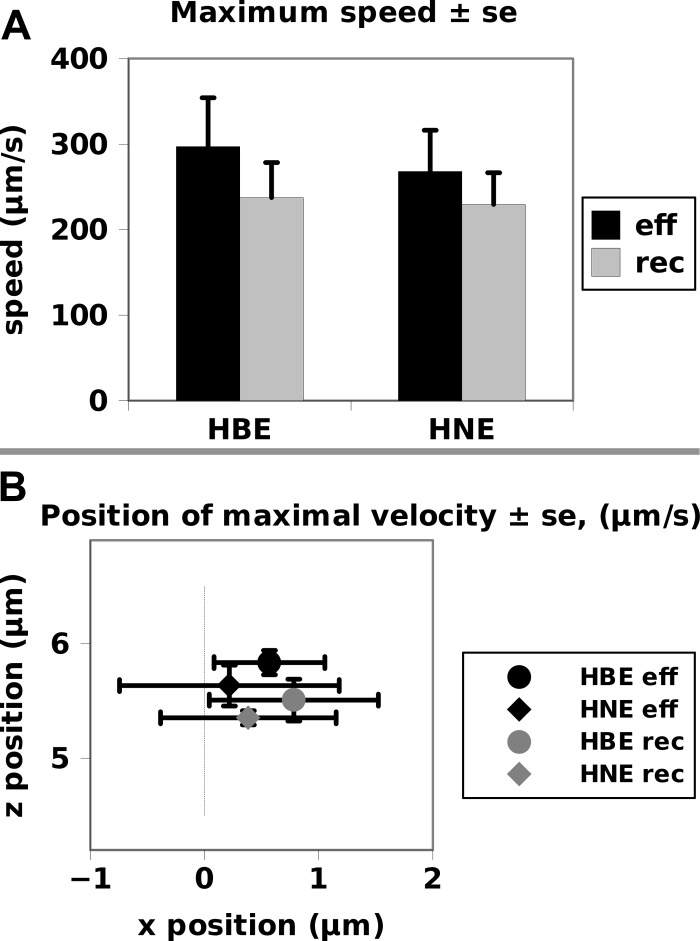
The main use of a smooth empirical model is to make comparisons between samples or to test dynamics derived from theoretical first principles. A separate set of videos were used to see if statistical differences could be found in the dynamics from nasal and bronchial epithelial cultures (Figs. 8 and 9). Both the amplitude of the ciliary beat of (Fig. 8A, 6 to 8 μm) and the average speed of the ciliary tip (Fig. 8B, 80 to 180 μm/s) were similar for five bronchial (HBE) and five nasal (HNE) cells. The maximal tip speed reached during the effective and recovery strokes was not statistically different between the two types of cells (Fig. 9A) although the nasal cells had slightly lower averages in both directions. The same pattern was seen in looking at where in space the cilia reached their maximum velocity (Fig. 9B). The most striking property observed in both cell types was how small the difference in height was between the reach of the cilia at the height of the effective relative and recovery phases when cilia where at their maximum velocity for that phase. Considering the variability seen in the fitting from one waveform to the other in Fig. 7, we can conclude that the dynamics of bronchial and nasal cells were not significantly different.
Fig. 8.
Amplitude of ciliary waveform (A) and average speed of cilia (B). In each case the individual datum points are shown on the left. Human bronchial epithelial cells (HBE) and human nasal epithelial (HNE) appeared similar.
Fig. 9.
Maximal speed attained during the effective and recovery phases (A) and the location in space at which that speed was attained (B). The difference between the bronchial and nasal maximum speed was not statistically significant, but the trend was for nasal cells to have a marginally lower maximum speed (A). There was no difference in the position at which this speed was attained (B). In both cases, the maximum speed was reached within 1 micrometer of the center position on the downstream side of mucus flow.
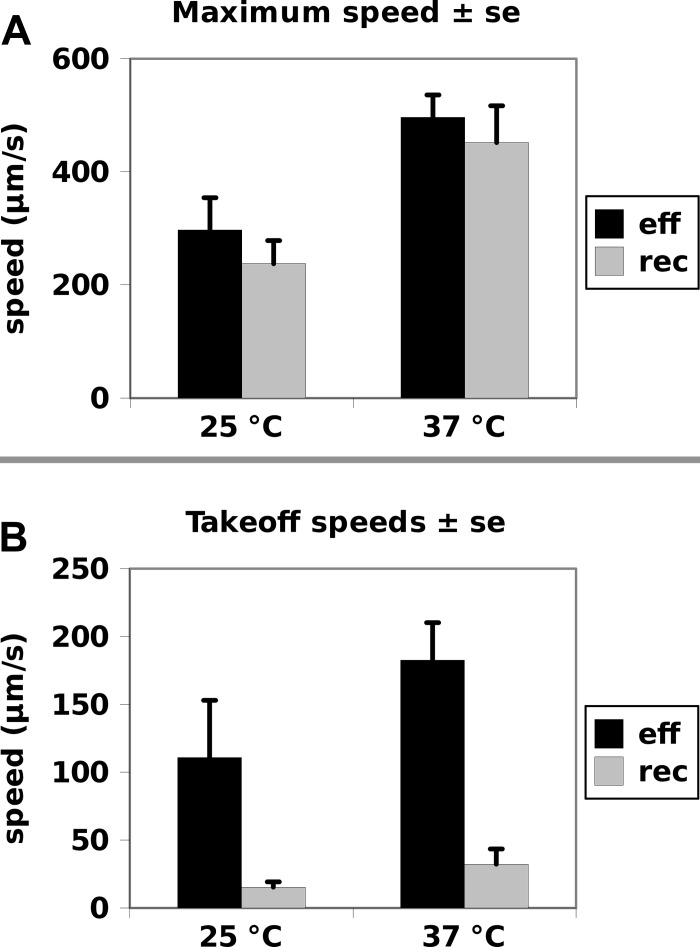
We also extracted dynamics from bronchial epithelial cultures before and after the temperature was increased from 25°C to 37°C, and several properties were found to differ between these dynamics (Fig. 10). When the temperature was increased to 37°C, the maximum speed during both the effective and recovery phases increased similarly (to ∼450 μm/s) although the increase in speed was slightly higher for the recovery phase (Fig. 10A). However, in analyzing a number of ciliary cycle properties, it was found that the greatest difference between the response of the effective and recovery phases occurred at the switch from the recovery to the effective phase (Fig. 10B). The initial speed of the effective stroke after the switch increased from 110 μm/s to 170 μm/s. The initial speed during the recovery phase is much lower (10 μm/s), and it increased to 30 μm/s. Changes in the timing of the phases did not result in ciliary shapes that appeared different.
Fig. 10.
Bronchial cultures, maximum speed (A) and takeoff speed (B) of the 2 phases at 25 and 37°C for the effective and recovery phases. The maximum speed increased with temperature as expected (A). The takeoff speed was defined as the speed in the first 0.4 ms of the phase. The takeoff speeds were much higher for the effective phase and increase much more in absolute terms in response to the increase in temperature.
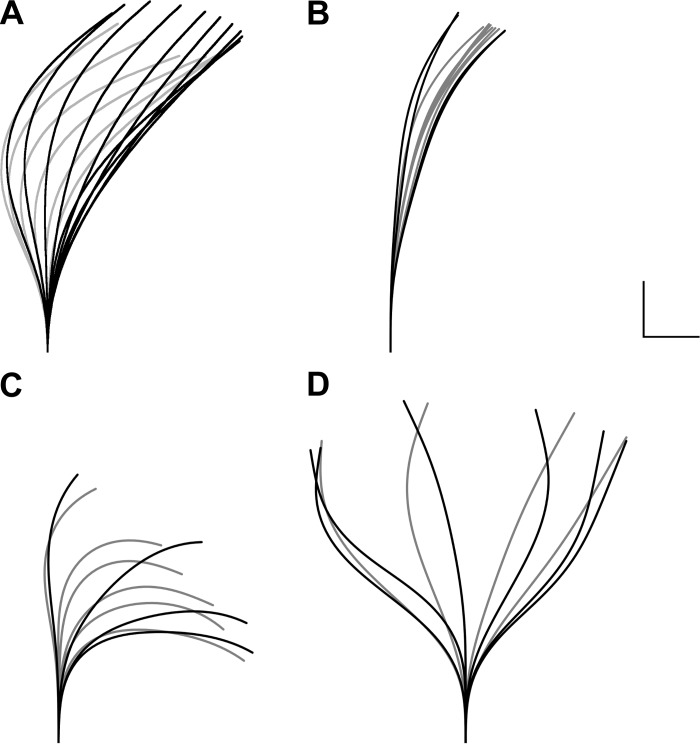
Finally, we looked at waveforms for which there was a definite difference in ciliary shapes at particular positions in space. Figure 11 shows four waveforms for which velocities normalized for ciliary beat frequency, beat amplitudes, and shear profiles give values outside of the variability expected from the fitting procedure. Figure 11A shows a waveform in 20% dextran (MW = 2 × 10⁶). The proximal negative curvature at the end of the recovery is much more strongly affected than the other curvatures. The other waveforms come from single cycles of cells from donors with primary ciliary dyskinesia. Three types are shown for which the waveforms show differences outside the acceptable range for a normal waveform. In Fig. 11B none of the curvatures developed to the level seen in normals, whereas in Fig. 11C only the forward curvatures did. In Fig. 11D, a relatively symmetrical waveform was observed so that significant distal curvature could be observed in both directions. The rightmost columns in Table 2 show the mean differences of the four Fig. 11 waveforms relative to the standard waveform. Waveforms from Fig. 11, A–C, all have differences that are outside three standard deviations in the standard waveform. For example, a mean difference of 1.60 μm for the Fig. 11A end-recovery shape can be compared with an expected mean difference of 0.31 μm for a normal shape. This is much greater than the mean + 3SD (0.74 μm, not in table) or the maximum of all differences calculated (0.51 μm, not in table) for the end-recovery shape. This also holds for the end-effective shape in Fig. 11D. Also, these values are all greater than the maximum differences calculated from any of the normal waveforms that went into generating the standard. The fast-motion differences are more difficult to compare because of the greater variability in the standard. However, here also the differences in fast-effective shapes for Fig, 11, B and C, and the fast-recovery shape for Fig. 11C are outside three standard deviations in the standard. As expected, the waveform with the closest amplitude to the standard (Fig. 11D) is still distinguished by the end-effective shape.
Fig. 11.
Waveforms with parameters outside the normal range of variability. A: waveform obtained from culture exposed to 20% dextran (MW = 2 × 10⁶) and most similar to the normal beat. Unlike the simple timing changes due to temperature changes, this waveform had a greatly decreased end-recovery proximal curvature. B–D: dyskinetic waveforms from 3 different donors. The structural defects associated with the altered waveforms were not known although the waveform in C was suspected to be an inner dynein arm defect. In B, the waveform only develops a single low-amplitude curvature. In C, there are phases analogous to the effective and recovery phases of normal waveforms, but the negative curvatures never fully develop on the proximal portion of the cilium. In D, a full amplitude waveform can be seen, but there is no recognizably distinct effective or recovery phase.
Ciliary velocity profiles.
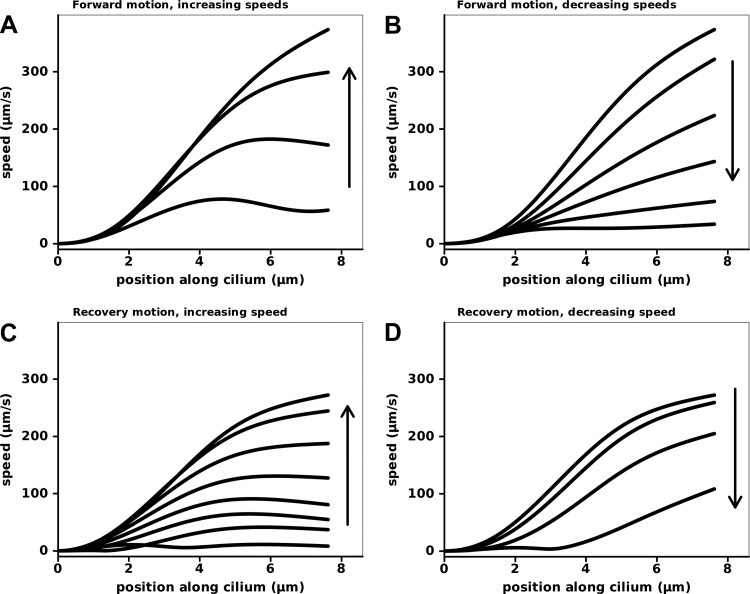
The mechanism by which cilia propel fluid is of great interest and depends on ciliary shape dynamics. To examine ciliary motion that is relevant to fluid dynamics, we plotted the velocity profile along the cilium at regular time intervals in Fig. 12. This was done using the composite waveform normalized to 10 Hz. The beginning of the effective phase was marked by a rapid increase in speed of the cilium, with a tip speed that reached 373 μm/s by the mideffective phase (Fig. 12A, top). The peak speed during the recovery phase reached 272 μm/s. Also, this portion of the cilium does not present as great an area to the fluid during the recovery phase because a larger fraction of the velocity vector is parallel to the ciliary axis (Fig. 3). The maximal tip velocity during the effective phase had an effective motion of 357 μm/s perpendicular to the ciliary axis and an ineffective motion of 111 μm/s tangent to the axis. The maximal tip velocity during the recovery phase had a motion of 136 μm/s perpendicular to the ciliary axis and 236 μm/s tangential. This analysis emphasizes that the asymmetry between the effective and recovery stroke velocities is strongly related to the aspect the cilium presents to the fluid. Whereas the magnitude of the velocity was 37% faster during the effective phase (373 vs. 272 μm/s), the difference is much greater when viewed in terms of the perpendicular component (162% faster during the effective phase, 357 vs. 136 μm/s) and the axial component (113% greater during the recovery phase, 236 vs. 111 μm/s). The perpendicular component should be highly effective in moving fluid and the axial component effective at moving the cilium without moving fluid. This is especially relevant considering that, in vivo, the cilium may be contacting the viscous mucus only at the times of high velocity associated with the effective phase. As Bayly et al. show (2, 3), these data can be combined with hydrodynamic analyses to assess propulsive forces.
Fig. 12.
Ciliary velocity profiles for the effective (A and B) and recovery (C and D) strokes. The speed of ciliary segments are plotted against their position along the cilium for evenly spaced times throughout the cycle. Each trace shows the speed profile at 1 point in time. The traces are plotted separately for increasing and decreasing speeds, as the cilium approached mid-phase and end-phase respectively. The left-most ends of the traces do not move, as they represent the proximal cilium, whereas the right-most ends map the ciliary tip velocities.
Doublet displacement.
Although shear angle has traditionally been used in describing ciliary dynamics, the displacement of doublets can be estimated given the geometry of the axoneme. Doublet microtubule displacements during the beat cycle were calculated by integrating curvature over the length of the cilium, assuming that certain structural changes would not be significant. Specifically, it was assumed that the relative doublet positions in the local x,y plane did not change and that the doublets did not slide relative to one another at the basal body.
The cross-sectional geometry used for the calculations is shown in Fig. 2. The displacement was calculated for a putative B-link binding site on the B-tubule relative to the anchoring position for a dynein on the A-tubule. The outer dyneins were placed on the A-tubule 127° to the outside of the A-B axis of the doublet. The B-link binding site was positioned at the closest point on the adjacent B-tubule. Reporting the displacement for doublet i relative to doublet i + 1 made the displacement direction analogous to displacements of cytoplasmic dynein on microtubules.
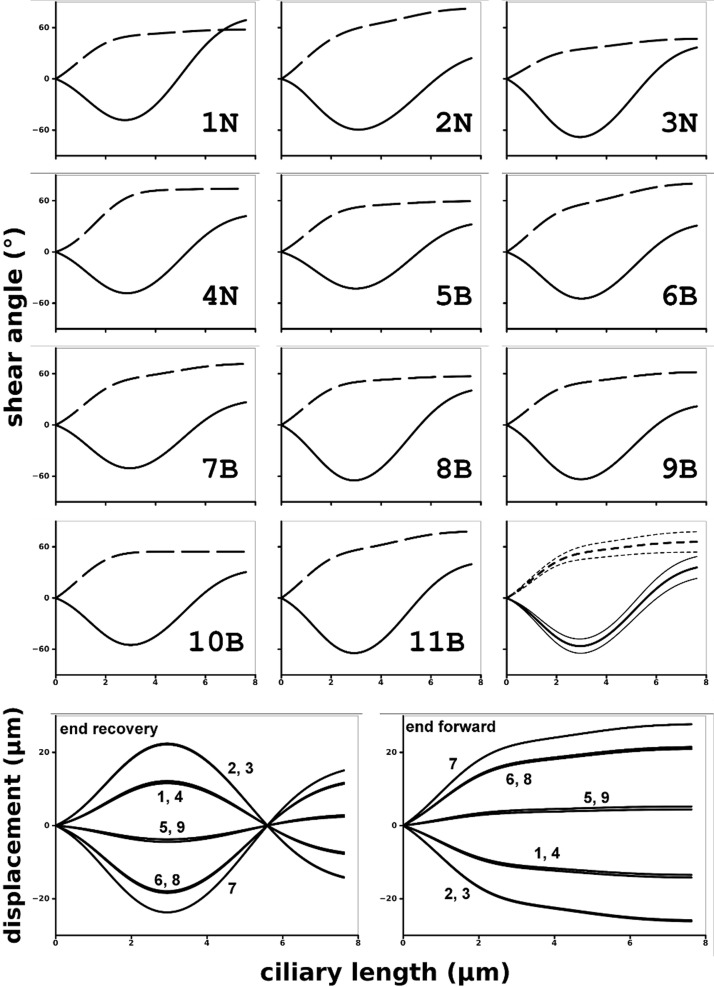
Figure 13 shows the shear angle profile for the end-effective and -recovery positions for every waveform used in creating the composite waveform (numbered by culture number in Fig. 7) as well as for the composite waveform itself (Fig. 3D). Figure 13 also shows the resulting displacement profiles for each of the axonemal doublets at the end-effective and end-recovery positions. At the end-effective position, the most lateral doublets moved more than 20 nm (Fig. 13, bottom, right). At the end of the recovery stroke, they had a similar maximal displacement in the opposite direction (Fig. 13, bottom, left).
Fig. 13.
Shear angles for end-effective (dashed) and end-recovery (solid) positions for the 11 waveforms used in constructing the standard model, shear angles for the standard model itself (after 11B), and microtubule doublet displacements for all doublets for the standard model (bottom). Given the cross-sectional tracks that the doublets follow, the relative positions of the doublets were calculated according to the geometry shown in Fig. 2. The displacements are for an outer arm dynein base anchor position relative to a probable B-link binding site on the adjacent doublet. The displacement graphs are labeled with the corresponding doublet numbers. With the effective stroke generally moving the cilium in the +x direction (Fig. 1), the cross-bridges with the largest negative and positive displacements would be the lateral ones respectively closest to the -y (stem anchored to doublet 3) and +y (doublet 7) axes. Because dynein is a minus-end directed microtubule motor, a forward-bending motion would require dynein activity on the -y-axis side of the axoneme at some time.
As expected, lateral doublets had especially large displacements, but it was also true that most doublets had a significant displacement. Generally, the doublets did not travel more than a few tubulin dimers (8 nm) and, in the proximal 1.5 μm of the cilium, where changes in curvature were greatest, there was not enough sliding to allow any 8 nm steps. Significantly, the central section of the cilium that remained straight for much of the cycle experienced the largest displacements during both the effective and recovery strokes.
Doublet sliding speed.
Because of the high number of variables likely involved in the control of the ciliary beat, we used multivariate visualization to aid the elucidation of control mechanisms, as has been done in the modeling of ciliary-driven fluid flows (32) and metachronal wave formation (21). These techniques have not been used previously on experimental data because of the lack of the smooth data sets they require. The inherent smoothness of our empirical dynamics allowed the mapping of doublet sliding velocities to the sweep area of the effective stroke.
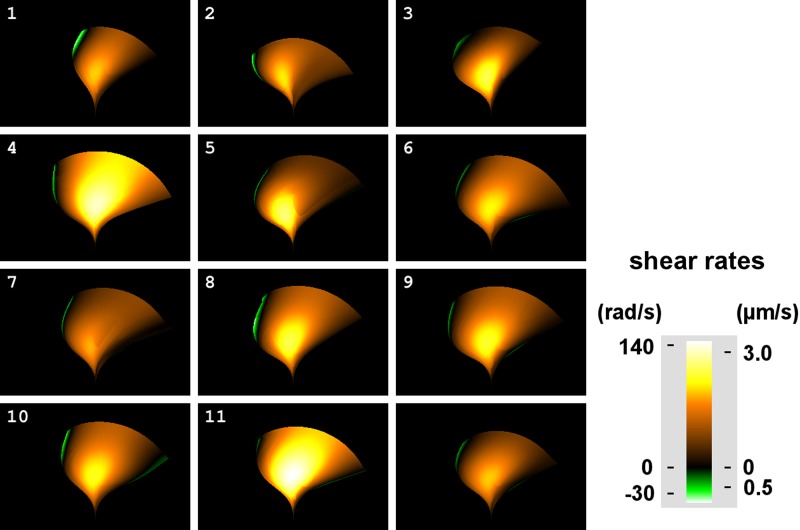
Figure 14 shows the shear rates and microtubule sliding velocities for doublets 3 and 4 (refer to Figs. 2 for geometry and 13 for displacements) for each of the waveforms included in the composite waveform as well as for the composite itself. Doublets 3 and 4 were chosen for the following reasons. First, the displacement between these doublets was in the direction of the A-tubule traveling toward the minus end of the adjacent B-tubule, analogous to the direction cytoplasmic dynein would travel with the A-tubule of doublet 3 as its cargo while walking on the B-tubule of doublet 4. Second, a displacement between doublets 3 and 4 was greatest when comparing all doublet pairs with an identical direction. Because our model did not include deformations of the cross-sectional geometry of the axoneme or the compression or stretching of the doublets, the shear rates along the cilium were linearly related to the doublet sliding velocities, so we also included the shear rate scale.
Fig. 14.
Profile sweep area shear angle and doublet sliding rates. For each position (x,z) on the graph, the corresponding time and length along the cilium were used to determine the relative speed of doublets 3 and 4. These speeds were then plotted according to the color scale to the right with the marks denoting sliding speeds in μm/s. The geometric model used to calculate the speeds linearly relates a particular doublet displacement to shear angle. The shear angle rates corresponding to sliding speeds for doublet 3 are provided on the left side of the scale (radians/s).
According to Satir's switch point hypothesis (27, 28), many dyneins on doublet 3 should be active during the effective phase, and any such unconstrained activity would result in high velocities in Fig. 14. However, the areas showing high velocities in the figure do not necessarily correlate with active areas. They could be the result of adjacent active areas or of relaxation of the cilium. The maximal effective stroke doublet sliding speed for the composite waveform was 2.0 μm/s (87 rad/s). The highest maximal doublet sliding speed we calculated was 3.3 μm/s (no. 11). The lowest was 1.9 μm/s (no. 7). Interestingly, the highest sliding velocities occurred in the central portion of the cilium over the same area. Although the tip velocity was at its greatest during the fast effective phase, the peak sliding velocities occurred late in that phase. We did not investigate possible sliding restrictions at the ciliary tip because the data do not allow differentiation of the many possible ways a passive restriction would relate to the active dynein forces responsible for the shapes characteristic of the effective and recovery strokes.
DISCUSSION
Planar beating.
The ciliary beat seen here in cultured human airway epithelia was clearly planar (Fig. 4). Few cells were found with cilia beating out of plane, even when cilia were interfering with each other, as they frequently do in cultures. In the experiments of O'Callaghan and coworkers (6), human ciliated borders from nasal scrapes also showed a planar beat with a systematic out-of-plane component that was small. Marino and Aiello (20) reported an out-of-plane recovery stroke making a 60–80° angle with the cell surface in an analysis of high-speed videos of human explants showing metachronal waves. To our knowledge, there are no other reports of out-of-plane beating from human epithelial cells. There has been evidence for out-of-plane beating in other organisms. The best evidence has come from scanning electron microscopy, where the rate of fixative penetration was assumed to be fast enough to capture out-of-plane components (29).
Extraction of waveforms by altering parameters of an empirical model.
For those waveforms that are determined to be planar, mammalian ciliated epithelial sheets still present a great problem for the extraction of the waveforms because of the density of cilia. The procedure we developed offers two benefits. Incorporating the combined visualization of the model and the video of the beating cilia greatly facilitates the generation of a fitted waveform. Also the ability to manipulate entire shapes using parameters that are meaningful to the software user and the feedback of seeing how this changes the fit to the video greatly increases the speed of the fit.
PCD.
The multi-Gaussian model combined with the superposition-fitting procedure will be most useful for the analysis of planar PCD beat patterns and beat patterns that appear near normal upon simple inspection but that are suspected of resulting in reduced mucus flow velocities. It would not be suitable for the analysis of phenotypes that produce nonplanar dynamics or dynamics that are inconsistent from one beat to the next.
Especially interesting is the possibility of making structure-function correlations with known dynein mutations. The localization of some axonemal proteins to subsections of the axoneme has already been reported. DNAH9, a component of outer dynein arms, has been localized to the distal axoneme (10). DNAH5, which is also a component of outer dynein arms and which is normally associated with the entire axonemal length (10, 30), has been either excluded from the axoneme or restricted to its proximal section depending on the type of PCD mutation, and the severity of the functional defect has been correlated with the extent of DNAH5 present (30). The use of the two-Gaussian method to get precise ciliary dynamics from PCD cilia with known subsectional alterations in axonemal components can help elucidate the function of the involved components. For example, dynamics resulting from DNAH9 lesions may help explain its role in the generation of the complicated distal shape changes, and DNAH5 partial localization may define its role in proximal vs. distal curvature generation.
Component disruptions that do not have a gross electron micrograph (EM) phenotype can still cause ciliary dyskinesia. DNAH11 is a component of outer dynein arms and has been found to cause PCD without disruptions in EM-visible components and without alteration in the localization of DNAH5 or DNAH9 (30). Precise analysis of the DNAH11 phenotype may reveal one way the cilia achieve their highly asymmetric dynamics or extreme curvatures. The same type of analysis performed on PCD dynamics from cells without gross EM defects may reveal functions of axoneme-associated proteins.
Application of the empirical model to sliding velocity calculations.
Manual analysis of videos of cilia suffers from three disadvantages. It is time consuming, it yields nonsmooth records that are not amenable to direct analyses such as curvature analysis, and it has no image-to-image coupling, i.e., the degree to which a recording method enforces the progression of the model from one image to the next. Not only did the superposition method described make the analysis more tractable and precise, it offered a smooth data set that permitted the fine-grained calculations necessary for the construction of Figs. 12, 13, and 14, from which functional insights were gained. As an example, Satir (27) described how reproductions by trial and error of the ciliary dynamics of Paramecium by Sugino and Naitoh (1982, 1983) suggested modifications to the original switch point hypothesis. Here we used the smooth data sets to calculate microtubule sliding velocities.
The mideffective stroke speed that we calculated for the central portion of the cilium in the standard waveform was 2.0 μm/s with a maximum in one of the individual waveforms of 3.3 μm/s. Studies in which microtubule velocities are measured as they slide over surfaces coated with dynein or over extruded axonemal doublets generally report velocities around 5.0 μm/s (e.g., Ref. 14 for Chlamydomonas axonemal dynein, Ref. 19 for extruded bovine sperm axonemes). Studies in which axonemes are partially proteolyzed and reactivated to allow doublet extrusion generally report velocities of around 20–25 μm/s (e.g., Refs. 14 and 15 for Chlamydomonas). The higher velocities may be due to the altered geometry of the axoneme, potentially accentuated dynein doublet interactions, and a lack of axonemal or microtubule bending. For dynamics extracted from beating flagella, Brokaw and Kamiya (5) measured shear angle rates of 340 radians/s in Chlamydomonas using the forward swimming (cilium-like) dynamics, for which Kurimoto and Kamiya, using 4.5–6 nm as the functional inter-doublet distance, calculated a velocity of 15–20 μm/s (15). These velocities are also higher than those we calculated, as expected because they were calculated for flagella beating with a frequency of 60 Hz. Importantly, Seetharam and Satir (31) reported that high-speed recording from Tetrahymena axonemes absorbed onto glass had microtubule velocities with short bursts at 196 μm/s followed by pauses that resulted in an average of 10 μm/s. Hence, the sliding velocities we calculate for the normal human ciliary dynamics may not relate directly to the dynein cycle, but rather to the damped axonemal response resulting from its bending under the conditions of a load.
General applications of waveform extraction system.
The system presented here provides a way to extract waveforms from epithelia where cilia are densely packed. Because such cilia cannot be analyzed with automated systems, a measure of the variability expected in the measurements also has great importance. We have presented a system to facilitate the extraction of such waveforms, a standard waveform to be used for comparison with altered waveforms, and measures of variability sensitive to both the amplitude of the waveform and the timing of shape changes. We have used this system to compare nasal and bronchial waveforms and waveforms at two temperatures and noted only minor changes in the intrinsic shapes of the waveforms. We have also used the variability measures to analyze waveforms that were conclusively different (under viscous load or due to defects). Finally, we used the smooth representation possible from our empirical model to analyze velocity profiles and doublet sliding speeds.
GRANTS
The project was supported by grants HL071798 and U54HL096458 from the National Heart Lung and Blood Institute.
DISCLOSURES
No conflicts of interest, financial or otherwise, are declared by the authors.
AUTHOR CONTRIBUTIONS
Author contributions: P.R.S., M.R.K., and C.W.D. conception and design of research; P.R.S. and K.T. performed experiments; P.R.S. and K.T. analyzed data; P.R.S., M.R.K., and C.W.D. interpreted results of experiments; P.R.S. prepared figures; P.R.S. drafted manuscript; P.R.S., M.R.K., and C.W.D. edited and revised manuscript; P.R.S., M.R.K., and C.W.D. approved final version of manuscript.
Supplementary Material
ACKNOWLEDGMENTS
Present address for K. Thompson: Institute of General Physiology, University of Ulm, Ulm, Germany.
REFERENCES
- 1. Baba SA, Mogami Y. An approach to digital image analysis of bending shapes of eukaryotic flagella and cilia. Cell Motil 5: 475–489, 1985 [Google Scholar]
- 2. Bayly PV, Lewis BL, Kemp PS, Pless RB, Dutcher SK. Efficient spatiotemporal analysis of the flagellar waveform of Chlamydomonas reinhardtii. Cytoskeleton 67: 56–69, 2010 [DOI] [PMC free article] [PubMed] [Google Scholar]
- 3. Bayly PV, Lewis BL, Ranz EC, Okamoto RJ, Pless RB, Dutcher SK. Propulsive forces on the flagellum during locomotion of Chlamydomonas reinhardtii. Biophys J 100: 2716–2725, 2011 [DOI] [PMC free article] [PubMed] [Google Scholar]
- 4. Brokaw CJ. Bending patterns of ATP-reactivated sea urchin sperm flagella following high salt extraction for removal of outer dynein arms. Cell Motil Cytoskeleton 42: 125–133, 1999 [DOI] [PubMed] [Google Scholar]
- 5. Brokaw CJ, Kamiya R. Bending patterns of Chlamydomonas flagella: IV. Mutants with defects in inner and outer dynein arms indicate differences in dynein arm function. Cell Motil Cytoskeleton 8: 68–75, 1987 [DOI] [PubMed] [Google Scholar]
- 6. Chilvers MA, O'Callaghan C. Analysis of ciliary beat pattern and beat frequency using digital high speed imaging: comparison with the photomultiplier and photodiode methods. Thorax 55: 314–317, 2000 [DOI] [PMC free article] [PubMed] [Google Scholar]
- 7. Chilvers MA, Rutman A, O'Callaghan C. Ciliary beat pattern is associated with specific ultrastructural defects in primary ciliary dyskinesia. J Allergy Clin Immunol 112: 518–524, 2003 [DOI] [PMC free article] [PubMed] [Google Scholar]
- 8. Dillon RH, Fauci LJ. An integrative model of internal axoneme mechanics and external fluid dynamics in ciliary beating. J Theor Biol 207: 415–430, 2000 [DOI] [PubMed] [Google Scholar]
- 9. Eshel D, Brokaw CJ. New evidence for a “biased baseline” mechanism for calcium-regulated asymmetry of flagellar bending. Cell Motil Cytoskeleton 7: 160–168, 1987 [DOI] [PubMed] [Google Scholar]
- 10. Fliegauf M, Olbrich H, Horvath J, Wildhaber JH, Zariwala MA, Kennedy M, Knowles MR, Omran H. Mislocalization of DNAH5 and DNAH9 in respiratory cells from patients with primary ciliary dyskinesia. Am J Respir Crit Care Med 171: 1343–1349, 2005 [DOI] [PMC free article] [PubMed] [Google Scholar]
- 11. Fulcher G, Burns YR. Well-differentiated human airway cultures. Method Mol Med 107: 183–206, 2005 [DOI] [PubMed] [Google Scholar]
- 12. Gueron S, Levit-Gurevich K. Computation of the internal forces in cilia: application to ciliary motion, the effects of viscosity, and cilia interactions. Biophys J 74: 1658–1676, 1998 [DOI] [PMC free article] [PubMed] [Google Scholar]
- 13. Hoops HJ, Witman GB. Outer doublet heterogeneity reveals structural polarity related to beat direction in Chlamydomonas flagella. J Cell Biol 97: 902–908, 1983 [DOI] [PMC free article] [PubMed] [Google Scholar]
- 14. Kikushima K. Central pair apparatus enhances outer-arm dynein activities through regulation of inner-arm dyneins. Cell Motil Cytoskeleton 66: 272–280, 2009 [DOI] [PubMed] [Google Scholar]
- 15. Kurimoto E, Kamiya R. Microtubule sliding in flagellar axonemes of Chlamydomonas mutants missing inner- or outer-arm dynein: velocity measurements on new types of mutants by an improved method. Cell Motil Cytoskeleton 19: 275–281, 1991 [DOI] [PubMed] [Google Scholar]
- 16. Lindemann CB. A model of flagellar and ciliary functioning which uses the forces transverse to the axoneme as the regulator of dynein activation. Cell Motil Cytoskeleton 29: 141–154, 1994 [DOI] [PubMed] [Google Scholar]
- 17. Lindemann CB, Macauley LJ, Lesich KA. The counterbend phenomenon in dynein-disabled rat sperm flagella and what it reveals about the interdoublet elasticity. Biophys J 89: 1165–1174, 2005 [DOI] [PMC free article] [PubMed] [Google Scholar]
- 18. Livraghi A, Randell SH. Cystic fibrosis and other respiratory diseases of impaired mucus clearance. Toxicol Pathol 35: 116–129, 2007 [DOI] [PubMed] [Google Scholar]
- 19. Lorch DP, Lindemann CB, Hunt AJ. The motor activity of mammalian axonemal dynein studied in situ on doublet microtubules. Cell Motil Cytoskeleton 65: 487–494, 2008 [DOI] [PubMed] [Google Scholar]
- 20. Marino MR, Aiello E. Cinemicrographic analysis of beat dynamics of human respiratory cilia. Prog Clin Biol Res 80: 35–39, 1982 [DOI] [PubMed] [Google Scholar]
- 21. Mitran SM. Metachronal wave formation in a model of pulmonary cilia. Comput Struct 85: 763–774, 2007 [DOI] [PMC free article] [PubMed] [Google Scholar]
- 22. Noone PG, Leigh MW, Sannuti A, Minnix SL, Carson JL, Hazucha M, Zariwala MA, Knowles MR. Primary ciliary dyskinesia: diagnostic and phenotypic features. Am J Respir Crit Care Med 169: 459–467, 2004 [DOI] [PubMed] [Google Scholar]
- 23. Rikmenspoel R, Isles CA. Digitized precision measurements of the movements of sea urchin sperm flagella. Biophys J 47: 395–410, 1985 [DOI] [PMC free article] [PubMed] [Google Scholar]
- 24. Rossi AH, Salmon WC, Chua M, Davis CW. Calcium signaling in human airway goblet cells following purinergic activation. Am J Physiol Lung Cell Mol Physiol 292: L92–L98, 2007 [DOI] [PubMed] [Google Scholar]
- 25. Sanderson MJ, Dirksen ER. A versatile and quantitative computer-assisted photo-electronic technique used for the analysis of ciliary beat cycles. Cell Motil 5: 267–292, 1985 [DOI] [PubMed] [Google Scholar]
- 26. Satir P. Morphological aspects of ciliary motility. J Gen Physiol Suppl 50 241–258, 1967 [DOI] [PMC free article] [PubMed] [Google Scholar]
- 27. Satir P. Switching mechanisms in the control of ciliar motility. Modern Cell Biol 4: 1–46, 1985 [Google Scholar]
- 28. Satir P. The role of axonemal components in ciliary motility. Comp Biochem Physiol A 94: 351–357, 1989 [DOI] [PubMed] [Google Scholar]
- 29. Satir P. Mechanisms of ciliary movement: contributions from electron microscopy. Scanning Microsc 6: 573–579, 1992 [PubMed] [Google Scholar]
- 30. Schwabe GC, Hoffmann K, Loges NT, Birker D, Rossier C, de Santi MM, Olbrich H, Fliegauf M, Failly M, Liebers U, Collura M, Gaedicke G, Mundlos S, Wahn U, Blouin JL, Niggemann B, Omran H, Antonarakis SE, Bartoloni L. Primary ciliary dyskinesia associated with normal axoneme ultrastructure is caused by DNAH11 mutations. Hum Mutat 29: 289–298, 2008 [DOI] [PubMed] [Google Scholar]
- 31. Seetharam RN, Satir P. High speed sliding of axonemal microtubules produced by outer arm dynein. Cell Motil Cytoskeleton 60: 96–103, 2005 [DOI] [PubMed] [Google Scholar]
- 32. Smith DJ, Gaffney EA, Blake JR. A model of tracer transport in airway surface liquid. Bull Math Biol 69: 817–836, 2007 [DOI] [PubMed] [Google Scholar]
- 33. Weaver A, Hard R. Newt lung ciliated cell models: effect of MgATP on beat frequency and waveforms. Cell Motil 5: 377–392, 1985 [DOI] [PubMed] [Google Scholar]
- 34. Woolley DM, Vernon GG. Functional state of the axonemal dyneins during flagellar bend propagation. Biophys J 83: 2162–2169, 2002 [DOI] [PMC free article] [PubMed] [Google Scholar]
- 35. Zhang L, Sanderson MJ. Oscillations in ciliary beat frequency and intracellular calcium concentration in rabbit tracheal epithelial cells induced by ATP. J Physiol 546: 733–749, 2003 [DOI] [PMC free article] [PubMed] [Google Scholar]
Associated Data
This section collects any data citations, data availability statements, or supplementary materials included in this article.


