

Abstract
It is well known that discharge of neurons in the primary motor cortex (M1) depends on end-point force and limb posture. However, the details of these relations remain unresolved. With the development of brain-machine interfaces (BMIs), these issues have taken on practical as well as theoretical importance. We examined how the M1 encodes movement by comparing single-neuron and electromyographic (EMG) preferred directions (PDs) and by predicting force and EMGs from multiple neurons recorded during an isometric wrist task. Monkeys moved a cursor from a central target to one of eight peripheral targets by exerting force about the wrist while the forearm was held in one of two postures. We fit tuning curves to both EMG and M1 activity measured during the hold period, from which we computed both PDs and the change in PD between forearm postures (ΔPD). We found a unimodal distribution of these ΔPDs, the majority of which were intermediate between the typical muscle response and an unchanging, extrinsic coordinate system. We also discovered that while most neuron-to-EMG predictions generalized well across forearm postures, end-point force measured in extrinsic coordinates did not. The lack of force generalization was due to musculoskeletal changes with posture. Our results show that the dynamics of most of the recorded M1 signals are similar to those of muscle activity and imply that a BMI designed to drive an actuator with dynamics like those of muscles might be more robust and easier to learn than a BMI that commands forces or movements in external coordinates.
Keywords: muscle activity, wrist movement, single-neuron recording, brain-machine interface, electromyography
there has been a debate in the field of motor control for many years about the extent to which neurons in the primary motor cortex (M1) encode end-point forces or limb postures in addition to the end-point motion itself. Since the seminal experiments of Evarts (1968) and Georgopoulos et al. (1982), many groups have found evidence of both the muscle-like signals described by Evarts and the hand movement signals suggested by Georgopoulos et al. (Crutcher and Alexander 1990; Fu et al. 1995; Kalaska et al. 1989; Thach 1978) as well as a variety of more complex temporal patterns (Churchland and Shenoy 2007). Kakei and colleagues (1999) studied wrist movements using the changes that occur when the forearm is rotated to dissociate movement variables intrinsic to the limb from those fixed to external, world coordinates. They found a large group of M1 neurons they described as “extrinsic like,” having preferred directions (PDs) that did not rotate with the forearm and another, somewhat smaller group of muscle-like neurons whose PDs rotated with the muscles.
The theoretical debate over muscles and movement has taken on more practical overtones in the past decade with the development of the brain-machine interface (BMI). Typically, BMIs aim to decode neural signals to control an external actuator such as a computer cursor or prosthetic limb. With a few notable exceptions, most current BMIs focus on kinematic control signals. If it is true that neurons in the M1 contain a significant amount of muscle-related information, it would be appropriate to design BMIs that exploit this information. Our group has recently demonstrated a BMI that restores grasp function to monkeys during temporary paralysis of forearm and hand muscles through functional electrical stimulation controlled by M1 recordings (Ethier et al. 2012). Several other groups have shown that muscle- or force-related signals can be predicted from the activity of simultaneously recorded neurons (Carmena et al. 2003; Fagg et al. 2009; Gupta and Ashe 2009; Kim et al. 2007) beginning as early as the seminal work of Humphrey et al. (1970). Further exploration of the development of these kinetic BMIs, together with the more theoretical study of M1-encoding properties, is clearly warranted.
We have adopted an isometric wrist task and found that most M1 neurons respond to forearm rotation in a manner intermediate to the behavior of muscles and extrinsic coordinates, but much closer to the former than the latter. There was no indication of a bimodal distribution of neurons with different properties. While this is in contrast to the results of Kakei et al. (1999), it is in closer agreement with the intermediate coordinate frame described by another isometric wrist study that compared M1 neurons and spinal interneurons (Yanai et al. 2008). Furthermore, when we used the activity of many simultaneously recorded neurons to predict electromyographs (EMGs), we discovered that most of these predictions generalized across forearm postures nearly as well as they did within a given posture. The same was not true of the prediction of end-point force expressed in extrinsic coordinates. These results suggest that a BMI using signals that closely approximate native signals in the M1 could provide control that generalizes more naturally across varied posture and external loading than one using motor commands predicted in an external coordinate system.
METHODS
Behavioral task.
We recorded data from four male Rhesus macaque monkeys (monkeys OR, EO, KD, and SP) trained to sit in a primate chair that faced a computer monitor and to perform an isometric wrist task using the right hand. The upper arm was constrained largely to a parasagittal plane with the elbow at a 90° angle and the forearm horizontal. The monkey's wrist was maintained in line with his forearm by securing his hand into a box, which was custom fit with padding to minimize movement. A 6-degrees-of-freedom torque cell was mounted onto the box, such that the axes of measurement aligned with those of the wrist, as shown in Fig. 1. The torque cell rotated with the box, and we compensated for the resulting rotation of the extrinsic coordinate end points in software. Cursor movement was proportional to the force along the flexion-extension and radial-ulnar deviation axes.
Fig. 1.

Isometric wrist task and recording array locations. A and B: the monkey's right hand was placed into a custom-fit box, which had an opening that allowed him to extend and flex his fingers. A six-axis strain gauge was mounted at the point of rotation of the wrist, as indicated by the crosshairs. The orientation of the box rotated between the midposture (A) and prone posture (B). The labels indicate the intrinsic joint coordinates that cause rotation in the designated world coordinates in both postures. For example, in the midposture, wrist flexors moved the cursor to the left, whereas in the prone posture, leftward force required radial deviation. C: array placements within the hand area of the primary motor cortex (M1) for the four monkeys (monkeys OR, EO, KD, and SP).
The task required the monkey to move the cursor from a central target to one of eight peripheral targets separated by 45°. The force targets were set for each monkey to be submaximal (∼30–50% maximum voluntary contraction) to reduce the development of fatigue. To initiate a trial, the monkey held the cursor in the central target (requiring no force) for 0.5 s, after which a randomly selected outer target appeared. The monkey was required to move the cursor to the outer target within 5 s and to maintain that force for 0.5 s to receive a juice reward. Actual time to enter the target was typically 0.5–1.0 s. The task was performed with the forearm in either the fully pronated posture or midway between prone and supine (“midposture”). Initially, monkeys were trained primarily with the forearm in the midposture. However, they soon became equally proficient in the prone posture. The task training period before the experiments presented here was 2 mo for monkeys OR and KD and 4 mo for monkeys EO and SP.
Surgery.
After training, an array composed of 100 1.5-mm microelectrodes in a 10 × 10 grid (Blackrock Microsystems) was chronically implanted in the hand area of the left M1, contralateral to the hand used for the task. We determined the implant site by sulcal patterns and using surface cortical stimulation intraoperatively as an additional guide. Array locations for the four monkeys are shown in Fig. 1C.
In a separate procedure, the monkey had bipolar, intramuscular electrodes implanted into most of the muscles that contributed to wrist torque. These included the following major wrist muscles: flexor carpi ulnaris (FCU), flexor carpi radialis (FCR), extensor carpi ulnaris (ECU), and extensor carpi radialis (ECR) as well as the following extrinsic finger muscles: flexor digitorum superficialis (FDS), flexor digitorum profundus (FDP), and extensor digitorum communis (EDC). Each muscle was implanted with two pairs of electrodes. Electrode locations were verified during surgery by stimulating each lead. We did not monitor pronator, supinator, or proximal arm muscles, but it is unlikely that they contributed significantly to torques about the wrist, in part because of the very high accuracy of the end-point force predictions made with the recorded muscles.
All surgeries were performed under isoflurane gas anesthesia (1–2%) except during cortical stimulation, for which the monkeys were transitioned to reduced isoflurane (0.25%) in combination with remifentanil (0.4 μg·kg−1·min−1 continuous infusion). Monkeys were administered antibiotics, anti-inflammatories, and buprenorphine for several days after surgery. All surgical and experimental procedures were consistent with the National Institutes of Health Guide for the Care and Use of Laboratory Animals and approved by the Institutional Animal Care and Use Committee of Northwestern University.
For reasons that are not entirely clear, electrodes implanted in FCU did not record reliable or consistent EMG signals from any of the monkeys. We recorded enough useful FCU data from monkey OR to determine its mean muscle change in PD between forearm postures (ΔPD), but not for monkeys EO, KD, or SP. However, even with its relatively low signal-to-noise ratio, with sufficient training data, FCU provided some useful information when used as an input to the EMG-to-force decoders for monkeys KD and SP.
Monkey OR had unacceptably noisy EMG recordings on roughly half of the electrode pairs after the initial EMG implant. Eight months after the implant, we repaired the leads by cutting and resoldering the EMG electrodes to a new connector. As in surgery, muscles were identified by the action elicited upon stimulation of a given electrode. The repair improved our ability to record EMG signals from most muscles.
Data collection and analysis.
We recorded force signals and neural activity using a 128-channel Cerebus system (Blackrock Microsystems). Action potential waveforms and their corresponding timestamps were discriminated using Offline Sorter (Plexon Neurotechnology Research Systems). Some sessions also included EMG recordings, which were amplified, band-pass filtered (4-pole, 50–500 Hz), and sampled at 2,000 Hz. Subsequently, the EMG was digitally rectified and low-pass filtered (4-pole, 10 Hz, Butterworth) and subsampled to 20 Hz. Additional analysis was done primarily using Matlab (The Mathworks).
We divided our analyses into two sections. The first analysis evaluated the altered responses of individual neurons and muscles in two different forearm postures. The second type of analysis addressed the effect of the forearm rotation on our ability to predict EMG and force signals from multiple discriminated neurons.
Single-neuron analysis: tuning of discharge for isometric force in different directions.
Data for these analyses comprised multiple sessions of neural recordings together with at least one session that included concurrent EMG recording for each of the four monkeys. We used only EMG data collected after the repair of the connector for monkey OR. We calculated tuning curves for both neurons and muscles from these data sets for each forearm posture using the mean discharge during the 0.5-s target hold time associated with each of the eight targets. We fit the tuning curve with a cosine and took the peak value as the PD. To determine the quality of this tuning, we computed the R2 value of a sinusoidal fit to the mean signal magnitude across targets. We considered neurons and muscles well tuned for R2 > 0.62 (P = 0.02). We used bootstrap resampling to determine a 95% confidence bound on each PD by computing the distribution of PDs for 1,000 resamples (Davison and Hinkley 1997; Stevenson et al. 2011). Only those neurons and muscles that were well tuned and had a confidence bound of less than or equal to ±25° were included in the analyses of single response properties.
One difference between the experiments we present here and those of Kakei et al. (1999) is the time period in which measurements were made. They used a 100-ms window immediately before the movement onset. Most of our data were collected during the hold period to provide a relatively long, stable measurement period. However, we also calculated PDs within 300-ms windows for a range of times beginning 100 ms after the go cue (approximately at the movement onset) and extending through the hold period. Corresponding EMG measurements were made 50 ms later than the neural measurements to account for the transmission delay from cortical discharge to muscle activity. We used the longer measurement window to reduce the Poisson spike noise in the estimates.
Population analysis: prediction of EMG and end-point force.
In addition to the analyses of single-neuron characteristics, we studied how the activity of populations of simultaneously recorded neurons contributed to the motor output. The BMI field has developed the use of “decoders” that compute predicted kinematic signals from the firing rate of simultaneously recorded neurons. We constructed similar decoders to predict EMG signals using two data sets each from monkeys KD and SP, each of which included concurrent neuronal and EMG recordings in both postures. We also included data from monkey OR in the within-posture prediction statistics. However, those data sets did not include the data required for cross-posture prediction.
We used a Wiener cascade (Hunter and Korenberg 1986), which consisted of a multiple input, dynamic linear system followed by a static nonlinearity. Each impulse response was a causal linear filter of 0.5-s length. The nonlinearity was implemented by fitting a second-order polynomial between the linear prediction and the recorded data and then applying that polynomial to the linear output. The nonlinearity effectively introduced a threshold that decreased low-level noise while also increasing the gain at peak predictions. We calculated decoders with either neurons or EMGs as inputs and either EMG or force as outputs. Unlike the single-neuron analyses, here we included all recorded neurons as inputs, regardless of tuning or confidence bound intervals. Likewise, when EMGs were used as inputs, signals from all available wrist and finger muscles were used, regardless of tuning. In some cases, two signals from the same muscle were included. This resulted in 14 EMGs for monkey KD and 12 EMGs for monkey SP.
To distinguish the effects of neuromuscular and musculoskeletal properties, we also implemented a two-stage decoder that consisted of a cascade of two linear filters. The first stage was a linear dynamical neuron-to-EMG decoder, whereas the second stage was an EMG-to-force decoder. We applied a single static nonlinearity at the end. In the first (neuron-to-EMG) stage, we calculated predictions both within and across postures. The second stage took the predicted EMGs as inputs and predicted force, always using the within-posture decoder with respect to the signals being predicted. This served essentially to transform EMG predictions accurately into force in external coordinates to facilitate visualization and comparison to single-stage, neuron-to-force predictions.
We used these decoders to calculate multifold, cross-validated predictions. For the within-posture decoders, each minute of the 20-min file was predicted using a decoder computed from the other 19 min of data. The cross-posture decoder was constructed from a 20-min file recorded in one posture and was used to predict each minute of a 20-min file in the other posture. We quantified the goodness of fit between the actual and predicted signals by calculating the variance in the EMG or force signal accounted for by the decoder output [termed “variance accounted for” (VAF)] according to the following equation:
| (1) |
where N is the number of samples in the data set, xi is the actual signal, x̂i is the predicted signal, and x̄ is the mean of the actual signal. Note this measure's similarity to the R2 statistic. The difference is that this measure reaches unity only with an exact match between the observation and the prediction (rather than with only a perfect linear correlation). In addition, because the numerator can become larger than the denominator, very poor fits can result in negative VAF. We calculated VAF independently for each EMG signal. For force, we calculated a two-dimensional VAF comparing the Euclidean distance between the actual and predicted signals.
RESULTS
We collected neural, force, and EMG data from four monkeys (monkeys OR, EO, KD, and SP), with neural and EMG data recorded simultaneously during at least one of the recording sessions for each monkey. We did a series of experiments that consisted of 20-min data sets recorded in both midposture and prone posture, presented in random order. The 20 min included ∼20 successful acquisitions of each of the 8 targets. Between 42 and 110 neural signals were recorded during a given session, and sessions for the different monkeys spanned days to months (Table 1). Given the typical stability of the recorded neurons, it is likely that some neurons were represented more than once because at least two of the recording sessions from each monkey were separated by only 1 day. By not counting those neurons that were recorded on the same electrode on sequential days, we can arrive at a very conservative estimate of the lower limit of the number of unique neurons. By this count, at least 55% of the neurons represented here are unique. Only well-tuned neurons with 95% PD confidence bounds <25° were included in subsequent PD analyses. This reduced the number of neurons in a given session to between 10 and 45 neurons, as shown in Table 1.
Table 1.
Summary of neural data from each monkey
| Monkey OR | Monkey EO | Monkey KD | Monkey SP | |
|---|---|---|---|---|
| Number of sessions | 4 | 2 | 5 | 7 |
| Time span | 9 mo | 3 days | 4 mo | 4 mo |
| Number of recorded neurons | 71 ± 10 | 46, 42 | 96 ± 14 | 78 ± 19 |
| Number of well-tuned neurons | 40 ± 4 | 17, 21 | 53 ± 15 | 43 ± 7 |
| Number of well-tuned, high-confidence neurons | 31 ± 6 | 10, 10 | 42 ± 15 | 27 ± 7 |
| Mean neural ΔPD | 34 ± 31 | 63 ± 24 | 50 ± 44 | 49 ± 41 |
Values are means ± SD. Shown are the numbers of experimental sessions, time periods over which data were recorded, numbers of recorded neurons, numbers of well-tuned neurons, numbers of tuned neurons with high preferred direction (PD) confidence, and mean changes in PD (ΔPD) for the well-tuned, high-confidence neurons.
Alteration of muscle tuning curves in response to forearm rotation.
Muscles were activated in a stereotypical manner for each of the eight targets in the center-out task in a posture-dependent manner (Fig. 2). EMGs typically increased monotonically toward the force required to hold the cursor in the target, without the triphasic pattern typical of rapid reaching movements. There was some contribution to wrist torque from the extrinsic finger muscles, especially for diagonal targets with a flexion component. The extent of this finger component varied between monkeys and postures.
Fig. 2.
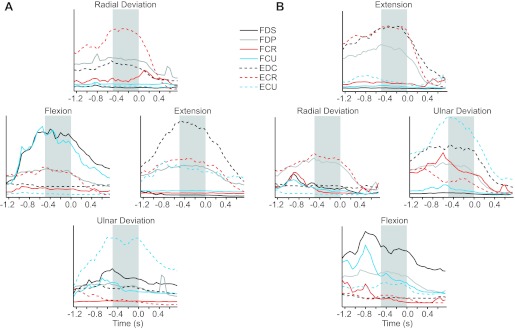
Perievent time histograms for electromyographs (EMGs). The average EMG activity from monkey SP was plotted for each of the four cardinal directions during force production in the midposture (A) and prone posture (B). Zero represents the reward time, preceded by the 0.5-s target hold time during which the preferred direction (PD) measurements were made (shaded boxes). Flexor muscles are plotted as solid lines, and extensors are plotted as dashed lines. Radial deviators are plotted in red, and ulnar deviators are plotted in blue. Finger flexors and extensors are plotted in black and gray, respectively. The following muscles were evaluated: flexor digitorum superficialis (FDS), flexor digitorum profundus (FDP), flexor carpi radialis (FCR), flexor carpi ulnaris (FCU), extensor digitorum communis (EDC), extensor carpi ulnaris (ECU), and extensor carpi radialis (ECR).
The tuning curves and corresponding PDs of two extensor muscles in both the midposture (black) and prone posture (red) were plotted for each monkey (Fig. 3). As in these examples, the primary response of most muscle tuning curves to the forearm rotation was a simple rotation, accompanied in some cases by a small gain change. Overall, the muscle tuning curves rotated with the forearm, on average, by 67 ± 20°. The muscles included in this average are shown in Table 2. FCR was a notable exception to this pattern because of its significant posture-dependent shape changes, which will be addressed in more detail later.
Fig. 3.

Tuning curves expressing the level of muscle activity as a function of the direction of isometric force. Tuning curves are shown for two different muscles, ECU (top) and ECR (bottom), for each of four monkeys. The scale of the outer ring is the maximum activation recorded for each monkey and muscle. Forearm posture is indicated by the color of the curves, including the mid (black) and prone (red) forearm postures. The tuning curves are plotted in extrinsic coordinates from the monkey's perspective, such that upward targets required the monkey to generate upward forces in extrinsic coordinates. The arrow indicates the direction of rotation of the wrist from mid to prone. The PD and ±95% confidence bounds are indicated by the three radial vectors on each plot.
Table 2.
Summary of muscle data
|
Monkey OR |
Monkey EO |
Monkey KD |
Monkey SP |
|||||
|---|---|---|---|---|---|---|---|---|
| Number | Mean ΔPD | Number | Mean ΔPD | Number | Mean ΔPD | Number | Mean ΔPD | |
| FCR | 2 | 98.5 | 2 | 81 | 1 (1) | 71 | (2) | × |
| FCU | 2 | 114.5 | × | × | (2) | × | (2) | × |
| FDS | 1 | 50 | × | × | 2 | 80 | 2 | 37 |
| FDP | × | × | × | × | 1 (1) | 77 | 1 | 32 |
| ECR | 1 | 92 | 2 | 57 | 2 | 86.5 | 2 | 48 |
| ECU | 1 | 73 | 2 | 51.5 | 2 | 63.5 | 2 | 56 |
| EDC | 2 | 95.5 | 2 | 61 | (2) | × | 1 | 48 |
| Totals | 9 | 87 ± 20 | 8 | 63 ± 12 | 8 (14) | 76 ± 10 | 8 (12) | 45 ± 10 |
Data are from one experimental session per monkey and show the numbers of well-tuned muscles used in the mean ΔPD calculation. For monkeys KD and SP, additional muscles that were not well tuned but included in the population decoder analysis are reported in parentheses. The following muscles were evaluated: flexor carpi radialis (FCR), flexor carpi ulnaris (FCU), flexor digitorum superficialis (FDS), flexor digitorum profundus (FDP), extensor carpi radialis (ECR), extensor carpi ulnaris (ECU), and extensor digitorum communis (EDC).
Alteration of neuron tuning curves in response to forearm rotation.
Like the muscles, M1 discharge varied across targets in a posture-dependent fashion (Fig. 4). The neurons shown in Fig. 4 were sorted according to their PDs, which were distributed throughout the entire two-dimensional force space. Examples of tuning curves for individual neurons are shown in Fig. 5. Figure 5, A and C, shows examples of neurons with activity something like ECR in both postures. The neuron shown in Fig. 5D had tuning similar to FCR, whereas the neurons shown in Fig. 5, E and F, had tuning similar to that of ECU.
Fig. 4.
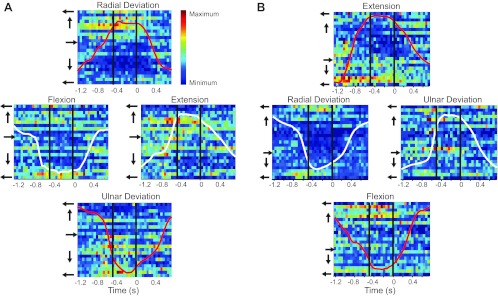
Raster display of activity of 23 simultaneously recorded neurons from monkey OR. The activity of the well-tuned (R2 > 0.62), high-confidence (better than ±25°) neurons was aligned to the time of reward and averaged over 20 trials for targets in each of the 4 cardinal directions in the midposture (A) and prone posture (B). Here, target hold time and PD measurement period are indicated by the vertical black lines. Neurons were sorted by PD, as indicated by the arrows to the left of the rasters. The firing rate for each neuron was normalized to its peak and plotted such that red is the maximum and blue is the minimum firing rate. Curves on each panel denote force magnitude of the left-right (white) and up-down (red) axes.
Fig. 5.

Tuning curves expressing the level of neuronal activity as a function of the direction of isometric force. The maximal firing rate is indicated at the outer circumference. Two example neurons from each monkey were plotted using the same conventions as in Fig. 3.
Figure 6 shows the results for all the well-tuned, high-confidence neurons (i.e., sinusoidal tuning with R2 > 0.62 and confidence interval smaller than ±25°) from a single session for each monkey. Each image in Fig. 6 shows PDs in both the midposture (inner ring) and prone posture (outer ring). Muscle PDs are included to facilitate the comparison between the behavior of the muscles and neurons. The examples from Fig. 5 are highlighted. Note that the PDs recorded from any two electrode pairs implanted in the same muscle were quite similar. In general, regardless of a neuron's initial PD, it rotated in the same direction as the muscles, typically with a similar magnitude. A minority (like that shown in Fig. 5B) rotated considerably less than did the muscles.
Fig. 6.

Summary of the PD of each well-tuned neuron and muscle recorded during one representative experimental session. PDs in the midposture are plotted on the inner circle and connected with a line to the corresponding prone-posture PD on the outer circle. Neurons are shown in gray, with those from Fig. 5 highlighted in black and labeled. Muscles are shown in color, with FCR green, ECR red, and ECU blue. FCR was not included for monkey SP because it was not well tuned. The imposed postural rotation is reflected in the rotation of the PDs of both muscles and neurons.
Population changes in the PD.
To quantify the changes in neural and muscle tuning curves, we calculated ΔPD, the difference between the PDs in the mid- and prone postures (Fig. 7). Unexpectedly, there was an unambiguous unimodal distribution not only for each monkey but for every experimental session (data not shown). For three of the four monkeys, the distribution of neural ΔPDs was not significantly different from the distribution of muscle ΔPDs (by t-test: monkey EO, P = 0.90; monkey KD, P = 0.09; monkey SP, P = 0.86; see Table 1). Monkey OR was an exception, with neurons rotating significantly less than muscles (P < 0.001). The difference was particularly large, because the muscle ΔPDs were larger than those of the other monkeys, while at the same time, the neural ΔPDs were somewhat smaller. Combining data from all monkeys, the mean neural ΔPD was significantly different than zero (47 ± 40, P < 0.001 by t-test) but also significantly smaller than that of muscles (67 ± 20, P < 0.01 by t-test).
Fig. 7.

Histograms of the change in PD (ΔPD) of all well-tuned, high-confidence neurons for each monkey. Associated muscle ΔPDs for each monkey are represented by the mean ± 1SD bar above the histogram for comparison.
In addition to comparing the overall EMG and neuronal distributions, we compared the ΔPD for individual neurons to the range of muscle ΔPDs for that monkey. Fifty-eight percent of neurons (316 of 542 neurons) fell within the range of muscle ΔPDs. In contrast, 45% of neuronal ΔPDs (247 of 542 neuronal ΔPDs) were not significantly different from zero, although within this group, 78% were positive. Note that some neurons (95 of 542 neurons) had a rotation that was within the muscle range, yet not significantly different from zero because of large measurement uncertainty. Consequently, the percentages in these two groups need not add to 100. Monkey OR had a higher proportion (60%) of neurons with an insignificant ΔPD compared with the other monkeys, which fell between 15% and 45%.
In summary, neurons responded to the forearm rotation with a change in PD that was consistently in the same direction as that of the muscles but with a somewhat smaller overall magnitude. There was no evidence of a bimodal distribution of neuronal ΔPD that would justify classification of neurons into two categories of response type.
Dependence of ΔPD on the measurement period within the trial.
Our measurements were made during a stable period late in the trial rather than near the movement onset, as was done in the earlier study by Kakei et al. (1999). However, we also studied the variation of this measurement throughout the trial, in 300-ms windows ranging approximately from the movement onset through the middle of the hold period (Fig. 8). We included only neurons that had a confidence interval less than ±25° at every measurement time point. There appeared to be a monotonic change in ΔPD throughout the trial, but the shape was somewhat obscured by the range of different mean ΔPDs. To compare the shape directly, we subtracted the mean of each curve, which revealed a clear, approximately linear increase in ΔPD for nearly every neuron (Fig. 8B). This result raises the interesting possibility that the information encoded by M1 neural discharge varied throughout the trial. However, when we did the same analysis for EMG ΔPDs, we discovered that the curves for neurons and all muscles were virtually identical (Fig. 8C). Whatever caused the time-varying effect on neuronal PD was apparently a result of the task dynamics, not a higher level shift from movement planning to movement execution.
Fig. 8.

Change in ΔPD throughout the trial. A: ΔPDs for neurons from monkey KD were plotted as a function of the time after the go cue (150 ms corresponds approximately to the movement onset). Only neurons that had high PD confidence for all of the measurement periods were included. B: to better observe the functional relation between ΔPD and time, we subtracted the mean ΔPD from each neuron curve. C: the same calculations were made for the muscles using measurements made 50 ms later than the corresponding neuronal measurements to preserve the temporal relation between the two types of signals. The individual muscle curves are plotted in color, whereas the average, shifted neuron ΔPD is plotted in black (±1 SD).
For both neurons and EMGs in this example, the difference between the first two and last two time points was highly significant, with P values of approximately zero. In contrast, there were no differences between neuronal and EMG ΔPDs at either the beginning or end of the trial (P = 0.49 and 0.45, respectively), indicating that for this monkey, the dependence of ΔPD on time was essentially the same for neurons and muscles. We completed this analysis for all monkeys. For both EMG and neurons, ΔPD was greater at the end than at the beginning of the trial (P < 0.01). Seven of eight comparisons between neurons and EMG (four monkeys, beginning and end trial) were not different (P ≥ 0.15). One of eight comparisons was highly significant (P = 0.004), although this was for monkey EO, with only four neurons that satisfied the stringent inclusion criteria. We conclude that the systematic variation in neuronal ΔPD throughout the trials was not a representation of complex, changing kinematics or high-level motor planning but simply reflected the behavior of muscles.
Predictions of EMG and force from multiple discriminated neurons.
We have shown how individual M1 neurons alter their spatial tuning curves when the forearm is rotated. These alterations were similar but not identical to those undergone by muscles, suggesting that postural changes at the neural level largely reflect changes in musculoskeletal dynamics. However, our analysis considered only one aspect of the neuron's discharge, its mean direction dependence. To include the overall discharge properties and to explore these effects at a population level, we constructed both neuron-to-EMG and neuron-to-force decoders using inputs from populations of simultaneously recorded neurons. In these analyses, unlike the single neurons results described above, all neurons, regardless of confidence bounds or tuning, were included, since the regression process itself determined the most informative neurons. The predictions made by these decoders allowed us to examine to what extent posture-related changes in force were due to musculoskeletal changes as opposed to changes in the relation between neurons and muscles.
An example of these predictions in the midposture for force and several EMGs from monkey KD is shown by the red lines in Fig. 9, whereas actual force is shown in black. In these example trials, FCR was activated for directions with a flexion or radial deviation component (left or up, in this posture), whereas ECR was activated for the radial deviation and extension targets (up and right). The last two trials were to the target that maximally activated ECR to show the consistency of the muscle patterns. These within-condition predictions used a decoder built from data in one posture to predict data collected subsequently in the same posture. We also tested how predictions generalized across postures. Here, we present data using a decoder built from data in the prone posture to predict data collected in the midposture (Fig. 9, blue lines), but the results were similar for generalization in either direction. In this example, the extensor muscles generalized quite well, whereas FCR and force signals did not.
Fig. 9.

Actual and predicted EMG and force signals corresponding to the midforearm posture for monkey KD. Target directions are indicated by the arrows at the top. Actual signals are shown in black. Predictions made from a decoder computed from data recorded during the same (mid) posture are plotted in red. Predictions made from a decoder computed from the rotated (prone) posture are plotted in blue. Prediction accuracy in terms of variance accounted for (VAF) is indicated on the left.
Prediction accuracy across all EMG and force data from monkeys KD, SP, and OR is shown in Fig. 10. The cross-posture prediction accuracy for monkeys KD and SP is shown in Fig. 10B, with VAF averaged over one session from each monkey. All of the signals were predicted well within posture. Five of the seven wrist and finger muscles were reasonably well predicted across forearm postures as well, with VAF > 0.31 (FCR being the notable exception). However, the force predictions consistently failed to generalize, with VAFs dropping from ∼0.6 to less than −0.5.
Fig. 10.

EMG and force prediction accuracy expressed as average VAF ± 1SD for monkeys KD, SP, and OR. SD was calculated across monkeys. A: within-posture predictions. B: cross-posture predictions (solid bars) for one session from each of the two monkeys (monkeys KD and SP) from which we recorded simultaneous neural and EMG activity in both postures. The corresponding within-posture predictions (shaded bars) are plotted for comparison.
In light of the consistently good generalization of the other muscles, the poor FCR generalization was surprising. We hypothesized that the monkeys may have used different strategies, relying more on the finger flexor muscles in one posture than the other. The results shown in Fig. 3 indicated that the shape of the tuning curves for ECR and ECU were largely the same for the two different postures, with the difference amounting to small-amplitude changes and a rotation that was nearly equal to that of the forearm. These muscles were cosine tuned and predicted quite well across postures, although not as well as within postures. Likewise, FDS, which was also predicted well across postures, was characterized primarily by a simple tuning curve rotation (Fig. 11A). FCR, on the other hand, was not sinusoidal in its spatial tuning and was activated quite differently in the midposture than it was in the prone posture. These dramatic variations in the shape of the tuning curves for FCR between the two postures suggest a possible explanation for the poor generalization of its predictions across the postures.
Fig. 11.

Tuning curves for one muscle, FDS (top), which generalized well across postures, and one muscle, FCR (bottom), which did not generalize well. Although FDS tuning was well characterized by a simple rotation with forearm posture (monkey KD) or rotation plus gain change (monkey SP), the shape of FCR tuning curves was completely different in the midposture (gray) and prone posture (red).
Two-stage predictions of end-point force.
The lack of generalization is certainly due in part to the changes in musculoskeletal mechanics described above, but it could also be affected by changes at the neuron-to-muscle level. We explored this question by using an additional decoder to transform EMG activity recorded from the wrist and digit muscles into end-point force. Figure 12A shows within- and cross-posture predictions of force using neurons as input. Figure 12B shows the corresponding predictions using EMG inputs. Although the within-posture predictions using EMG inputs were even better than those with neuronal inputs (average VAF = 0.89 vs. 0.60, respectively), the cross-posture predictions were both very poor (VAF = 0.05 with EMG input and −0.18 with neuron input). The altered mechanics of the wrist due to the forearm rotation changed the relationship between muscle activation and end-point force, and, consequently, both types of predictions failed to generalize.
Fig. 12.
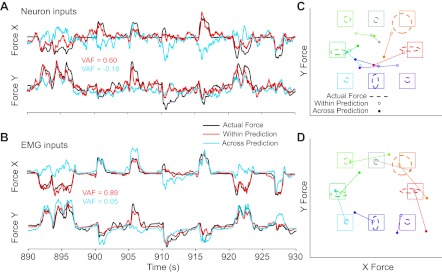
Prediction of force using either neural or EMG inputs. A: continuous time plots of force using neural inputs including actual force (black), within-posture posture predictions (red), and cross-posture predictions (blue). B: corresponding plots using EMG inputs. C: Cartesian plots of target force (squares), actual force (dashed ovals), and predicted force (circles) during the target hold time. Targets and force levels are plotted from the monkey's perspective and color coded according to target direction. Force ovals are centered at the mean force across like trials, with the major and minor axes determined by the SD in the x and y directions. The mean within-posture prediction for each target direction (open circles) is connected to the corresponding cross-posture prediction (closed circles). D: corresponding EMG-to-force predictions.
While the time plots and corresponding VAF measures show clearly that neither prediction of force generalized well, they do not give much insight into the nature of the failed predictions. Consequently, we also plotted mean values for both actual and predicted force within the same target hold periods we used to compute PDs. These x/y force plots are shown in Fig. 12, C and D, for predictions using neural and EMG inputs, respectively. Although the within-posture predications (open symbols) were accurate, the cross-posture predictions (solid symbols) were all rotated clockwise from the actual force (dashed ovals). To quantify the prediction error, we calculated the gain and rotation between the actual and predicted forces. The neuron-to-force predictions of monkeys KD and SP rotated an average of 49° between the two postures (Table 3). Likewise, the cross-posture EMG-to-force predictions (Fig. 12D) also rotated, on average by 56°. All the differences were highly significant (P ≈ 0 by t-test). In addition to the rotation of the outputs, the gains of the neuron-input decoders were significantly less than one.
Table 3.
Summary of decoder accuracy
| Gain |
Rotation |
|||||||||
|---|---|---|---|---|---|---|---|---|---|---|
| Decoder | KD (1) | KD (2) | SP (1) | SP (2) | Mean ± SD | KD (1) | KD (2) | SP (1) | SP (2) | Mean ± SD |
| Neuron to force | ||||||||||
| Within | 0.82 | 0.78 | 0.59 | 0.64 | 0.71 ± 0.1 | −0.5 | 0.0 | −1.1 | −4.9 | −1.6 ± 2.2 |
| Across | 0.66 | 0.73 | 0.56 | 0.53 | 0.62 ± 0.09 | 55.4 | 48.5 | 39.3 | 52.5 | 48.9 ± 7.0 |
| EMG to force | ||||||||||
| Within | 0.92 | 0.90 | 0.89 | 0.95 | 0.91 ± 0.03 | −0.9 | −0.6 | −2.4 | 0.6 | −0.8 ± 1.2 |
| Across | 0.87 | 0.98 | 1.12 | 1.12 | 1.0 ± 0.10 | 62.2 | 64.8 | 50.4 | 45.9 | 55.8 ± 9.1 |
| Two stage | ||||||||||
| Within | 0.91 | 0.90 | 0.79 | 0.82 | 0.85 ± 0.06 | −1.1 | 0.2 | −2.3 | −2.8 | −1.5 ± 1.3 |
| Across | 0.83 | 0.80 | 0.71 | 0.70 | 0.76 ± 0.06 | −1.1 | 0.6 | 2.3 | −1.0 | 0.2 ± 1.6 |
Gain and rotation between actual and predicted force signals are shown for both neuron- and EMG-input decoders as well as the two-stage decoder for within- and cross-posture conditions.
The striking rotation of the EMG-to-force predictions does not preclude additional effects at the neuron-to-EMG level. However, comparing the nature and the magnitude of the EMG and force prediction errors is difficult. To allow for a more direct comparison, we devised a two-stage prediction using the accurate within-posture EMG-to-force decoder to transform the EMG predictions into force coordinates. Under these conditions, neural activity correctly predicted force, provided that we used the accurate, within-posture decoder for the EMG-to-force stage (Fig. 13A). The rotation of these cross-posture predictions was not significantly different from the within-posture rotation or from zero (Fig. 13B). Finally, the gains using this two-stage decoder were 15% greater than the single-stage neuron-to-force decoder but were still less than unity (Fig. 13B and Table 3). These results show, quite convincingly, that the failed generalization of force predictions is attributable to altered mechanics of the wrist rather than to changes in the relation between neuronal and EMG activity.
Fig. 13.
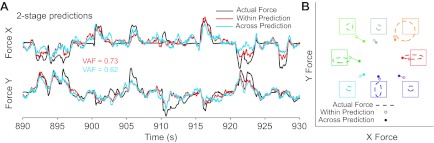
Two-stage predictions of force in the prone posture. All plotting conventions are as in Fig. 12. Within-posture predictions are equivalent to those shown in Fig. 12. In contrast, the cross-posture predictions used the midposture, neuron-to-EMG decoder to predict EMG but the prone (i.e., within posture) EMG-to-force decoder. This two-stage approach revealed that the failure of force prediction generalization across postures (Fig. 12, A and C) was actually the result of the final, EMG-to-force decoder stage. A: continuous time plots. B: mean target hold time plots.
DISCUSSION
Summary.
Many previous studies have demonstrated that the M1 is correlated with both kinematic and kinetic aspects of movement (Ashe 1997; Cheney and Fetz 1980; Crutcher and Alexander 1990; Fu et al. 1995; Kalaska et al. 1989; Taira et al. 1996; Thach 1978). Some of these experiments have used added loads or postural variations in an effort to disrupt the mutual correlations among movement-related variables that confound these studies. The postural studies, in particular, address a closely related question: whether M1 discharge is related to extrinsic world coordinates or to an intrinsic coordinate system related to joint angles or muscles.
We modeled our experiments on a study that found two subpopulations of M1 neurons: an extrinsic-like population with little or no change in PD response to forearm rotation and a smaller muscle-like population having PDs that rotated much like those of muscles (Kakei et al. 1999). Unexpectedly, we found a unimodal distribution of neurons centered at roughly 45°. Surrounding this mode, most neurons had a ΔPD within the range of the muscles. Among those neurons with ΔPDs not significantly different from zero, three-quarters were positive, the direction of rotation of all the muscles. In this respect, our results were similar to those of another study suggesting that motor cortical neurons follow a coordinate frame between extrinsic world coordinates and the muscle-like intrinsic coordinate system (Yanai et al. 2008). Based on our results, there appears to be little rationale for classification of neural responses into extrinsic and intrinsic categories, a designation that would inevitably be largely arbitrary.
Our experiments differed from those of Kakei et al. in at least three important ways. First, to simplify the dynamics and improve our estimates of PDs, we used an isometric task rather than a movement task. Second, we chose to measure neural discharge during the relatively long, stable target hold period rather than at the onset of movement. Finally, we used a multielectrode array to record the neural signals rather than single, moveable electrodes, inserted into the brain daily.
The difference between movement and isometric tasks.
Under isometric conditions, end-point forces are approximately proportional to muscle forces. However, during movement, muscle forces must accelerate the mass of the limb, and any forces measured at the end point are filtered through these dynamics. Furthermore, as the hand moves, the mechanics change, resulting in complex, nonlinear dynamics and hand paths that are typically not straight (Charles and Hogan 2010; Hogan 1976).
It is possible that the more complex movement task requires a fundamentally different mode of control than do isometric movements, including neurons that encode both kinetic and kinematic aspects of the movement. On the other hand, the greater neuronal complexity may simply reflect the greater complexity of the task dynamics (Hoffman and Strick 1999). This was the conclusion of an experiment that compared EMG and force directly to M1 discharge during both an isometric task and a reaching task with a significant inertial load (Sergio et al. 2005; Sergio and Kalaska 1998). In that study, while the neural activity differed quite substantially between the isometric and movement tasks, its greater complexity during movement simply reflected, for the most part, the greater dynamic complexity of the force and EMG signals.
Temporal encoding of movement in the M1.
Kakei et al. used a brief, 100-ms sample period immediately before the movement onset to provide the purest representation of movement intent before any feedback. However, this short sample would also be particularly sensitive to subtle fluctuations in the planned forces as the limb is rapidly accelerated. By measuring, instead, across a longer period of time when force was stable, we reduced both this potential nonstationarity as well as the noise due to the Poisson nature of the spike counts. The five times longer measurement period in our study would be expected to lead to confidence intervals more than two times smaller (Stevenson et al. 2011). When we relaxed the confidence interval criteria, the distributions shown in Fig. 7 became significantly broader.
We also showed that measurements made earlier in the trial resulted in smaller changes in PD than those made later. This might be interpreted as a progressive change in the information encoded in that discharge. One can imagine that the relatively small ΔPD measured early in the trials represents planning in an extrinsic coordinate system, whereas the later, larger changes reflect actual movement execution commands. This idea was proposed in an earlier reaching study (Fu et al. 1995). Similar time variation was observed in the more closely related isometric wrist study for both M1 and spinal interneuronal ΔPDs (Yanai et al. 2008). These authors concluded that “… as trials progress, cortical command changes as a result of different weighing of extrinsic-related with muscle related inputs.”
However, the virtually identical time dependence of ΔPDs of neurons and muscles in our study (Fig. 8C) suggests a very different interpretation: the time dependence is not reflective of a change in representation from movement planning to movement execution but simply a reflection of some interaction between the changing dynamics of the task and the unchanging target location used for the regression.
Differences in movement representation across the M1.
Rathelot and Strick (2006, 2009) used retrograde transneuronal tracing to identify neurons monosynaptically connected to motor neurons. These neurons, in particular those projecting to the hand, were largely restricted to the sulcus (Rathelot and Strick 2006, 2009). There is related physiological evidence suggesting the possibility of a hierarchical representation of processing that includes motor intent and planning in the premotor cortex and rostral M1 and execution within the caudal M1 in the sulcus (Crammond and Kalaska 1996; Johnson et al. 1996; Kakei et al. 2001; Shen and Alexander 1997; Yanai et al. 2008). While the recordings of Kakei et al. included sites within the sulcus, these areas were inaccessible with our electrode arrays, which extended only 1.5 mm into the cortex. Given this difference, it is all the more surprising that the population of neurons we recorded was more nearly muscle like than that of Kakei et al.
However, the recording technique influences not only from where one is able to record but also what type of neurons are most likely to be recorded. Because chronically implanted electrodes are subject to gradual encapsulation and local cell death, and because they cannot be adjusted in depth to optimize recordings, they are less likely than movable electrodes to record from smaller neurons. This, and our attempt to position the tips within layer V, may have yielded recordings that were biased to the larger, corticospinal neurons despite the location at the top of the sulcus.
Role of gain modulation and context dependence.
If the tuning curves of all neurons rotated as did muscles, one might conclude that the relation between neuron and muscle was fixed across the different forearm postures. To the extent that these two sets of rotations are not the same, there must be some other compensatory mechanism. One possibility is additional downstream changes in the strength of projections that alter the effects of individual neurons. However, an upstream mechanism could also contribute. We focused our analysis on the direction of the peak of the tuning curves, but a change in the magnitude could also account for some of the response to forearm rotation, a phenomenon referred to as “gain modulation” (Ajemian et al. 2001; Salinas and Thier 2000; Sergio and Kalaska 2003). The large group of neurons that Kakei et al. (1999) described as “modulated” had this characteristic.
In theory, gain modulation alone should allow neurons with fixed weight connections to muscles to control movement using extrinsic recruitment patterns (Todorov 2000). This idea was confirmed in simulation (Shah et al. 2004). In the extreme, one can imagine two groups of extrinsic neurons, one with the necessary output weights to produce the required muscle activation in one posture and another that would control activation in a different posture. In practice, most neurons would contribute to activation in both postures. These groups would correspond to sets of task-dependent neurons, whose activation functions are dependent on the task context. The fundamental point is that the recruitment patterns of neurons do not of themselves provide strong evidence of the nature of the output effects of those neurons.
There is, however, independent evidence, through stimulus-triggered averaging, that the output effects of M1 neurons are largely fixed across different behaviors. Stimulus-evoked measures have the advantage that they eliminate the problem of noncausal correlation, which makes measures based on spiking activity difficult to interpret. M1 poststimulus effects tested in 24 different muscles proved to be highly stable across a range of motor tasks: an isometric wrist step tracking task, an isometric whole arm push-pull task, and a reach-to-grasp task (Griffin et al. 2009). This evidence suggests that downstream dynamic changes between M1 and muscle activation are minimal. The argument becomes more compelling when combined with our observations of tuning curves that are more nearly aligned with muscles than space and of EMG predictions with a single, fixed decoder, that work equally well in the two postures.
Limits of decoder generalization.
In our experiments, both force and EMG were well predicted from M1 neurons within a given posture. However, the neuron-to-force predictions did not generalize well across postures. In addition to the negative VAF for the continuous predictions, there was an inappropriate rotation of predicted force during the hold period, the magnitude of which was consistently underpredicted. This is in agreement with a study that showed that neither cortical nor spinal inputs predicted target direction in a rotated forearm posture (Yanai et al. 2008). Likewise, during reaching, end-point forces predicted with a linear filter model generalized quite poorly across different applied loads (Gupta and Ashe 2009). However, we showed, furthermore, that the failure to generalize could be attributed completely to the altered EMG-to-force relationship resulting from the forearm rotation. After taking the altered mechanics into consideration using a novel two-stage decoder, the neurons predicted the time course of activity for most muscles nearly as well across as within postures.
The low gain of static force and EMG (the latter revealed by the two-stage decoder) predicted from neurons remains puzzling. Even the within-condition predictions fell short of the actual force (e.g., Fig. 13A and Table 3). The EMG-to-force decoders did not show this effect, suggesting that the reduced gain may have resulted from a nonlinearity between neurons and muscles that was not fully captured by the Wiener cascade.
Application to a BMI.
Most BMIs decode kinematic signals to control an external device, for example, cursor position, the end point of a robotic arm, or grip aperture. An exception is one experiment that also decoded grip force, providing feedback to the monkey using the decoded signal to control cursor diameter (Carmena et al. 2003). A number of BMI studies have reported changes in the neural PDs and depths of modulation when a monkey switches from hand control to brain control (Carmena et al. 2003; Ganguly and Carmena 2009; Jarosiewicz et al. 2008; Lebedev et al. 2005; Taylor et al. 2002; Zacksenhouse et al. 2007). These changes may have several different sources, including the alteration of afferent feedback or task-dependent changes in neuronal discharge as a result of the contextual switch itself. Perhaps more importantly, normal hand control and purely kinematic brain control are radically different dynamically. If M1 neurons naturally carry signals leading to muscle contraction, joint torque, and limb acceleration, it should come as no surprise that the need to control movement kinematics directly might cause dramatic changes in the required patterns of neural discharge as the monkey (or human patient) adapts to the novel behavior.
The limits of this adaptation have been tested in several recent experiments. Monkeys were able to learn to use a decoder whose outputs were intentionally distorted by shuffling the neuron identities used as inputs to otherwise unaltered linear filters (Ganguly and Carmena 2009) or by rotating a subset of the neural PDs about a common axis (Jarosiewicz et al. 2008). Moritz and colleagues (Moritz and Fetz 2011; Moritz et al. 2008) showed that with appropriate feedback, monkeys can even learn to modulate arbitrarily chosen, single neurons whose activity is used to control stimulation of individual forearm muscles.
Recently, a hybrid BMI based on combined joint torque and end-point position predictions was demonstrated (Suminski et al. 2011). Its trajectories were straighter and smoother than those of the purely position BMI. However, the monkey was unable to use a pure torque decoder, which proved to be dynamically unstable. Our group has pioneered the use of functional electrical stimulation (FES), controlled in real time through multielectrode cortical recordings, to restore voluntary control of paralyzed forearm flexor muscles (Ethier et al. 2012; Pohlmeyer et al. 2007, 2009). To the extent that this decoder successfully captures the muscle-like character of the neurons, it may require less dramatic adaptation between hand and brain control than would be needed for a kinematic decoder. Monkeys in the brain-controlled FES experiments achieved very good coordination between proximal muscles activated naturally and distal muscles activated via cortically controlled FES. This is a first step towards a muscle-based BMI implemented in paralyzed patients. For this, or another, BMI to be used clinically, it will be necessary to develop decoders that do not rely on signals recorded under normal movement conditions. This may present a special challenge for muscle-based BMI, but it is a problem we are beginning to work on. A BMI that takes advantage of the muscle-like properties we have observed in the M1 may have the potential to require less user adaptation, to decrease the user's cognitive load, and to offer a new window into the process of motor command generalization and adaptation.
GRANTS
This work was supported in part by National Institute of Neurological Disorders and Stroke (NINDS) Grant NS-053603 (to L. E. Miller), with further support from the Chicago Community Trust through the Searle Program for Neurological Restoration. E. R. Oby was supported by individual NINDS Grant F31-NS-071737.
DISCLOSURES
No conflicts of interest, financial or otherwise, are declared by the author(s).
AUTHOR CONTRIBUTIONS
Author contributions: E.R.O. and L.E.M. conception and design of research; E.R.O. and C.E. performed experiments; E.R.O. and C.E. analyzed data; E.R.O. and L.E.M. interpreted results of experiments; E.R.O. and L.E.M. prepared figures; E.R.O. and L.E.M. drafted manuscript; E.R.O., C.E., and L.E.M. edited and revised manuscript; E.R.O., C.E., and L.E.M. approved final version of manuscript.
ACKNOWLEDGMENTS
The authors gratefully acknowledge Elliot Hirsch for surgical assistance and Matt Bauman, Rebecca Friesen, and David Bontrager for technical assistance.
REFERENCES
- Ajemian R, Bullock D, Grossberg S. A model of movement coordinates in the motor cortex: posture-dependent changes in the gain and direction of single cell tuning curves. Cerebral Cortex 11: 1124–1135, 2001 [DOI] [PubMed] [Google Scholar]
- Ashe J. Force and the motor cortex. Beh Brain Res 87: 255–269, 1997 [DOI] [PubMed] [Google Scholar]
- Carmena JM, Lebedev MA, Crist RE, O'Doherty JE, Santucci DM, Dimitrov D, Patil PG, Henriquez CS, Nicolelis MA. Learning to control a brain-machine interface for reaching and grasping by primates. PLoS Biol 1: 193–208, 2003 [DOI] [PMC free article] [PubMed] [Google Scholar]
- Charles SK, Hogan N. The curvature and variability of wrist and arm movements. Exp Brain Res 203: 63–73, 2010 [DOI] [PubMed] [Google Scholar]
- Cheney PD, Fetz EE. Functional classes of primate corticomotorneuronal cells and their relation to active force. J Neurophysiol 44: 773–791, 1980 [DOI] [PubMed] [Google Scholar]
- Churchland MM, Shenoy KV. Temporal complexity and heterogeneity of single-neuron activity in premotor and motor cortex. J Neurophysiol 97: 4235–4257, 2007 [DOI] [PubMed] [Google Scholar]
- Crammond DJ, Kalaska JF. Differential relation of discharge in primary motor cortex and premotor cortex to movements versus actively maintained postures during a reaching task. Exp Brain Res 108: 45–61, 1996 [DOI] [PubMed] [Google Scholar]
- Crutcher MD, Alexander GE. Movement-related neuronal activity selectively coding either direction or muscle pattern in three motor areas of the monkey. J Neurophysiol 64: 151–163, 1990 [DOI] [PubMed] [Google Scholar]
- Davison AC, Hinkley DV. Reviews of Bootstrap Methods and Their Application. Cambridge, MA: Cambridge Univ. Press, 1997 [Google Scholar]
- Ethier C, Oby ER, Bauman MJ, Miller LE. Restoration of grasp following paralysis through brain-controlled stimulation of muscles. Nature 485: 368–371, 2012 [DOI] [PMC free article] [PubMed] [Google Scholar]
- Evarts EV. Relation of pyramidal tract activity to force exerted during voluntary movement. J Neurophysiol 31: 14–27, 1968 [DOI] [PubMed] [Google Scholar]
- Fagg AH, Ojakangas GW, Miller LE, Hatsopoulos NG. Kinetic trajectory decoding using motor cortical ensembles. IEEE Trans Neural Syst Rehabil Eng 17: 487–496, 2009 [DOI] [PubMed] [Google Scholar]
- Fu QG, Flament D, Coltz JD, Ebner TJ. Temporal encoding of movement kinematics in the discharge of primate primary motor and premotor neurons. J Neurophysiol 73: 836–854, 1995 [DOI] [PubMed] [Google Scholar]
- Ganguly K, Carmena JM. Emergence of a stable cortical map for neuroprosthetic control. PLoS Biol 7: e1000153, 2009 [DOI] [PMC free article] [PubMed] [Google Scholar]
- Georgopoulos AP, Kalaska JF, Caminiti R, Massey JT. On the relations between the direction of two-dimensional arm movements and cell discharge in primate motor cortex. J Neurosci 2: 1527–1537, 1982 [DOI] [PMC free article] [PubMed] [Google Scholar]
- Griffin DM, Hudson HM, Belhaj-Saïf A, Cheney PD. Stability of output effects from motor cortex to forelimb muscles in primates. J Neurosci 29: 1915–1927, 2009 [DOI] [PMC free article] [PubMed] [Google Scholar]
- Gupta R, Ashe J. Offline decoding of end-point forces using neural ensembles: application to a brain-machine interface. IEEE Trans Neural Syst Rehabil Eng 17: 254–262, 2009 [DOI] [PubMed] [Google Scholar]
- Hoffman DS, Strick PL. Step-tracking movements of the wrist. IV. Muscle activity associated with movements in different directions. J Neurophysiol 81: 319–333, 1999 [DOI] [PubMed] [Google Scholar]
- Hogan N. A review of the methods of processing EMG for use as a proportional control signal. Biomed Eng 11: 81–86, 1976 [PubMed] [Google Scholar]
- Humphrey DR, Schmidt EM, Thompson WD. Predicting measures of motor performance from multiple cortical spike trains. Science 170: 758–761, 1970 [DOI] [PubMed] [Google Scholar]
- Hunter IW, Korenberg MJ. The identification of nonlinear biological systems: Wiener and Hammerstein cascade models. Biol Cybern 55: 135–144, 1986 [DOI] [PubMed] [Google Scholar]
- Jarosiewicz B, Chase SM, Fraser GW, Velliste M, Kass RE, Schwartz AB. Functional network reorganization during learning in a brain-computer interface paradigm. Proc Natl Acad Sci USA 105: 19486–19491, 2008 [DOI] [PMC free article] [PubMed] [Google Scholar]
- Johnson PB, Ferraina S, Bianchi L, Caminiti R. Cortical networks for visual reaching: physiological and anatomical organization of frontal and parietal lobe arm regions. CerebCortex 6: 102–119, 1996 [DOI] [PubMed] [Google Scholar]
- Kakei S, Hoffman DS, Strick PL. Direction of action is represented in the ventral premotor cortex. Nat Neurosci 4: 1020–1025, 2001 [DOI] [PubMed] [Google Scholar]
- Kakei S, Hoffman DS, Strick PL. Muscle and movement representations in the primary motor cortex. Science 285: 2136–2139, 1999 [DOI] [PubMed] [Google Scholar]
- Kalaska JF, Cohen DAD, Hyde ML, Prud'homme M. A comparison of movement direction-related versus load direction-related activity in primate motor cortex, using a two-dimensional reaching task. J Neurosci 9: 2080–2102, 1989 [DOI] [PMC free article] [PubMed] [Google Scholar]
- Kim HK, Carmena JM, Biggs SJ, Hanson TL, Nicolelis MA, Srinivasan MA. The muscle activation method: an approach to impedance control of brain-machine interfaces through a musculoskeletal model of the arm. IEEE Trans Biomed Eng 54: 1520–1529, 2007 [DOI] [PubMed] [Google Scholar]
- Lebedev MA, Carmena JM, O'Doherty JE, Zacksenhouse M, Henriquez CS, Principe JC, Nicolelis MA. Cortical ensemble adaptation to represent velocity of an artificial actuator controlled by a brain-machine interface. J Neurosci 25: 4681–4693, 2005 [DOI] [PMC free article] [PubMed] [Google Scholar]
- Moritz CT, Fetz EE. Volitional control of single cortical neurons in a brain-machine interface. J Neural Eng 8: 025017, 2011 [DOI] [PMC free article] [PubMed] [Google Scholar]
- Moritz CT, Perlmutter SI, Fetz EE. Direct control of paralysed muscles by cortical neurons. Nature 456: 639–642, 2008 [DOI] [PMC free article] [PubMed] [Google Scholar]
- Pohlmeyer EA, Oby ER, Perreault EJ, Solla SA, Kilgore KL, Kirsch RF, Miller LE. Toward the restoration of hand use to a paralyzed monkey: brain-controlled functional electrical stimulation of forearm muscles. PLoS One 4: e5924, 2009 [DOI] [PMC free article] [PubMed] [Google Scholar]
- Pohlmeyer EA, Perreault EJ, Slutzky MW, Kilgore KL, Kirsch RF, Taylor DM, Miller LE. Real-time control of the hand by intracortically controlled functional neuromuscular stimulation. In: IEEE 10th International Conference on Rehab Robotics Noordwijk, The Netherlands: IEEE, 2007, p. 454–458 [Google Scholar]
- Rathelot JA, Strick PL. Muscle representation in the macaque motor cortex: an anatomical perspective. Proc Natl Acad Sci USA 103: 8257–8262, 2006 [DOI] [PMC free article] [PubMed] [Google Scholar]
- Rathelot JA, Strick PL. Subdivisions of primary motor cortex based on cortico-motoneuronal cells. Proc Natl Acad Sci USA 106: 918–923, 2009 [DOI] [PMC free article] [PubMed] [Google Scholar]
- Salinas E, Thier P. Gain modulation: a major computational principle of the central nervous system. Neuron 27: 15–21, 2000 [DOI] [PubMed] [Google Scholar]
- Sergio LE, Hamel-Paquet C, Kalaska JF. Motor cortex neural correlates of output kinematics and kinetics during isometric-force and arm-reaching tasks. J Neurophysiol 94: 2353–2378, 2005 [DOI] [PubMed] [Google Scholar]
- Sergio LE, Kalaska JF. Changes in the temporal pattern of primary motor cortex activity in a directional isometric force versus limb movement task. J Neurophysiol 80: 1577–1583, 1998 [DOI] [PubMed] [Google Scholar]
- Sergio LE, Kalaska JF. Systematic changes in motor cortex cell activity with arm posture during directional isometric force generation. J Neurophysiol 89: 212–228, 2003 [DOI] [PubMed] [Google Scholar]
- Shah A, Fagg AH, Barto AG. Cortical involvement in the recruitment of wrist muscles. J Neurophysiol 91: 2445–2456, 2004 [DOI] [PubMed] [Google Scholar]
- Shen L, Alexander G. Neural correlates of a spatial sensory-to-motor transformation in primary motor cortex. J Neurophysiol 77: 1171–1194, 1997 [DOI] [PubMed] [Google Scholar]
- Stevenson IH, Cherian A, London BM, Sachs NA, Lindberg E, Reimer J, Slutzky MW, Hatsopoulos NG, Miller LE, Kording KP. Statistical assessment of the stability of neural movement representations. J Neurophysiol 106: 764–774, 2011 [DOI] [PMC free article] [PubMed] [Google Scholar]
- Suminski AJ, Willett FR, Fagg AH, Bodenhamer M, Hatsopoulos NG. Continuous decoding of intended movements with a hybrid kinetic and kinematic brain machine interface. In: 33rd Annual International Conference of the IEEE Engineering in Medicine and Biology Society Boston, MA: IEEE, 2011, p. 5802–5806 [DOI] [PubMed] [Google Scholar]
- Taira M, Boline J, Smyrnis N, Georgopoulos AP, Ashe J. On the relations between single cell activity in the motor cortex and the direction and magnitude of three-dimensional static isometric force. Exp Brain Res 109: 367–376, 1996 [DOI] [PubMed] [Google Scholar]
- Taylor DM, Tillery SI, Schwartz AB. Direct cortical control of 3D neuroprosthetic devices. Science 296: 1829–1832, 2002 [DOI] [PubMed] [Google Scholar]
- Thach WT. Correlation of neural discharge with pattern and force of muscular activity, joint position, and direction of next movement in motor cortex and cerebellum. J Neurophysiol 41: 654–676, 1978 [DOI] [PubMed] [Google Scholar]
- Todorov E. Direct cortical control of muscle activation in voluntary arm movements: a model. Nat Neurosci 3: 391–398, 2000 [DOI] [PubMed] [Google Scholar]
- Yanai Y, Adamit N, Israel Z, Harel R, Prut Y. Coordinate transformation is first completed downstream of primary motor cortex. J Neurosci 28: 1728–1732, 2008 [DOI] [PMC free article] [PubMed] [Google Scholar]
- Zacksenhouse M, Lebedev MA, Carmena JM, O'Doherty JE, Henriquez C, Nicolelis MA. Cortical modulations increase in early sessions with brain-machine interface. PLoS One 2: e619, 2007 [DOI] [PMC free article] [PubMed] [Google Scholar]