

Abstract
Inhibition from thalamic interneurons plays a critical role in modulating information transfer between thalamus and neocortex. Interestingly, these neurons yield inhibition via two distinct outputs: presynaptic dendrites that innervate thalamocortical relay neurons and axonal outputs. Since the dendrites of thalamic interneurons are the primary targets of incoming synaptic information, it has been hypothesized that local synaptic input could produce highly focused dendritic output. To gain additional insight into the computational power of these presynaptic dendrites, we have combined two-photon laser scanning microscopy, glutamate uncaging, and whole-cell electrophysiological recordings to locally activate dendritic terminals and study their inhibitory contribution to rat thalamocortical relay neurons. Our findings demonstrate that local dendritic release from thalamic interneurons is controlled locally by AMPA/NMDA receptor-mediated recruitment of L-type calcium channels. Moreover, by mapping these connections with single dendrite resolution we not only found that presynaptic dendrites preferentially target proximal regions, but such actions differ significantly across branches. Furthermore, local stimulation of interneuron dendrites did not result in global excitation, supporting the notion that these interneurons can operate as multiplexors, containing numerous independently operating input–output devices.
Introduction
Inhibition plays an essential role in thalamocortical communication. In the visual thalamus, inhibition modulates receptive field properties, signal selectivity, information encoding, and the firing mode of thalamocortical relay neurons (Hubel and Wiesel, 1961; Sillito and Kemp, 1983; Holdefer et al., 1989; Wang et al., 2007, 2011). Local thalamic interneurons provide one of the primary sources of inhibition in the visual thalamus. These neurons are of great interest, considering that they produce inhibitory output via traditional axonal terminals (termed F1 terminals) as well as specialized dendritic terminals (termed F2 terminals), which serve both presynaptic and postsynaptic roles (Guillery, 1969; Ralston, 1971; Famiglietti and Peters, 1972; Hamos et al., 1985; Montero, 1986).
Most F2 terminals are presynaptic to a relay neuron dendrite and postsynaptic to an excitatory retinogeniculate terminal that in turn is presynaptic to the same relay neuron dendrite (Wilson et al., 1984; Hamos et al., 1985) (Fig. 1A). However, it is important to note that not all F2 and retinogeniculate terminals participate in this triadic arrangement (Hamos et al., 1987; Datskovskaia et al., 2001). The unique circuitry of the triad enables retinogeniculate output to produce (1) a monosynaptic excitation of a postsynaptic relay neuron dendrite and (2) a disynaptic inhibition via the F2 terminal. Previous studies indicate that F2 terminal output is regulated by local metabotropic glutamate receptors (mGluRs) (Godwin et al., 1996; Cox et al., 1998; Govindaiah and Cox, 2004, 2006). There is also evidence to suggest that activation of ionotropic glutamate receptors (iGluRs) can increase dendritic output (Cox and Sherman, 2000; Blitz and Regehr, 2005; Acuna-Goycolea et al., 2008); however, it is unclear whether such actions occur local to F2 terminals or independent of axonal output from interneurons.
Figure 1.

Glutamate uncaging results in a TTX-insensitive change in inhibitory activity in dLGN relay neurons. A, The basic circuitry of a triad located within a glomerulus. A retinogeniculate (RG) terminal forms an excitatory synapse onto both a thalamocortical (TC) relay neuron and an interneuron dendrite (INT: F2 terminal). In turn, the interneuron dendrite (F2 terminal) forms an inhibitory synapse onto the same TC dendrite. B, Schematic representing the basic experimental design used to isolate and monitor dendrodendritic activity (F2 terminal output). The green circle indicates an F2 terminal participating in a triad, as shown in A. Output from F2 terminals were isolated from axonal (F1 terminal) activity using TTX. F2 output was stimulated by photoreleasing glutamate with a single photon laser (405 nm) along the dendrites of a TC relay neuron and monitored using a cesium (Cs+)-based recording pipette and a command voltage of 0 mV. C, A 2PLSM image of dLGN relay neuron loaded with Alexa Fluor 594 (50 μm). The blue dot indicates the location where a single-photon laser was focused to release RuBi-glutamate (100 μm). The blue shadow illustrates the estimated radial spread of glutamate (see Materials and Methods). D, In TTX (1 μm, black line) a single laser pulse produced one of two responses. The negative response was identified by a brief direct response (i.e., inward current) with little change in IPSC activity. The positive response (obtained from the location shown in C) was identified by a robust increase in IPSC activity. Subsequent addition of SR95531 (10–20 μm: red line) attenuated the evoked IPSC activity and unmasked the direct response (i.e., inward current).
Since F2 terminals are typically found on distal dendrites of interneurons and are commonly coupled with an excitatory presynaptic terminal, it has been hypothesized that F2 terminals may behave as independent input–output devices (Bloomfield and Sherman, 1989; Cox et al., 1998). The ability to perform localized input–output computations independent of somatic activity would allow thalamic interneurons to behave as multiplexors, capable of transmitting numerous signals through independently operating F2 terminals. Studies have demonstrated that dendritic GABA release can take place independent of activity at the soma/axon (Cox et al., 1998; Cox and Sherman, 2000; Govindaiah and Cox, 2006; Acuna-Goycolea et al., 2008); however, these studies have relied on widespread pharmacological and synaptic stimulation to activate F2 terminals. Thus, both approaches result in global activation of the entire dendritic arbor and make it impossible to assay whether F2 terminals produce more localized input–output computations.
Here, we have examined local GABA release from the presynaptic dendrites of thalamic interneurons using local glutamate uncaging. This approach allowed us to excite distinct regions of the dendritic tree and thus mimic the function of presynaptic excitatory terminals (Callaway and Yuste, 2002). Our data show that local dendrodendritic inhibition regulates fast synaptic transmission differentially across the dendritic tree of thalamocortical relay neurons. Moreover, this output appears to occur locally through AMPA/NMDA receptor activation and subsequent recruitment of L-type calcium channels.
Materials and Methods
Slice preparation.
Thalamic slices were prepared from young Sprague Dawley rats (postnatal age: 14–23 d) of either sex as described previously (Crandall et al., 2010; Govindaiah et al., 2010). Briefly, rats were anesthetized with pentobarbital sodium (50 mg/kg) and perfused with cold, oxygenated slicing solution before being decapitated. Once brains were removed they were placed immediately in cold (4°C) oxygenated (5% CO2, 95% O2) slicing solution containing the following (in mm): 2.5 KCl, 1.25 NaH2PO4, 10.0 MgSO4, 0.5 CaCl2, 26.0 NaHCO3, 10.0 glucose, and 234.0 sucrose. Thalamic slices (270–300 μm) were cut in the coronal plane for dorsal lateral geniculate nucleus (dLGN) recordings and the horizontal plane for ventrobasal thalamic nucleus (VB) recordings. After slicing, each tissue section was immediately transferred to a holding chamber with warmed (31 ± 1°C), oxygenated physiological saline containing the following (in mm): 126.0 NaCl, 2.5 KCl, 1.25 NaH2PO4, 2.0 MgCl2, 2.0 CaCl2, 26.0 NaHCO3, and 10.0 glucose. After 15–20 min, the holding chamber was reduced to room temperature and slices were further incubated for 60 min before recording.
Whole-cell recording procedures.
Before recording, individual slices were transferred to a recording chamber that was maintained at room temperature with oxygenated physiological saline that was recirculated at 2.5–3 ml/min. Individual neurons were identified using Dodt contrast optics, while whole-cell recordings were obtained using recording pipettes with a tip resistance of 3–6 MΩ. For voltage–clamp recordings the recording pipettes contained the following (in mm): 117.0 Cs-gluconate, 13.0 CsCl, 1.0 MgCl2, 0.07 CaCl2, 0.1 EGTA, 10.0 HEPES, 2.0 Na2-ATP, and 0.4 Na-GTP (pH 7.3, 290 mOsm). For current-clamp recordings, pipettes contained the following (in mm): 117.0 K-gluconate, 13.0 KCl, 1.0 MgCl2, 0.07 CaCl2, 0.1 EGTA, 10.0 HEPES, 2.0 Na2-ATP, and 0.4 Na-GTP (pH 7.3, 290 mOsm). Pipettes also contained Alexa Fluor 594 (50 μm) to allow for imaging. The pipette solutions resulted in a junction potential of ∼10 mV and was corrected for in all voltage recordings. During recordings, the pipette capacitance was neutralized and the access resistance was continually monitored.
Pharmacological agents were prepared and stored as recommended by the manufacturer and subsequently diluted in physiological saline just before use. All pharmacological agents were bath applied at least 10–15 min before subsequent experimental tests. Tetrodotoxin (TTX), 6, 7-dinitroquinoxaline-2,3-dione (DNQX), 3-((R)-2-Carboxypiperazin-4-yl)-propyl-1-phosphonic acid (CPP), 2-(3-carboxypropyl)-3-amino-6-(4-methoxyphenyl)-pyridazinium bromide (SR95531), cis-[Ru(bpy)2(PMe3)GluH2](PF6)2, where bpy is 2,2′bipyridine and PMe3 is trimethylphosphine (RuBi-glutamate), and 2-methyl-6-(phenylethynyl) pyridine hydrochloride (MPEP) were all purchased from Tocris Bioscience.
Glutamate uncaging and analysis.
Photoactivation of RuBi-glutamate (100 μm) was achieved by focusing a one-photon visible laser (405 nm: 100 mW Coherent CUBE diode laser) coupled into the scan head with a photoactivation module and focused at a relay neuron dendrite using a set of galvanometers controlled by TriggerSync software (Prairie Technologies). The lower concentration of RuBi-glutamate minimized the antagonistic effects of the caged compound on GABAergic transmission (Fino et al., 2009). Simultaneous imaging of the recorded neuron was performed by laser excitation (820 nm) via a high numerical aperture objective using a custom two-photon laser scanning microscope (2PLSM, Ultima, Prairie Technologies) coupled with a Ti-sapphire laser (MaiTai HP, Spectra Physics).
Once a location was selected, RuBi-glutamate was released with one of two pulse durations: a long duration (100–200 ms, low-intensity) or a short duration pulse (0.1–3.0 ms, high intensity). The quantification of inhibitory postsynaptic current (IPSC) activity was accomplished using two different approaches: calculating the synaptic charge, and quantifying IPSC frequency. Synaptic charge was estimated by calculating the total area of the response above a simulated direct response (i.e., inward current). The direct responses were recorded in the presence of the GABAA receptor antagonist (SR95531: 10 μm), which blocked all IPSCs. The direct response was simulated by constraining a single exponential fit to the peak inward current for each response and the average time constant calculated from a single exponential fit to the direct response (τ = 799 ± 226; r2 = 0.79 ± 0.06, n = 10). Quantification of IPSC frequency was accomplished using Mini-Analysis software (Synaptosoft). All events were detected automatically by the software and verified post hoc by visual analysis. The threshold for IPSC detection was established from the baseline noise level recorded in the presence of SR95531 (10 μm). For quantification, the average IPSC frequency was calculated from 0.5 s time windows. The change in IPSC frequency in response to stimulation was determined by comparing the poststimulus frequency in response to glutamate release (long pulse: 1.0 s; short pulse: 0.5 s) to the average prestimulus frequency (long pulse: 10 s; short pulse: 1.0 s). The average change in IPSC frequency was than calculated for each location across consecutive stimulations (long pulse: 3 stimulations, 80–240 s interstimulus interval; short pulse: 20 stimulations, 10–20 s interstimulus interval). It is important to note that in some cells that responded to the glutamate application with a highly synchronous outward current presumably consisting of temporal summation of multiple IPSCs, our frequency analysis has likely underestimated the absolute magnitude of the response. Nonetheless, our quantified data using both analysis approaches in the same neuronal population yielded comparable results (e.g., Fig. 2D). For the mapping study, four locations (25–30 μm apart) were tested for each dendrite with 2–5 dendrites sampled per neuron.
Figure 2.
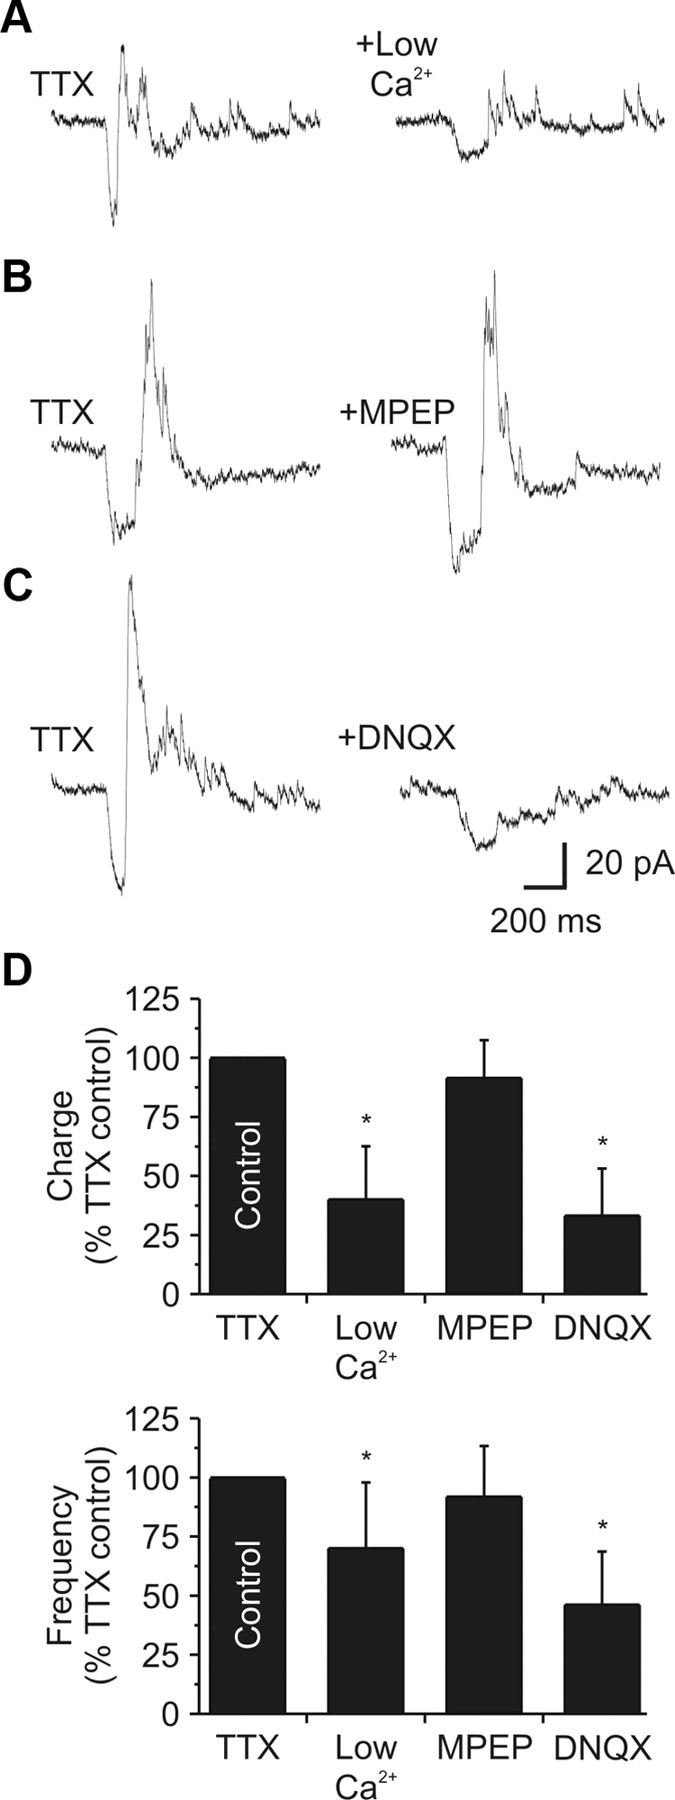
iGluRs regulate local dendrodendritic output. A, Left, In TTX (1 μm), glutamate release increased IPSC activity in a dLGN relay neuron. Right, In a low-Ca2+ (0.2 mm)/high-Mg2+ (6.0 mm) extracellular solution, the evoked IPSC activity was significantly attenuated. Responses recovered after a 10–15 min wash (data not shown). B, Left, In a different neuron (while in TTX: 1 μm), glutamate release increased IPSC activity. Right, addition of the mGluR5 antagonist MPEP (30–50 μm) did not change the evoked IPSC activity. C, Left, In a different neuron (while in TTX: 1 μm), glutamate release increased IPSC activity. Right, Addition of the AMPA receptor antagonist DNQX (20–40 μm) significantly reduced the evoked activity. D, Population data illustrating the decrease in IPSC charge and frequency by both low-Ca2+ and DNQX.
The extent of glutamate diffusion following photorelease was determined by varying the lateral distance between the dendrite and the center of the light beam (Pettit et al., 1997). The relationship between lateral position and the magnitude of the glutamate response was described by a single Gaussian function, and the half-width was used to determine radial spread. Experiments were performed while in TTX (1 μm) on individual dendrites of thalamic reticular and layer IV neocortical neurons because the dendritic pattern of relay neurons made it difficult to isolate individual branches. Unless otherwise indicated, all population data are expressed as mean ± standard deviation and significance is defined as p < 0.05 using a paired t test. We express the total n as the number of dendrites sampled from all neurons.
Results
iGluR-dependent activation of F2 terminals
To monitor dendritic output of interneurons located in the rat dorsal lateral geniculate nucleus, dLGN, we recorded inhibitory postsynaptic currents from thalamocortical relay neurons using an in vitro thalamic slice preparation (Fig. 1B) (Cox and Sherman, 2000; Govindaiah and Cox, 2004). Relay neurons were distinguished from interneurons by both physiological and morphological criteria (Pape and McCormick, 1995; Williams et al., 1996). IPSC activity was recorded in voltage–clamp mode using a cesium-based pipette solution and command voltage of 0 mV to optimize these currents. To stimulate GABA release from dendritic F2 terminals, caged- glutamate was photoreleased near a dendrite of a recorded relay neuron filled with a fluorescent indicator (Alexa Fluor 594; 50 μm) and visualized using a two-photon laser-scanning microscope (820 nm; Fig. 1B,C). A low concentration of RuBi-glutamate (100 μm) was used to reduce the antagonism of inhibitory transmission caused by caged compounds (Fino et al., 2009). At this concentration, RuBi-glutamate produced a 23 ± 11 and 11 ± 6% reduction in the miniature IPSC frequency and amplitude, respectively (n = 6 neurons). Considering that glutamate release could generate Na+-dependent action potentials in interneurons that could lead to increased axonal output (F1 terminal), all experiments were performed in TTX (1 μm) to block action potentials.
To increase the probability of stimulating a presynaptic terminal, we initially used a long duration laser pulse (100–200 ms, 405 nm, and low intensity) to release glutamate over a larger area. To determine the extent of glutamate diffusion (i.e., stimulation size), we calculated the half-width of a Gaussian function fit to glutamate responses obtained when moving the laser laterally across the dendrite of a recorded neuron (see Materials and Methods). Using this method, we estimate that the radial spread of glutamate was 11.0 ± 3.5 μm (200 ms laser pulse; n = 5 neurons). To ensure that the laser pulse repeatedly and reliably produce a consistent response at a single location, regardless of tissue depth or opacity, we measured the direct response onto a relay neuron across three consecutive stimulations (80 s interstimulus interval). When held at −65 mV (in TTX; 1 μm) we observed no significant difference between the amplitude of the first (4.76 ± 1.91 mV) and third response (4.71 ± 2.01 mV, n = 20 dendrites/5 neurons; 200 ms laser pulse; p = 0.75). This suggests that the stimulation parameters produced a stable glutamate response and had no toxic side effects.
As expected, photorelease of glutamate produced a brief inward current in the relay neuron, which likely arises from direct glutamate stimulation of the postsynaptic relay neuron (Fig. 1D, negative response). However, we often observed that the initial inward current was abruptly shortened by a strong outward current and a brief increase in IPSC activity (Fig. 1D, positive response). Positive responses were defined as an increase in IPSC activity that exceeded two standard deviations above baseline IPSC frequency and were qualitatively similar to the TTX-insensitive, F2-dependent responses described previously (Cox et al., 1998; Cox and Sherman, 2000). Subsequent application of the GABAA receptor antagonist SR95531 (10–20 μm) completely blocked the evoked IPSC activity (n = 16 dendrites/5 neurons), which in turn unmasked the inward current (Fig. 1D). The majority (53%) of dLGN neurons recorded produced only negative responses, while the remaining (47%) generated both positive and negative responses (n = 51 neurons). This is consistent with previous anatomical studies indicating that not all dLGN relay neurons are innervated by F2 terminals (presynaptic dendrites; Sherman, 2004).
To confirm that the change in inhibitory activity resulted from a glutamate-mediated release of GABA, we tested the calcium dependence of the positive response. Considering transmitter release from presynaptic dendrites is a calcium-dependent process (Cox et al., 1998; Murphy et al., 2005; Acuna-Goycolea et al., 2008; Castro and Urban, 2009), lowering the extracellular calcium concentration should attenuate the evoked IPSC activity. Using a low-calcium (0.2 mm)/high-magnesium (6.0 mm)-containing extracellular solution, the glutamate-mediated increase in IPSC activity was significantly attenuated (n = 10 dendrites/5 neurons; charge: p < 0.001; frequency: p < 0.01; Fig. 2A,D). The suppression of inhibitory activity reversed following a 10–15 min wash in control extracellular solution.
Since previous studies have demonstrated that type 5 mGluRs (mGluR5) regulate dendrodendritic output at the F2 terminal (Godwin et al., 1996; Govindaiah and Cox, 2006), we proceeded to test whether these receptors were involved with the glutamate-mediated increase in IPSC activity. In the presence of the selective mGluR5 antagonist MPEP (30–50 μm), the glutamate-evoked increase in IPSC activity was unchanged (n = 6 dendrites/4 neurons; charge: p = 0.12; frequency: p = 0.33; Fig. 2B,D). Although previous studies have provided indirect evidence suggesting that iGluRs control dendrodendritic output in the thalamus (Cox and Sherman, 2000; Blitz and Regehr, 2005; Acuna-Goycolea et al., 2008), a direct test of whether this occurs local to F2 terminals and independent of axonal output has been lacking. In the presence of the selective AMPA receptor antagonist DNQX (20–40 μm), the glutamate-evoked increase in IPSC activity was completely blocked (n = 12 dendrites/5 neurons; charge: p < 0.0001; frequency: p < 0.001; Fig. 2C,D). These findings suggest that iGluRs are present near or at F2 terminals and are sufficient to initiate a presumed local GABA release independent of mGluR5 being present or activated.
Interestingly, as shown in Figure 3, we did occasionally observe a lasting increase in IPSC activity (>5 s; 9 of 290 dendrites, 3%). When we applied the selective mGluR5 antagonist MPEP (30–50 μm) the duration of IPSC activity was reduced in four of six locations examined (54.3 ± 31.8%, n = 4 neurons); however, the initial transient increase persisted. Subsequent addition of the AMPA receptor antagonist DNQX (20 μm) completely attenuated the initial response. This observed prolonged IPSC activity is qualitatively similar to the mGluR5-mediated F2 output we have described previously with bath application of selective agonists and tetanic optic tract stimulation (Govindaiah and Cox, 2004, 2006). These data suggest that some F2 terminals are coregulated by both iGluRs and mGluRs.
Figure 3.

Dendrodendritic synapses are regulated by both iGluRs and mGluRs. Top, An example dLGN relay neuron in which focal glutamate release (indicated by the black dot) produced a prolonged change in IPSC activity (in TTX: 1 μm). Right, Expanded trace of the period represented by the gray line. Middle, Addition of the mGluR5 antagonist MPEP (50 μm) significantly reduced the duration of IPSC activity but had minimal effect on the magnitude of the initial response. Bottom, Subsequent application of DNQX (20 μm) blocked the initial increase in IPSC activity.
Glutamate uncaging results in local release from thalamic interneurons
Critical to our interpretation is that glutamate uncaging results in a local release of GABA from interneuron dendrites. However, global release of GABA from thalamic dendrites has been shown to occur from both the active propagation of single action potentials as well as plateau-like calcium spikes across the dendritic tree (Acuna-Goycolea et al., 2008). So we proceeded to test whether our glutamate stimulation caused a local or global excitation of interneurons (i.e., subthreshold or suprathreshold excitation). Using the same stimulation that increased IPSC activity in relay neurons, we photoreleased glutamate along the dendrites of thalamic interneurons while recording the membrane response at the soma (Fig. 4A). At an initial membrane potential of −65 mV, proximal stimulation (0–44 μm from soma) always produced a larger depolarization than distal stimulation (150–263 μm from soma) (proximal: 12.1 ± 6.4 mV, n = 8 dendrites/4 neurons; distal: 3.1 ± 2.3 mV, n = 9 dendrites/4 neurons; p < 0.0001, Student's t test; Fig. 4B). Hyperpolarizing the membrane potential to −85 mV did not alter the amplitude of either the proximal (p = 0.12) or distal response (p = 0.80). Given the small amplitude of the responses, these data suggest that our stimulation was not sufficient to evoke the large plateau-like calcium spike underlying global dendritic release in mouse interneurons (Acuna-Goycolea et al., 2008). There was also a low probability of action potential discharge with distal stimulation (1 of 9 dendrites, 11%) when compared to proximal stimulation (5 of 8 dendrites, 63%). We never observed action potential discharge from a hyperpolarized membrane potential (Fig. 4C). Since F2 terminals are typically found on distal dendrites (Sherman, 2004), these data strongly suggest that our stimulation was subthreshold and that GABA release resulted from local actions and not from global excitation of thalamic interneurons.
Figure 4.

Glutamate uncaging generates local and not global GABA release from thalamic interneurons. A, Right, A 2PLSM image of a local thalamic interneuron filled with Alexa Fluor 594 (50 μm). Without TTX, glutamate uncaging (white shadows) was performed at various locations (L) while recording the voltage response at the soma. Left, Somatic voltage recordings from each location while holding the soma at a depolarized (−65 mV) and hyperpolarized (−85 mV) membrane potential. The star (*) indicates a truncated action potential, while the block dot represents when the laser pulse was delivered. A plateau-like calcium spike (Acuna-Goycolea et al., 2008) was never generated with focal glutamate stimulation. B, Population data indicating that the response amplitude was independent of holding potential and was dependent on location (Proximal: 0–44 μm; Distal: 150–263 μm). C, Population data indicate that the probability of spiking was highest when stimulating proximal locations at a depolarized membrane potential. No spiking was observed when the cell was hyperpolarized.
Glutamate-evoked changes in IPSC activity are mediated by F2 and not F1 terminals
It is also possible that glutamate could increase IPSC activity by direct excitation of axonal terminals (F1 terminals) as well. To eliminate this possibility, we performed similar experiments on relay neurons of the rat ventrobasal complex, VB. Unlike the rat dLGN, which contains both F1 and F2 terminals, the rat VB lacks local interneurons and receives F1 input predominantly from thalamic reticular neurons (Ottersen and Storm-Mathisen, 1984; Ohara and Lieberman, 1993; Arcelli et al., 1997). Therefore, a TTX-insensitive increase in IPSC activity recorded in rat VB relay neurons would indicate a direct action on F1 terminals. To compare relay populations, we systematically stimulated various dendritic locations in a population of dLGN neurons that displayed positive responses (n = 24 neurons) and VB neurons (n = 4 neurons; Fig. 5A,B). As expected, the change in IPSC activity was markedly different between relay neurons (p < 0.0001, Kolmogorov–Smirnov test), as robust changes were frequently observed in dLGN (128 of 290 dendrites, 44%) and never observed in VB neurons (0 of 64 dendrites, 0%; Fig. 5C). Moreover, the change in IPSC activity had a bimodal distribution in dLGN neurons with peaks centered at 13.9 and 133.3%, but only a single peak in VB neurons (−5.4%, Fig. 5D). Based on these findings, we are confident that focal glutamate stimulation results in the local and selective activation of dendrodendritic F2 synapses. This local activation led to a significant 175% increase in IPSC activity above the control baseline frequency in the dLGN relay neurons (control: 5.0 ± 2.0 Hz; glutamate: 12.6 ± 3.8 Hz, n = 128 dendrites/24 neurons; p < 0.0001).
Figure 5.

Glutamate uncaging produces a TTX-insensitive change in IPSC activity in rat dLGN but not VB neurons. A, Left, 2PLSM image of a dLGN relay neuron. The blue shadows indicate two locations where glutamate was released. Right, In TTX (1 μm), glutamate released at location 1 produced a change in IPSC activity (top: positive response). Glutamate released at location 2 did not alter IPSC activity (bottom: negative response). B, Left, 2PLSM image of a VB relay neuron. Right, In TTX (1 μm), glutamate released at locations 1 and 2 produced no change in IPSC activity (negative response). C, Cumulative probability graph showing that the change in IPSC frequency (freq.) was significantly different for VB (red) compared to dLGN neurons (green). D, Shown is a relative frequency histogram of the change in IPSC frequency for both dLGN (green) and VB neurons (red). The dLGN population was best fit by a double Gaussian curve while a single curve best fit the VB population (dashed lines). Bin size, 12%. E, Current-clamp recordings obtained from dLGN and VB neurons after glutamate stimulation in the presence of TTX (1 μm: black) (dLGN: amplitude, 8.6 ± 5.1 mV; area, 3092 ± 2721 mV*ms, n = 74D/19N; VB: amplitude: 4.2 ± 1.7 mV; area, 1142 ± 695 mV*ms, n = 28 dendrites/7 neurons). Subsequent application of SR995531 (10–20 μm: gray) frequently enhanced the transient membrane depolarization evoked in dLGN neurons. Responses recovered after a 10–15 min wash (data not shown). F, Cumulative probability graphs showing SR95531 increased the area and amplitude of the evoked depolarization in dLGN neurons more than in VB neurons.
To determine whether iGluR-mediated F2 output could impact the integration of coupled excitatory input (presumed retinogeniculate via the triad), we evoked a transient membrane depolarization in both dLGN and VB neurons before and after application of the GABAA receptor antagonist SR95531 (10–20 μm; Fig. 5E). Using the same stimulation that increased IPSC activity, the transient membrane depolarization was evoked by stimulating a relay neuron dendrite (25–40 μm from soma) and recorded while holding the soma at −65 mV in current-clamp. At this membrane potential, we avoid activating dendritic T-type calcium channels, which would result in a calcium-dependent, low-threshold spike (Crunelli et al., 1989; Huguenard and Prince, 1992; Crandall et al., 2010; Errington et al., 2010). Overall, the change in area and amplitude of the evoked depolarization after SR95531 application was much greater for dLGN neurons than VB neurons (dLGN: 74 dendrites/19 neurons; VB: 28 dendrites/7 neurons; area: p = 0.03, amplitude, p = 0.09 with a Kolmogorov–Smirnov test; Fig. 5F). These results suggest that an iGluR-mediated activation of a F2 terminal, presumably via a coupled retinogeniculate terminal, would lead to a direct feedforward inhibition of the local excitatory postsynaptic potential generated in the dLGN neuron.
Organization of dendrodendritic connections between relay neurons and interneuron
Next, we wanted to map the synaptic connectivity between the presynaptic dendrites of thalamic interneurons and their relay neuron targets with single-dendrite resolution. To do this, we classified the 290 locations tested (n = 24 neurons) into one of four spatially distinct locations based on measured distance from soma (Fig. 6A). The probability of glutamate stimulation resulting in a change in IPSC activity decreased with increased distance from soma (proximal vs distal; p < 0.0001 with a Kolmogorov–Smirnov test; Fig. 6B). Overall, positive F2 responses were more frequent at proximal locations (15–25 μm; 52 of 69 dendrites: 75.4%) than at distal locations (80–120 μm; 12 of 69 dendrites: 17.4%). This physiological data correlates well with previous anatomical studies suggesting that retinogeniculate terminals, and thus F2 terminals, are preferentially localized to the proximal dendrites of relay neurons (Wilson et al., 1984; Sherman, 2004).
Figure 6.

Inhibitory dendrodendritic synapses are preferentially localized to the proximal dendrites of relay neurons. A, A 2PLSM image of a dLGN relay neuron filled with Alexa Fluor 594 (50 μm). Glutamate was released at four spatially distinct locations along individual primary dendrites. As measured from the soma: (1) Proximal (Prox): 15–25 μm; (2) Intermediate I (Inter. I): 30–45 μm; (3) Intermediate II (Inter. II): 50–75 μm; (4) Distal: 80–120 μm. Shown are the corresponding responses for each of the locations tested. B, A cumulative probability graph for each dendritic location examined. The probability of observing a change in IPSC activity decreased from proximal to distal locations.
A closer inspection of the distribution of F2 terminals (i.e., positive responses) suggested that they could also be clustered along dendrites of individual relay neurons (Fig. 7A). To determine whether clustering occurred, we compared the average change in IPSC frequency for each dendrite (i.e., four locations) and displayed the results using a polar plot (Fig. 7A–C). Comparisons were made only in neurons which had 3–6 dendrites examined (n = 15 neurons). In total, 7 of 15 (47%) dLGN neurons had significant differences in IPSC activity between dendrites (p < 0.035 or less, one-way ANOVA), while the remaining neurons had a more distributed distribution (Fig. 7D). These findings imply that F2 terminals can cluster along individual dendrites in a subpopulation of dLGN neurons.
Figure 7.
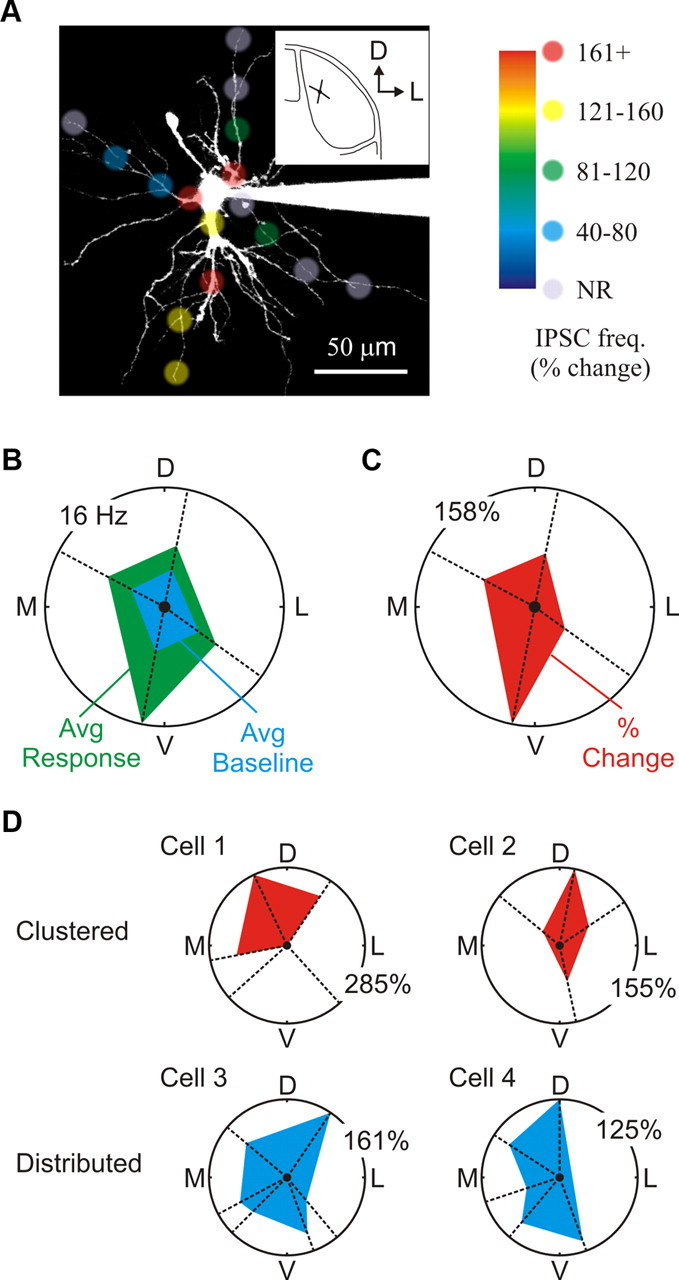
Distribution of dendrodendritic synapses across individual dLGN neurons. A, A 2PLSM image of a dLGN relay neuron filled with Alexa Fluor 594 (50 μm). The image illustrates the spatial distribution and response magnitude for each of the distinct locations tested from this neuron. Note that glutamate stimulation along one of the dendrites consistently evoked a robust change in IPSC activity independent of location. Stimulation along other dendrites produced either weak changes in IPSC activity or no response (NR) at all. The small inset shows both location and orientation of the cell within the dLGN (coronal plane) D, Dorsal; L, lateral. B, Polar plot of the four branches tested as a function of branch orientation [dorsal (D), lateral (L), ventral (V), and medial (M)]. Plotted are the average (Avg) baseline frequencies (blue) and glutamate evoked frequencies (green) for each dendrite. The average for each dendrite was calculated by combining the responses obtained from each of the four locations (three stimulations per location). C, Shown is a polar plot of the average change in IPSC frequency for each dendrite shown in B. A one-way ANOVA was used to compare dendrites across a single neuron. D, Top, Example of two dLGN neurons with clustered F2 innervation patterns (Cell 1 and Cell 2). Note that only three of the five dendrites examined in Cell 1 were innervated by F2 terminals. Bottom, Example of two dLGN neurons with distributed F2 innervation patterns (Cell 3 and Cell 4).
Glutamate uncaging reveals F2 terminals are capable of local input–output computations
Our previous long-duration and low-intensity stimulation allowed us to systematically stimulate different parts of the dendritic tree to map inhibitory dendrodendritic connections between thalamic interneurons and relay neurons. However, since this method of glutamate application resulted in a stimulated area roughly 20 μm in diameter, it likely activated numerous F2 terminals as well as nonsynaptic receptors (Callaway and Yuste, 2002). To reduce the stimulated area and to evoke GABA release from fewer F2 terminals while limiting nonsynaptic receptor activation, we used a short-duration, high-intensity laser pulse (0.1–3.0 ms). We estimated that the radial spread of glutamate using this stimulation was 3.6 ± 0.6 μm (n = 4 neurons). To identify a dendritic region innervated by F2 terminals, we first used the long duration pulse (Fig. 8A). We next searched that region using the shorter stimulation to locate a branch innervated by a F2 terminal(s) (Fig. 8B,C; location 5 and 6). Similar to our previous results, the evoked IPSC activity was sensitive to the GABAA receptor antagonist SR95531 (10 μm: n = 4 neurons; Fig. 8C, red traces). Responses were also reliably obtained across consecutive trials (Fig. 8D). To determine the mechanism behind the change in IPSC activity, we first tested the effect of different iGluR antagonists. Similar to our previous results (Fig. 4), application of the AMPA receptor antagonist DNQX (20 μm) completely blocked the evoked IPSC activity (n = 5 neurons; p < 0.01; Fig. 8E,H). Next, we examined the contribution of NMDA receptors using the receptor antagonist CPP. Bath application of CPP (10 μm) significantly reduced the IPSC activity by 63.6 ± 28.3% (n = 6 neurons; p < 0.01) and blocked nearly all the inward current (Fig. 8F,H). Finally, we wanted to test the contribution of the L-type voltage-gated calcium channel, because previous reports have indicated that this channel plays an important role in GABA release from interneuron dendrites (Acuna-Goycolea et al., 2008; Errington et al., 2011). Application of the selective L-type channel blocker nifedipine (10 μm) reduced the evoked IPSC activity by 62.7 ± 29.7% (n = 9 neurons; p < 0.01) (Fig. 8G,H). This data strongly suggests that individual F2 terminals have the capacity to produce output through the local AMPA/NMDA receptor-mediated recruitment of L-type calcium channels, a mechanism similar to that underlying global dendritic release, but one that does not propagate throughout the dendritic arborization (Acuna-Goycolea et al., 2008).
Figure 8.

Focal glutamate uncaging reveals the mechanism behind local dendrodendritic output. A, A 2PLSM image of a dLGN relay neuron filled with Alexa Fluor 594 (50 μm). To use a more focal stimulation, we first used a long-duration laser pulse (blue shadow: 100 ms, low intensity) to locate a region innervated by F2 terminals. Bottom, In TTX (1 μm) a long stimulation produced a robust change in IPCS activity. B, A high resolution image indicating where focal glutamate uncaging (blue spots) was performed within the selected region shown in A. C, Ten random responses for the six locations are shown. Application of SR95531 (10 μm: red traces) attenuated the evoked IPSC activity at location 6. D, Population data (mean ± SEM) indicates that the increase in IPSC activity can be reliably obtained in consecutive trials (0.05 Hz interval). E, Left, A 2PLSM image of the region where focal uncaging was performed (Pulse: 1.0 ms). Middle, Ten random responses obtained in TTX (1 μm). Right, Subsequent addition of DNQX (20 μm) completely blocked the evoked IPSC activity. F, Left, A 2PLSM image of the region where focal uncaging was performed (Pulse: 0.1 ms). Middle, Ten random responses obtained in TTX (1 μm). Right, Subsequent addition of CPP (10 μm) significantly reduced the evoked IPSC activity and blocked the inward current. G, Left, A 2PLSM image of the region where focal uncaging was performed (Pulse: 2.0 ms). Middle, Ten random responses obtained in TTX (1 μm). Right, Subsequent addition of Nifedipine (NIF: 10 μm) significantly reduced the evoked IPSC activity. H, Population data summarizing the effect each receptor antagonist had on the evoked IPSC frequency. The asterisks indicate statistical significance.
Discussion
In summary, we used glutamate uncaging to examine the nature of local GABA release from the presynaptic dendrites (F2 terminals) of thalamic interneurons. Our results show that output from F2 terminals can be regulated by local iGluRs and that output, when coupled with a postsynaptic excitation (presumed retinogeniculate via the triad), can attenuate the magnitude of the excitatory response generated in a thalamic relay neuron. Local dendritic output is strongly dependent on the activation of AMPA receptors and appears partially dependent on NMDA receptors and voltage-gated L-type calcium channels. Moreover, we demonstrate that iGluR-mediated release was local in nature, as dendritic stimulation of thalamic interneurons had a low probability of action potential discharge and did not generate a plateau-like calcium spike (Acuna-Goycolea et al., 2008). Our data also provides insight into the functional organization of dendrodendritic synapses in the visual thalamus. We find that presynaptic dendrites are preferentially localized to proximal dendrites of relay neurons. Presynaptic dendrites were also frequently found clustered along dendrites of a single postsynaptic relay neuron. Together, these results imply that thalamic interneurons behave as multiplexors, with hundreds of presynaptic dendritic terminals that operate independent of not only the soma but other terminals as well. Since iGluR-mediated dendrodendritic inhibition was not present in all dLGN neurons examined, we believe our results are consistent with in vivo physiology and neuroanatomy described in cat dLGN, where F2 terminals are commonly associated with X but rare for Y thalamic relay neurons (Friedlander et al., 1981; Wilson et al., 1984). Although the distinctions between classes in the rat are not as well established as those in cats and nonhuman primates, relay neurons in the rat do display some morphological correlates (Lam et al., 2005). Thus, our findings regarding local iGluR activation of F2 terminals may provide insight regarding the role of inhibition in the X-visual pathway.
Local dendrodendritic output is controlled by multiple glutamate receptor subtypes
Our finding that F2 terminals are controlled by iGluRs is in agreement with previous observations (Cox and Sherman, 2000; Blitz and Regehr, 2005; Acuna-Goycolea et al., 2008) but differs in that our data suggest that local input is sufficient to produce output. This, coupled with previous work examining the function of mGluR5 at F2 terminals (Godwin et al., 1996; Govindaiah and Cox, 2004, 2006), suggests that local dendritic release from thalamic interneurons is controlled by two distinct classes of glutamate receptors with different properties (Anwyl, 1999). Activation of iGluRs would occur quickly after afferent input, producing a relatively short-duration output that would influence local excitation in the postsynaptic relay neuron. If iGluRs are found on F2 terminals participating in the synaptic triad (Fig. 1A), it suggests that fast output would limit the effectiveness of the coupled retinogeniculate synapse by providing a direct, short latency source of disynaptic inhibition. With such a tight spatial relationship between inhibitory and excitatory inputs, local dendrodendritic inhibition would likely function to regulate the temporal window for a single retinogeniculate input to integrate with other excitatory inputs (Pouille and Scanziani, 2001; Cruikshank et al., 2007). This could ultimately influence spike output from thalamic relay neurons (Usrey et al., 1998; Sincich et al., 2007; Rathbun et al., 2010). In contrast, activation of mGluRs would occur only during states of high afferent activity, resulting in prolonged inhibitory output and long-lasting influence over the responsiveness of the postsynaptic relay neuron. Such output occurring within the synaptic triad has been suggested to provide a local gain control for the relay of retinogeniculate information from thalamus to the neocortex (Govindaiah and Cox, 2004; Sherman, 2004).
Can the same F2 terminal be controlled by both iGluRs and mGluRs? Our present study suggests that some F2 terminals are coregulated by iGluRs and mGluRs, but the evidence for this is largely anecdotal (Fig. 3). In past studies, mGluR-dependent release has been isolated using tetanic stimulation of the optic tract or bath application of mGluR agonists in the presence of iGluR antagonists to attenuate potential suprathreshold activation (action potential) of the interneurons (Govindaiah and Cox, 2004, 2006). We speculate that the relatively low occurrence of mGluR activation observed in this study is likely a result of the uncaging parameters used, which were likely inadequate to activate mGluRs. Although increasing glutamate concentrations or laser intensity/duration may facilitate mGluR activation, such an approach will also lead to increased GABA antagonism via the caged compound and phototoxicity, respectively (Svoboda and Yasuda, 2006; Fino et al., 2009). Therefore, future studies using different experimental designs will be needed to determine the degree of glutamate receptor coexpression at F2 terminals.
Output flexibility of thalamic interneurons
Most dendrites contribute to neural output by collecting, integrating, and communicating afferent information to the soma/axon, where action potentials occur and communication continues to downstream neurons (Spruston et al., 2008). With presynaptic dendrites the afferent synaptic input is now in close proximity to the synaptic release site, making it possible to couple local input with proximal output (Margrie and Urban, 2008). This is exemplified by the unique arrangement of the synaptic triad. Here, the inhibitory F2 terminal is presynaptic to a relay neuron dendrite and postsynaptic to an excitatory terminal that targets the same relay neuron dendrite (Fig. 1A). The tight coupling within this microcircuit appears to provide the ideal machinery for very localized and independent information processing. The ability to perform such actions could allow thalamic interneurons to operate as multiplexors (Bloomfield and Sherman, 1989; Cox et al., 1998), single neurons containing hundreds of independently operating input–output devices. Such a feature is qualitatively similar to that described for amacrine cells, where neurotransmitter release from dendrites is believed to be isolated and reflects the local computation of visual information (Euler et al., 2002; Grimes et al., 2010). If we combine our results demonstrating that F2 terminals are capable of local output with the previous finding that interneuron dendrites support active dendritic conductances that initiate neurotransmitter release (Acuna-Goycolea et al., 2008), it suggests that these neurons are capable of generating both local and global output. Such output flexibility could greatly increase the computational power of an individual thalamic interneuron.
The organization of inhibitory dendrodendritic synapses on thalamic relay neurons
The spatial distribution of inhibitory contacts on a target neuron can significantly impact how inhibition influences information processing in the postsynaptic neuron (Markram et al., 2004). Here, we provide physiological evidence to suggest that inhibitory dendrodendritic synapses are preferentially localized to the proximal dendrites of thalamic relay neurons. This is consistent with anatomical studies indicating that primary afferents (i.e., retinogeniculate terminals) and triadic arrangements are located proximal to the cell body of relay neurons (Guillery, 1969; Montero, 1986; Ralston, 1971; Famiglietti and Peters, 1972). A strong innervation of the proximal region could allow presynaptic dendrites to exert powerful control over the generation and timing of action potentials, a property similar to that of other perisomatic targeting interneurons in the brain (Miles et al., 1996; Markram et al., 2004; Mittmann et al., 2005).
We also found evidence to suggest that dendrodendritic synapses cluster along dendrites in a subpopulation of relay neurons. This observation is intriguing, considering that retinogeniculate axons can differ greatly with respect to their innervation patterns, strength of connections, and the degree to which their terminals participate in triads (Cleland et al., 1971a,b; Hamos et al., 1987; Usrey et al., 1999). By clustering along a branch, F2 terminals could preferentially influence how excitatory inputs are integrated within the specific branch (Spruston et al., 2008). Another possible function of clustered F2 terminals could be to limit the generation or propagation of dendritic spikes along a given branch (Gasparini and Magee, 2006; Larkum and Nevian, 2008; Losonczy et al., 2008). In the case of thalamic relay neurons, clustered dendrodendritic synapses could regulate calcium signals produced by backpropagating sodium or low-threshold calcium spikes along a specific branch (Crandall et al., 2010; Errington et al., 2010).
Footnotes
This work was supported by the National Institutes of Health/National Eye Institute. We thank Dr. G. Govindaiah for helpful comments on the manuscript.
References
- Acuna-Goycolea C, Brenowitz SD, Regehr WG. Active dendritic conductances dynamically regulate GABA release from thalamic interneurons. Neuron. 2008;57:420–431. doi: 10.1016/j.neuron.2007.12.022. [DOI] [PubMed] [Google Scholar]
- Anwyl R. Metabotropic glutamate receptors: electrophysiological properties and role in plasticity. Brain Res Brain Res Rev. 1999;29:83–120. doi: 10.1016/s0165-0173(98)00050-2. [DOI] [PubMed] [Google Scholar]
- Arcelli P, Frassoni C, Regondi MC, De Biasi S, Spreafico R. GABAergic neurons in mammalian thalamus: a marker of thalamic complexity? Brain Res Bull. 1997;42:27–37. doi: 10.1016/s0361-9230(96)00107-4. [DOI] [PubMed] [Google Scholar]
- Blitz DM, Regehr WG. Timing and specificity of feed-forward inhibition within the LGN. Neuron. 2005;45:917–928. doi: 10.1016/j.neuron.2005.01.033. [DOI] [PubMed] [Google Scholar]
- Bloomfield SA, Sherman SM. Dendritic current flow in relay cells and interneurons of the cat's lateral geniculate nucleus. Proc Natl Acad Sci U S A. 1989;86:3911–3914. doi: 10.1073/pnas.86.10.3911. [DOI] [PMC free article] [PubMed] [Google Scholar]
- Callaway EM, Yuste R. Stimulating neurons with light. Curr Opin Neurobiol. 2002;12:587–592. doi: 10.1016/s0959-4388(02)00364-1. [DOI] [PubMed] [Google Scholar]
- Castro JB, Urban NN. Subthreshold glutamate release from mitral cell dendrites. J Neurosci. 2009;29:7023–7030. doi: 10.1523/JNEUROSCI.5606-08.2009. [DOI] [PMC free article] [PubMed] [Google Scholar]
- Cleland BG, Dubin MW, Levick WR. Simultaneous recording of input and output of lateral geniculate neurones. Nat New Biol. 1971a;231:191–192. doi: 10.1038/newbio231191a0. [DOI] [PubMed] [Google Scholar]
- Cleland BG, Dubin MW, Levick WR. Sustained and transient neurones in the cat's retina and lateral geniculate nucleus. J Physiol. 1971b;217:473–496. doi: 10.1113/jphysiol.1971.sp009581. [DOI] [PMC free article] [PubMed] [Google Scholar]
- Cox CL, Sherman SM. Control of dendritic outputs of inhibitory interneurons in the lateral geniculate nucleus. Neuron. 2000;27:597–610. doi: 10.1016/s0896-6273(00)00069-6. [DOI] [PubMed] [Google Scholar]
- Cox CL, Zhou Q, Sherman SM. Glutamate locally activates dendritic outputs of thalamic interneurons. Nature. 1998;394:478–482. doi: 10.1038/28855. [DOI] [PubMed] [Google Scholar]
- Crandall SR, Govindaiah G, Cox CL. Low-threshold Ca2+ current amplifies distal dendritic signaling in thalamic reticular neurons. J Neurosci. 2010;30:15419–15429. doi: 10.1523/JNEUROSCI.3636-10.2010. [DOI] [PMC free article] [PubMed] [Google Scholar]
- Cruikshank SJ, Lewis TJ, Connors BW. Synaptic basis for intense thalamocortical activation of feedforward inhibitory cells in neocortex. Nat Neurosci. 2007;10:462–468. doi: 10.1038/nn1861. [DOI] [PubMed] [Google Scholar]
- Crunelli V, Lightowler S, Pollard CE. A T-type Ca2+ current underlies low-threshold Ca2+ potentials in cells of the cat and rat lateral geniculate nucleus. J Physiol. 1989;413:543–561. doi: 10.1113/jphysiol.1989.sp017668. [DOI] [PMC free article] [PubMed] [Google Scholar]
- Datskovskaia A, Carden WB, Bickford ME. Y retinal terminals contact interneurons in the cat dorsal lateral geniculate nucleus. J Comp Neurol. 2001;430:85–100. doi: 10.1002/1096-9861(20010129)430:1<85::aid-cne1016>3.0.co;2-k. [DOI] [PubMed] [Google Scholar]
- Errington AC, Renger JJ, Uebele VN, Crunelli V. State-dependent firing determines intrinsic dendritic Ca2+ signaling in thalamocortical neurons. J Neurosci. 2010;30:14843–14853. doi: 10.1523/JNEUROSCI.2968-10.2010. [DOI] [PMC free article] [PubMed] [Google Scholar]
- Errington AC, Di Giovanni G, Crunelli V, Cope DW. mGluR control of interneuron output regulates feedforward Tonic GABAA inhibition in the visual thalamus. J Neurosci. 2011;31:8669–8680. doi: 10.1523/JNEUROSCI.0317-11.2011. [DOI] [PMC free article] [PubMed] [Google Scholar]
- Euler T, Detwiler PB, Denk W. Directionally selective calcium signals in dendrites of starburst amacrine cells. Nature. 2002;418:845–852. doi: 10.1038/nature00931. [DOI] [PubMed] [Google Scholar]
- Famiglietti EV, Jr, Peters A. The synaptic glomerulus and the intrinsic neuron in the dorsal lateral geniculate nucleus of the cat. J Comp Neurol. 1972;144:285–334. doi: 10.1002/cne.901440304. [DOI] [PubMed] [Google Scholar]
- Fino E, Araya R, Peterka DS, Salierno M, Etchenique R, Yuste R. RuBi-glutamate: two-photon and visible-light photoactivation of neurons and dendritic spines. Front Neural Circuits. 2009;3:2. doi: 10.3389/neuro.04.002.2009. [DOI] [PMC free article] [PubMed] [Google Scholar]
- Friedlander MJ, Lin CS, Stanford LR, Sherman SM. Morphology of functionally identified neurons in lateral geniculate nucleus of the cat. J Neurophysiol. 1981;46:80–129. doi: 10.1152/jn.1981.46.1.80. [DOI] [PubMed] [Google Scholar]
- Gasparini S, Magee JC. State-dependent dendritic computation in hippocampal CA1 pyramidal neurons. J Neurosci. 2006;26:2088–2100. doi: 10.1523/JNEUROSCI.4428-05.2006. [DOI] [PMC free article] [PubMed] [Google Scholar]
- Godwin DW, Van Horn SC, Eriir A, Sesma M, Romano C, Sherman SM. Ultrastructural localization suggests that retinal and cortical inputs access different metabotropic glutamate receptors in the lateral geniculate nucleus. J Neurosci. 1996;16:8181–8192. doi: 10.1523/JNEUROSCI.16-24-08181.1996. [DOI] [PMC free article] [PubMed] [Google Scholar]
- Govindaiah, Cox CL. Synaptic activation of metabotropic glutamate receptors regulates dendritic outputs of thalamic interneurons. Neuron. 2004;41:611–623. doi: 10.1016/s0896-6273(04)00013-3. [DOI] [PubMed] [Google Scholar]
- Govindaiah G, Cox CL. Metabotropic glutamate receptors differentially regulate GABAergic inhibition in thalamus. J Neurosci. 2006;26:13443–13453. doi: 10.1523/JNEUROSCI.3578-06.2006. [DOI] [PMC free article] [PubMed] [Google Scholar]
- Govindaiah G, Wang T, Gillette MU, Crandall SR, Cox CL. Regulation of inhibitory synapses by presynaptic D dopamine receptors in thalamus. J Neurophysiol. 2010;104:2757–2765. doi: 10.1152/jn.00361.2010. [DOI] [PMC free article] [PubMed] [Google Scholar]
- Grimes WN, Zhang J, Graydon CW, Kachar B, Diamond JS. Retinal parallel processors: more than 100 independent microcircuits operate within a single interneuron. Neuron. 2010;65:873–885. doi: 10.1016/j.neuron.2010.02.028. [DOI] [PMC free article] [PubMed] [Google Scholar]
- Guillery RW. The organization of synaptic interconnections in the laminae of the dorsal lateral geniculate nucleus of the cat. Z Zellforsch Mikrosk Anat. 1969;96:1–38. doi: 10.1007/BF00321474. [DOI] [PubMed] [Google Scholar]
- Hamos JE, Van Horn SC, Raczkowski D, Uhlrich DJ, Sherman SM. Synaptic connectivity of a local circuit neurone in lateral geniculate nucleus of the cat. Nature. 1985;317:618–621. doi: 10.1038/317618a0. [DOI] [PubMed] [Google Scholar]
- Hamos JE, Van Horn SC, Raczkowski D, Sherman SM. Synaptic circuits involving an individual retinogeniculate axon in the cat. J Comp Neurol. 1987;259:165–192. doi: 10.1002/cne.902590202. [DOI] [PubMed] [Google Scholar]
- Holdefer RN, Norton TT, Godwin DW. Effects of bicuculline on signal detectability in lateral geniculate nucleus relay cells. Brain Res. 1989;488:341–347. doi: 10.1016/0006-8993(89)90727-0. [DOI] [PubMed] [Google Scholar]
- Hubel DH, Wiesel TN. Integrative action in the cat's lateral geniculate body. J Physiol. 1961;155:385–398. doi: 10.1113/jphysiol.1961.sp006635. [DOI] [PMC free article] [PubMed] [Google Scholar]
- Huguenard JR, Prince DA. A novel T-type current underlies prolonged Ca2+-dependent burst firing in GABAergic neurons of rat thalamic reticular nucleus. J Neurosci. 1992;12:3804–3817. doi: 10.1523/JNEUROSCI.12-10-03804.1992. [DOI] [PMC free article] [PubMed] [Google Scholar]
- Lam YW, Cox CL, Varela C, Sherman SM. Morphological correlates of triadic circuitry in the lateral geniculate nucleus of cats and rats. J Neurophysiol. 2005;93:748–757. doi: 10.1152/jn.00256.2004. [DOI] [PubMed] [Google Scholar]
- Larkum ME, Nevian T. Synaptic clustering by dendritic signalling mechanisms. Curr Opin Neurobiol. 2008;18:321–331. doi: 10.1016/j.conb.2008.08.013. [DOI] [PubMed] [Google Scholar]
- Losonczy A, Makara JK, Magee JC. Compartmentalized dendritic plasticity and input feature storage in neurons. Nature. 2008;452:436–441. doi: 10.1038/nature06725. [DOI] [PubMed] [Google Scholar]
- Margrie TW, Urban N. Dendrites as transmitters. In: Stuart G, Spruston N, Hausser M, editors. Dendrites. Oxford: Oxford UP; 2008. [Google Scholar]
- Markram H, Toledo-Rodriguez M, Wang Y, Gupta A, Silberberg G, Wu C. Interneurons of the neocortical inhibitory system. Nat Rev Neurosci. 2004;5:793–807. doi: 10.1038/nrn1519. [DOI] [PubMed] [Google Scholar]
- Miles R, Tóth K, Gulyás AI, Hájos N, Freund TF. Differences between somatic and dendritic inhibition in the hippocampus. Neuron. 1996;16:815–823. doi: 10.1016/s0896-6273(00)80101-4. [DOI] [PubMed] [Google Scholar]
- Mittmann W, Koch U, Häusser M. Feed-forward inhibition shapes the spike output of cerebellar Purkinje cells. J Physiol. 2005;563:369–378. doi: 10.1113/jphysiol.2004.075028. [DOI] [PMC free article] [PubMed] [Google Scholar]
- Montero VM. Localization of gamma-aminobutyric acid (GABA) in type 3 cells and demonstration of their source to F2 terminals in the cat lateral geniculate nucleus: a Golgi-electron-microscopic GABA-immunocytochemical study. J Comp Neurol. 1986;254:228–245. doi: 10.1002/cne.902540207. [DOI] [PubMed] [Google Scholar]
- Murphy GJ, Darcy DP, Isaacson JS. Intraglomerular inhibition: signaling mechanisms of an olfactory microcircuit. Nat Neurosci. 2005;8:354–364. doi: 10.1038/nn1403. [DOI] [PubMed] [Google Scholar]
- Ohara PT, Lieberman AR. Some aspects of the synaptic circuitry underlying inhibition in the ventrobasal thalamus. J Neurocytol. 1993;22:815–825. doi: 10.1007/BF01181326. [DOI] [PubMed] [Google Scholar]
- Ottersen OP, Storm-Mathisen J. GABA-containing neurons in the thalamus and pretectum of the rodent. An immunocytochemical study. Anat Embryol (Berl) 1984;170:197–207. doi: 10.1007/BF00319005. [DOI] [PubMed] [Google Scholar]
- Pape HC, McCormick DA. Electrophysiological and pharmacological properties of interneurons in the cat dorsal lateral geniculate nucleus. Neuroscience. 1995;68:1105–1125. doi: 10.1016/0306-4522(95)00205-w. [DOI] [PubMed] [Google Scholar]
- Pettit DL, Wang SS, Gee KR, Augustine GJ. Chemical two-photon uncaging: a novel approach to mapping glutamate receptors. Neuron. 1997;19:465–471. doi: 10.1016/s0896-6273(00)80361-x. [DOI] [PubMed] [Google Scholar]
- Pouille F, Scanziani M. Enforcement of temporal fidelity in pyramidal cells by somatic feed-forward inhibition. Science. 2001;293:1159–1163. doi: 10.1126/science.1060342. [DOI] [PubMed] [Google Scholar]
- Ralston HJ., 3rd Evidence for presynaptic dendrites and a proposal for their mechanism of action. Nature. 1971;230:585–587. doi: 10.1038/230585a0. [DOI] [PubMed] [Google Scholar]
- Rathbun DL, Warland DK, Usrey WM. Spike timing and information transmission at retinogeniculate synapses. J Neurosci. 2010;30:13558–13566. doi: 10.1523/JNEUROSCI.0909-10.2010. [DOI] [PMC free article] [PubMed] [Google Scholar]
- Sherman SM. Interneurons and triadic circuitry of the thalamus. Trends Neurosci. 2004;27:670–675. doi: 10.1016/j.tins.2004.08.003. [DOI] [PubMed] [Google Scholar]
- Sillito AM, Kemp JA. The influence of GABAergic inhibitory processes on the receptive field structure of X and Y cells in cat dorsal lateral geniculate nucleus (dLGN) Brain Res. 1983;277:63–77. doi: 10.1016/0006-8993(83)90908-3. [DOI] [PubMed] [Google Scholar]
- Sincich LC, Adams DL, Economides JR, Horton JC. Transmission of spike trains at the retinogeniculate synapse. J Neurosci. 2007;27:2683–2692. doi: 10.1523/JNEUROSCI.5077-06.2007. [DOI] [PMC free article] [PubMed] [Google Scholar]
- Spruston N, Stuart G, Hausser M. Dendritic integration. In: Stuart G, Spruston N, Hausser M, editors. Dendrites. Oxford: Oxford UP; 2008. [Google Scholar]
- Svoboda K, Yasuda R. Principles of two-photon excitation microscopy and its applications to neuroscience. Neuron. 2006;50:823–839. doi: 10.1016/j.neuron.2006.05.019. [DOI] [PubMed] [Google Scholar]
- Usrey WM, Reppas JB, Reid RC. Paired-spike interactions and synaptic efficacy of retinal inputs to the thalamus. Nature. 1998;395:384–387. doi: 10.1038/26487. [DOI] [PubMed] [Google Scholar]
- Usrey WM, Reppas JB, Reid RC. Specificity and strength of retinogeniculate connections. J Neurophysiol. 1999;82:3527–3540. doi: 10.1152/jn.1999.82.6.3527. [DOI] [PubMed] [Google Scholar]
- Wang X, Wei Y, Vaingankar V, Wang Q, Koepsell K, Sommer FT, Hirsch JA. Feedforward excitation and inhibition evoke dual modes of firing in the cat's visual thalamus during naturalistic viewing. Neuron. 2007;55:465–478. doi: 10.1016/j.neuron.2007.06.039. [DOI] [PMC free article] [PubMed] [Google Scholar]
- Wang X, Vaingankar V, Sanchez CS, Sommer FT, Hirsch JA. Thalamic interneurons and relay cells use complementary synaptic mechanisms for visual processing. Nat Neurosci. 2011;14:224–231. doi: 10.1038/nn.2707. [DOI] [PMC free article] [PubMed] [Google Scholar]
- Williams SR, Turner JP, Anderson CM, Crunelli V. Electrophysiological and morphological properties of interneurones in the rat dorsal lateral geniculate nucleus in vitro. J Physiol. 1996;490:129–147. doi: 10.1113/jphysiol.1996.sp021131. [DOI] [PMC free article] [PubMed] [Google Scholar]
- Wilson JR, Friedlander MJ, Sherman SM. Fine structural morphology of identified X- and Y-cells in the cat's lateral geniculate nucleus. Proc R Soc Lond B Biol Sci. 1984;221:411–436. doi: 10.1098/rspb.1984.0042. [DOI] [PubMed] [Google Scholar]