Background: There are conflicting models for how intracellular Ca2+ allosterically regulates Na+/Ca2+ exchange.
Results: The model of reorientation of the two Ca2+ binding domains upon Ca2+ binding in the NCX1.4 isoform is not supported by data for NCX1.1.
Conclusion: There is motivation to further evaluate the mechanism(s) of Ca2+ activation of NCX1.1.
Significance: Control of Ca2+ efflux in cardiomyocytes is vital for cardiac physiology.
Keywords: Biophysics, Electron Paramagnetic Resonance (EPR), Exchangers, Protein Structure, Sodium Calcium Exchange
Abstract
The cardiac Na+/Ca2+ exchanger (NCX1.1) serves as the primary means of Ca2+ extrusion across the plasma membrane of cardiomyocytes after the rise in intracellular Ca2+ during contraction. The exchanger is regulated by binding of Ca2+ to its intracellular domain, which contains two structurally homologous Ca2+ binding domains denoted as CBD1 and CBD2. NMR and x-ray crystallographic studies have provided structures for the isolated CBD1 and CBD2 domains and have shown how Ca2+ binding affects their structures and motional dynamics. However, structural information on the entire Ca2+ binding domain, denoted CBD12, and how binding of Ca2+ alters its structure and dynamics is more limited. Site-directed spin labeling has been employed in this work to address these questions. Electron paramagnetic resonance measurements on singly labeled constructs of CBD12 have identified the regions that undergo changes in dynamics as a result of Ca2+ binding. Double electron-electron resonance (DEER) measurements on doubly labeled constructs of CBD12 have shown that the β-sandwich regions of the CBD1 and CBD2 domains are largely insensitive to Ca2+ binding and that these two domains are widely separated at their N and C termini. Interdomain distances measured by DEER have been employed to construct structural models for CBD12 in the presence and absence of Ca2+. These models show that there is not a major change in the relative orientation of the two Ca2+ binding domains as a result of Ca2+ binding in the NCX1.1 isoform. Additional measurements have shown that there are significant changes in the dynamics of the F-G loop region of CBD2 that merit further characterization with regard to their possible involvement in regulation of NCX1.1 activity.
Introduction
The Na+/Ca2+ exchanger NCX.1.1 plays a major role in the cardiac contractile cycle via efflux of Ca2+ from the cardiomyocyte after its transient rise during systole. Under normal physiological conditions, the exchanger utilizes the electrochemical Na+ gradient to extrude one Ca2+ ion for influx of three Na+ ions (1). This exchange process is vital to proper timing of the Ca2+ transient as studies have provided evidence that some cardiac arrhythmias are related to altered exchanger properties and that the exchanger has atypical function in heart failure (2–4).
NCX1.1 is regulated by the same ions that it exchanges. Previous studies have shown that intracellular Na+ can inactivate the exchanger (5). Conversely, intracellular Ca2+ overcomes the Na+-dependent inactivation and leads to the physiologically important increase in exchange activity (6). This activation is vital to proper cardiomyocyte function. There are a number of splice variants of the NCX1 family of proteins with the ACDEF splice variant (NCX1.1) being the form expressed in cardiomyocytes (7). Most current topological models for the NCX1 family of proteins predict nine transmembrane α-helices and a large intracellular domain located between helices 5 and 6 (8, 9). The intracellular domain can minimally be subdivided into four separate domains: an exchange inhibitory peptide (XIP)3 domain, which is proximal to the membrane bilayer, an α-catenin-like domain, and two highly homologous Ca2+ binding domains (7), all of which are connected by presumably unstructured linkers. Studies over the past decade have led to characterization of the two tandem regulatory Ca2+ binding domains, denoted Ca2+ binding domain 1 (CBD1) and Ca2+ binding domain 2 (CBD2), which are located in the central portion of the primary sequence of the large intracellular domain (e.g. Ref. 7)). CBD1 binds four Ca2+ ions (10), and CBD2 binds two Ca2+ ions (11) in both the NCX1.4 and NCX1.1 splice variants. However, recent studies have indicated that the binding affinity of the four Ca2+ ions to CBD1 in NCX1.1 is higher affinity than in the NCX1.4 isoform (12).
Structural studies by NMR (7, 13, 14) and by x-ray crystallography (10, 11) on isolated CBD1 and on the isolated CBD2-AD splice variant have shown that these domains adopt an immunoglobulin fold that is composed of a seven-stranded β-sandwich of two antiparallel β-sheets. Most structural studies to date have been carried out on the AD splice variant of CBD2, which has a shorter F-G loop between β-strands F and G than the ACDEF splice variant that is expressed in cardiomyocytes. Collectively, these studies have led to identification of the regions of the proteins that show changes in structure and dynamics upon Ca2+ binding to both isolated domains. Even though the atomic resolution structures of the isolated CBD1 and CBD2-AD are well established, the molecular mechanism of how binding of Ca2+ regulates exchanger activity remains uncertain. Recent studies by Hilge et al. (12) have led to the proposal that Ca2+ regulation of the exchanger involves a dual electrostatic switch mechanism where binding of Ca2+ to both CBD1 and CBD2-AD is required for structural rearrangements within CBD12 and that this could be the basis for regulation of exchanger activity. Small angle x-ray scattering data in this same study suggested that a similar structural rearrangement might also occur in the ACDEF splice variant. In both isoforms the small angle x-ray scattering data suggested that Ca2+ binding led to a more compact structure where the N- and C-terminal ends were closer together. Ottolia and co-workers (16) have reported Ca2+-dependent changes in fluorescence resonance energy transfer (FRET) efficiency in a CBD12 construct that was targeted to the plasma membrane in Xenopus laevis oocytes by fusion to a Ki-Ras sequence (15). In this construct, the fluorescent proteins CFP and YFP were incorporated into CBD12 at the N and C termini, respectively, to serve as the donor-acceptor pair. The results from these FRET studies were interpreted as evidence for a Ca2+-dependent increase in distance between the N- and C-terminal ends.
Brüschweiler and co-workers have reported an extensive study of the structure and dynamics of full-length CBD12-AD by NMR (17). Two important conclusions were provided in these studies. First, in the AD splice variant of NCX1, CBD1 and CBD2 are arranged in a nearly linear fashion relative to each other in both the Ca2+-bound and Ca2+-free forms. Second, the two Ca2+ binding domains of full-length CBD12 are joined by a rigid linker in the presence of Ca2+. However, in the absence of Ca2+, the linker (amino acids 501–503) becomes more flexible, allowing the two domains to rotate somewhat independently of each other, giving rise to an ensemble of dynamic structures centered about the more static elongated structure that exists in the presence of Ca2+. Based upon their observations, it was hypothesized that this transition from a flexible link between CBD1 and CBD2 in the absence of Ca2+ to a rigid link in the Ca2+-bound form might be the origin of the signal that is transmitted to the transmembrane domain to allosterically regulate Na+/Ca2+ exchange.
Zheng and co-workers (18) obtained x-ray crystal structures of CBD12 from two different splice variants of CALX, a NCX homolog expressed in Drosophila sensory neurons. Despite a high degree of sequence homology between CBD12 in CALX and the mammalian NCXs, binding of intracellular Ca2+ to both CALX splice variants (CALX 1.1 and 1.2) results in inhibition of Na+/Ca2+ exchange rather than stimulation. Based upon the results from the crystal structures and additional Ca2+ binding analysis, it was proposed that the Ca2+ regulatory signal involves interdomain conformational changes that are induced by Ca2+ binding.
In the present studies site-directed spin labeling has been employed in conjunction with conventional continuous-wave electron paramagnetic resonance (cw-EPR) to determine how Ca2+ binding to the cardiac CBD12-ACDEF splice variant alters the dynamics of specific regions of the protein. The results from these studies are in qualitative agreement with previous NMR studies on the isolated domains with regard to which regions of the Ca2+ binding domains show the greatest changes upon Ca2+ binding. Pulsed electron-electron double resonance (DEER) has been employed to measure inter-probe distances, and these data have been utilized to construct a family of structural models for CBD12 in the Ca2+-free and Ca2+-bound forms. These latter studies show that CBD1 and CBD2 are not arranged in an orientation lengthwise antiparallel and in close proximity as hypothesized in early studies (7) but rather are oriented in an almost linear arrangement as suggested by the more recent small angle x-ray scattering studies (12) and by the NMR studies of Brüschweiler and co-workers (17). Most significantly, for the NCX1.1 isoform, both DEER measurements and EPR measurements in solution show that the relative orientations of the two Ca2+ binding domains are not significantly altered upon Ca2+ binding. This result strongly suggests that the allosteric signal that regulates the NCX1.1 isoform of the exchanger involves other types of changes in the structure and/or dynamics of CBD12 rather than rigid-body reorientation of the two Ca2+ binding domains relative to each other. Additional studies indicated that binding of Ca2+ does lead to changes in the dynamics of the F-G loops of CBD1 and CBD2. These latter results coupled with previous studies reported in the literature (12, 14, 19) suggest that further investigations of this region of the Ca2+ binding domains of CBD12 are warranted.
EXPERIMENTAL PROCEDURES
Protein Preparation and Spin Labeling
The full-length rat NCX1.1 (ACDEF splice variant) cDNA was generously provided by Dr. J. Lytton at the University of Calgary. For convenience, residue numbers were adopted from canine NCX1.1 ignoring the first N-terminal 32 residues in rat NCX1.1. NdeI (5′) and XhoI (3′) restriction sites were generated at each terminus of the nucleotide sequence encoding residues 360–685 using the QuikChange site-directed mutagenesis kit (Stratagene, La Jolla, CA), and the resultant PCR fragment was ligated into the pET19b+ expression vector (Novagen, Madison, WI). All four endogenous cysteines were replaced with alanines to create a cysteine-less (ΔC-CBD12) construct. Single or double cysteine mutants were then produced by introducing cysteines at desired sites on the ΔC-CBD12 construct. The sequences of all the mutants were confirmed by DNA sequencing. The mutant DNAs were then transformed into BL21(DE3)PlysS competent cells (Stratagene, La Jolla, CA).
One liter of LB broth was inoculated with 10 ml of overnight culture. The culture was grown at 37 °C to an A600 of 0.6–0.8 and transferred to an ice-water bath to cool. Protein overexpression was induced by adding 1 mm isopropyl-β-thiogalactoside and incubating at 27 °C for 4 h. After harvest, the cell pellet was resuspended in 100 ml of lysis buffer that contained 20 mm Tris-HCl, 300 mm NaCl, 0.2 mm DTT, 16 mm imidazole, 40 units/ml lysozyme, and EDTA-free protease inhibitor mixture (Roche Applied Science), pH 8.0, and kept frozen at −80 °C until use.
After thawing, the cell suspension was lysed by 2 min of sonication on ice that was followed by incubation with 1% (w/v) Triton X-100, 0.5 units/ml of DNase, and 0.5 units/ml of RNase at 4 °C for 30 min. The lysate was centrifuged at 12,000 rpm (JA-20 rotor, Beckman Coulter, Inc., Indianapolis, IN) for 30 min. The clear lysate was incubated for 1 h with 2 ml of nickel-nitrilotriacetic acid resin (Qiagen, Valencia, CA) that was pre-equilibrated with lysis buffer. The resin was washed with 100 column volumes of wash buffer containing 20 mm Tris HCl, 150 mm NaCl, and 16 mm imidazole, pH 7.4. Single and double mutant proteins were then spin-labeled at 4 °C overnight on the column with a 10-fold molar excess of 1-oxyl-2,2,5,5-tetramethyl-Δ-3-pyrroline-3-methyl methanethiosulfonate (MTSSL) spin label to generate the R1 side chain shown in Fig. 1 (Toronto Research Chemicals, North York, ON, Canada). Labeled protein bound to the column was washed with buffer containing 20 mm Tris-HCl and 60 mm imidazole, pH 7.5. Protein was eluted with 20 mm Tris-HCl and 250 mm imidazole, pH 7.5. Partially purified protein from the nickel-nitrilotriacetic acid column was further purified using a DEAE anion exchange column (TSK DEAE 650M; Ace Scientific, Cherry Hill, NJ) using a linear 0–0.8 m NaCl gradient for elution. The eluted proteins were concentrated in an Amicon Ultra-4 centrifugal filter device (30-kDa nominal molecular mass cutoff, Millipore, Bedford, MA) to the desired protein concentration. The apparent molecular weight and purity of each labeled protein was assessed by SDS-PAGE gel (20). All samples used for cw-EPR and DEER studies were greater than 95% pure as determined from the band intensities on the gels.
FIGURE 1.
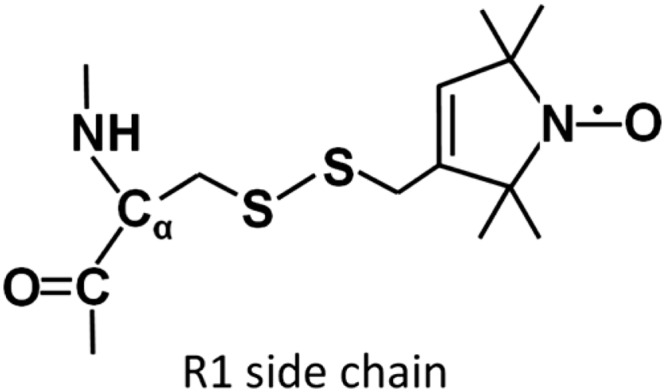
The spin-labeled side-chain R1 resulting from reaction of MTSSL with cysteine.
NCX1.1 Ca2+-induced Outward Currents
HEK293 cells transfected with either wild-type (WT) or ΔC (the four endogenous cysteines in CBD12 replaced with alanines) NCX1.1 were analyzed by whole-cell patch clamp recording as described in previous studies (21, 22). The pipette solution contained 100 mm NaCl, 5 mm KCl, 10 mm HEPES, 10 mm tetramethylammonium hydroxide, 20 mm triethylammonium chloride, 2 mm MgCl2, 1 mm Na2ATP, 5 mm EGTA, 4.28 mm CaCl2, ([Ca2+]free = 1 μm). The extracellular solutions contained 145 mm LiCl, 10 mm HEPES, 10 mm tetramethylammonium hydroxide, 1 mm MgCl2, 10 mm glucose, and either 0.5 mm EGTA or 2 mm CaCl2. Solution exchange was achieved by a piezoelectric translator moving a theta glass with EGTA solution flowing continuously through one barrel and Ca2+ solution through the other barrel. Voltage clamp was conducted with a patch clamp amplifier (Axopatch 200B) at a holding potential of 0 mV. Current traces were low pass-filtered at 1 kHz and sampled at 2 kHz. For display, traces were filtered at 250 Hz. Current-voltage (I-V) relationships were recorded with a voltage ramp protocol over the range −80 to +80 mV (0.5 V/s) at the first time interval during the base-line EGTA solution and at the second time interval during the Ca2+ solution. Outward current was generated when wild-type or ΔC NCX1.1-transfected cells internally dialyzed with a high Na+ were exposed to bath solution containing 2 mm Ca2+. The outward current corresponds to the electrogenic movement of Na+ through the molecule in exchange for Ca2+. The magnitude and time-course of the currents are similar to previous reports (21, 22). Control cells transfected with empty vector exhibited currents <1 pA under this protocol (data not shown). The voltage dependence of outward currents was examined under these conditions, which only permit outward Na+/Ca2+ exchange currents. The NCX1.1 I-V plot was calculated by the current in the presence of Ca2+ minus the base-line nonspecific current in EGTA.
Circular Dichroism (CD) Measurements
To assess any global changes in secondary structure due to replacement of WT cysteines with alanines, CD spectra were recorded on wild-type CBD12 and ΔC-CBD12. Spectra were recorded on a Jasco J-810 system (Jasco Inc., Easton, MD) at room temperature in a 0.1-cm path length cell. All spectra were obtained from samples in buffer containing 10 mm potassium phosphate, pH 7.4. The data were collected from 190 to 260 nm at a scanning speed of 50 nm/min. The raw data, in millidegrees (θ), were converted to molar ellipticity ([θ]) using the relationship:
where n is the number of amino acid residues, c is the protein concentration in mm, and l is the path length in cm.
cw-EPR Measurements and Data Analysis
cw-EPR spectra were collected at X-band (9.8 GHz) on a Bruker EMX spectrometer fitted with a TM110 cavity (BrukerBiospin, Billerica, MA) using 5-milliwatt microwave power and 1-gauss field modulation at 100 kHz. Samples were prepared in 20 mm Tris-HCl, 150 mm NaCl, pH 7.5, in the 80–120 μm concentration range, and spectra were collected at room temperature in 50-μl glass capillaries (Kimble Glass, Inc., Vineland, NJ). Short inter-probe distances (<20 Å) were measured on samples in 50% glycerol at 2 °C. The resultant EPR spectra were analyzed using a convolution method that assumed a Gaussian distance distribution as described in previous work (e.g. Refs. 23 and 24). Ca2+-bound and Ca2+-free samples were prepared by treating proteins with 10 mm CaCl2 or 10 mm EDTA, respectively, before EPR measurements.
Four-pulse DEER Measurements and Data Analysis
The four-pulse DEER experiment was performed at X-band (9.5 GHz) on a Bruker EleXsys 580 spectrometer equipped with a Bruker split ring resonator (ER 4118X-MD5). A standard 4-pulse sequence was employed with a 32-ns π pulse and a 16-ns π/2 pulse. All measurements were recorded at 80 K as described in previous work (25–27). Samples were prepared in 20 mm Tris-HCl, 150 mm NaCl buffer, pH 7.5, containing 30% (w/w) glycerol in the 150–250 μm spin concentration range and loaded into 2.4 mm inner diameter quartz capillaries (Wilmad LabGlass, Buena, NJ). All DEER data were analyzed using software developed in-house that simultaneously fits the background signal as a function of an effective spin concentration and radius of the molecule or complex while determining the specific interactions of interest using a distance distribution defined as a sum of gaussians (28). This approach, which takes the excluded volume of the molecule or complex into account, typically gave better fits to the data than those obtained using a priori background correction. All of the DEER data shown in the figures are with the background removed subsequent to the analysis.
Molecular Modeling
Explicit modeling of the spin label R1 side chains at each of the sites that were utilized for interdomain DEER distance measurements was carried out using the MMM program developed by Jeschke and co-workers (29). These modeling calculations were performed on the MATLAB platform (The Mathworks, Inc., Natick, MA). Briefly, R1 side chains were modeled on the seven sites in each structure of CBD1 (PDB code 2DPK) and CBD2 (PDB code 2QVM), and the resultant spatial distribution of MMM rotamers were calculated at 80 K. The average cartesian coordinate of the nitroxide electron at the spin-labeled site was taken from the probability-weighted sum of coordinates from each rotamer as shown in the following formula.
 |
where pi is the probability of finding the ith rotamer of the R1 side chain at coordinates (xi, yi, and zi), and n is the number of allowed rotamers.
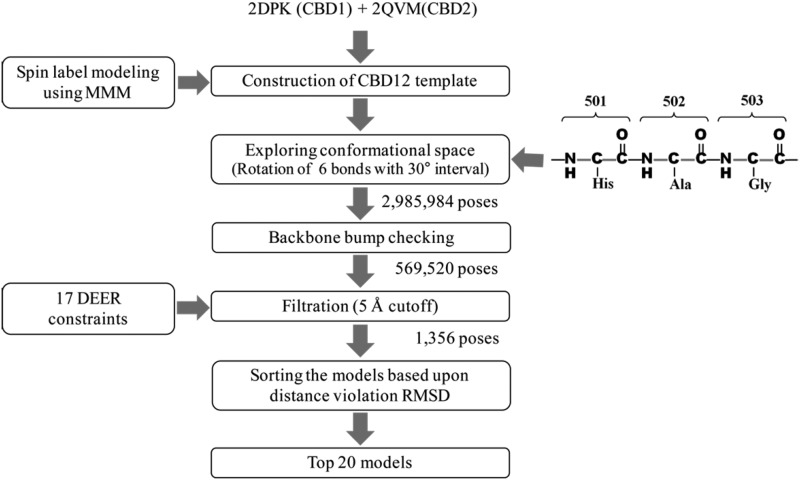
The structural models of CBD1 and CBD2 were covalently linked in silico by manually introducing a peptide bond between residue 500 in CBD1 and residue 501 in CBD2 using PyMOL software to generate a CBD12 template structure. Inspection of two crystal structures from isolated CBD1 and CBD2 indicates that the three consecutive residues 501–503 form a potentially flexible interdomain linker (17). Thus, a set of CDB12 structures that represents the full range of possible orientations of two rigid bodies relative to each other was generated by systematically rotating the backbone bonds along the linker region using Chimera and in-house written python scripts. The three pairs of backbone bonds flanking the two peptide bonds in residues 501 through 503 (Fig. 2) were subjected to systematic rotations, whereas the two peptide bonds were fixed in the trans-configuration. The resultant conformers were initially checked for backbone clashes in the absence of side chains, and the conformers that contained any steric clash between backbone atoms were discarded. The remaining poses (569,520 of 2,985,984 conformers; 19.1%) were subsequently filtered with the 17 interdomain DEER distance constraints obtained in the presence of Ca2+ (5 Å cutoff) resulting in 1356 poses. The filtered models were ranked based upon the root mean square deviation values for the distance violations from experimental DEER distances, and the top 20 poses were selected as the solution set of structural models of NCX1.1 for its Ca2+-bound form. The same approaches were used to obtain structural models for the Ca2+-free form.
FIGURE 2.
Molecular modeling. Explicit spin label modeling was carried out to build structural models of CBD12 using 17 interdomain DEER distances as structural constraints. These constraints were utilized to determine the relative orientation between the two Ca2+ binding domains according to the scheme shown and as described under “Experimental Procedures.” RMSD, root mean square deviation.
RESULTS
Effects of Substitution of Alanines for Cysteines on the Whole-cell Na+/Ca+2 Exchange Properties and Secondary Structure of CBD12
WT-CBD12 from NCX1.1 contains four endogenous cysteine residues at positions 383, 387, 485, and 557. To carry out high quality site-directed spin labeling experiments, it was necessary to replace all of the endogenous cysteines with another amino acid that would not be chemically reactive with the MTSSL probe used for EPR detection. Alanine was chosen for this purpose and used to generate the ΔCys-CBD12 (ΔC) construct used in these studies. The first questions that were addressed were whether these substitutions disrupted Na+/Ca2+ exchange or the secondary structure of the WT protein. Whole-cell patch clamp measurements of Na+/Ca2+ exchange in full-length WT and ΔC proteins expressed in HEK293 cells were virtually indistinguishable (data not shown). WT and ΔC-CBD12 also yielded essentially identical CD spectra indicating that the secondary structure was preserved in the ΔC-CBD12 protein. In addition, both WT and the ΔC-CBD12 showed the same changes in CD profiles below 210 nm in the presence of saturating levels of Ca2+ (data not shown). These results indicate that ΔC-CBD12 retains critical WT like properties and that it provides a suitable background into which single or double cysteine substitutions could be made to carry out site-directed spin labeling experiments. These results are supported by the early study by Philipson and co-workers (8) where it was shown that none of the 15 endogenous cysteine residues in full-length NCX1.1 was essential for activity of the exchanger.
Effects of Ca2+ Binding on the Dynamics of Selected Spin-labeled Sites in the CBD1 Domain in CBD12
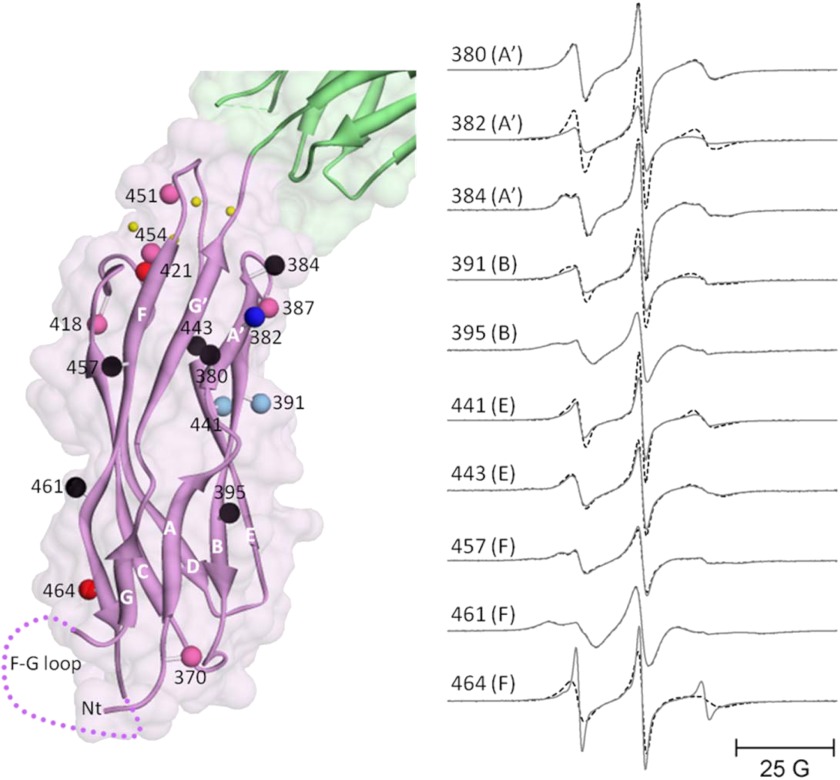
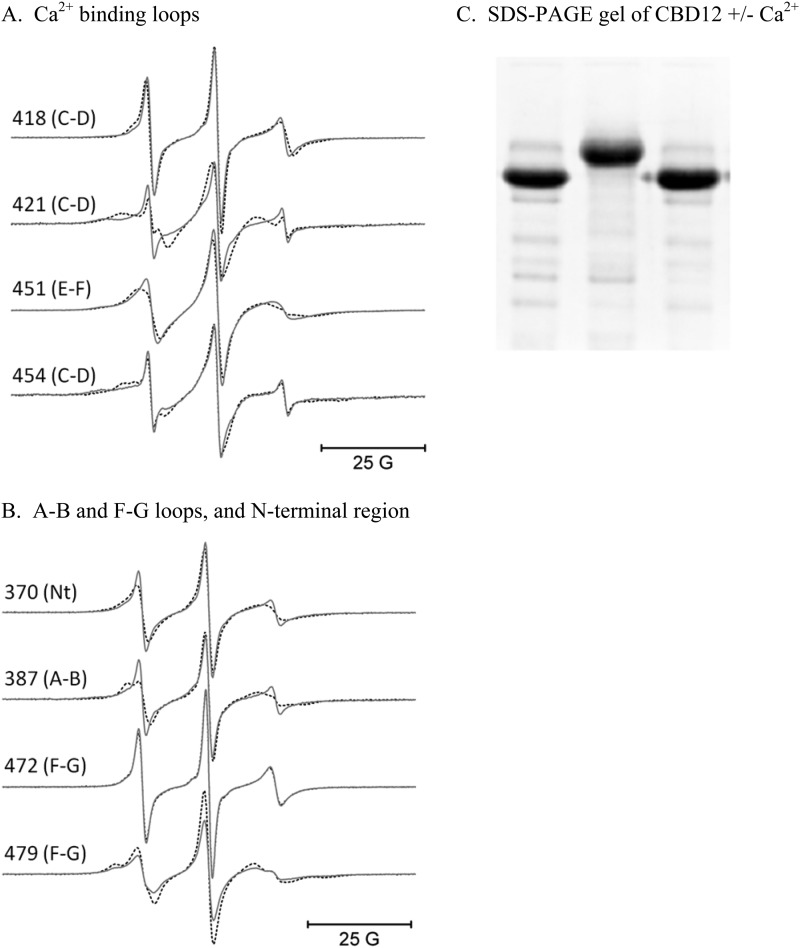
Fig. 3, left panel, shows the sites on CBD1 that were chosen for spin labeling in full-length CBD12. The spheres at each site chosen are color-coded to indicate whether R1 side chain motion was unaffected (black), decreased (shades of red), or increased (shades of blue) following the addition of a saturating level of Ca2+. Many of the sites chosen in the highly structured β-sandwich region show no sensitivity to Ca2+ binding including sites 380 and 384 on the A′ strand, site 395 on the B strand, site 443 on the E strand, and sites 457 and 461 on the F strand. However, some sites in the β-sandwich region do show sensitivity to Ca2+ binding including site 382 in the A′ strand, 391 in the B strand, 441 in the E strand, and 464 in the F strand. The EPR spectra recorded for each of those positions in the presence or absence of Ca2+ are shown in Fig. 3, right panel. These results, which are in qualitative agreement with previous NMR studies on isolated CBD1 (e.g. Ref. 13), show that binding of Ca2+ (small yellow spheres in Fig. 3) to CBD12 is sensed at some positions distal from the Ca2+ binding loops. Also, in agreement with previous NMR studies on isolated CBD1 (7, 14), spin-labeled R1 side chains at sites 418, 421, 451, and 454 in the Ca2+ binding loop all exhibit decreased mobility upon Ca2+ binding as shown in Fig. 4. The decrease in R1 side chain motion in the Ca2+ binding loops upon Ca2+ binding indicates that the EDTA treatment employed to remove Ca2+ from CBD1 is effective even though previous studies have suggested that binding of Ca2+ to these sites is apparently higher affinity than for the NCX1.4 isoform (12). Also shown in Fig. 4 are the results from SDS-PAGE of CBD12 in the presence of Ca2+, after EDTA treatment, and then after the addition of Ca2+ back to the EDTA-treated sample. The well known gel shifts in mobility of CBD12 in the Ca2+-free and Ca2+-saturated forms (7) provides further evidence that the EDTA treatment described under “Experimental Procedures” is highly effective in removing bound Ca2+ from the protein. Other sites in loop regions that showed changes in mobility upon Ca2+ binding included sites 418 and 421 in the C-D strand loop as well as site 479 in the F-G strand loop. Site 472 in the F-G loop was highly mobile and showed no sensitivity to Ca2+ binding as demonstrated by the EPR data in Fig. 4.
FIGURE 3.
Sites selected for site-directed spin labeling in the CBD1 domain of CBD12 and their corresponding EPR spectra. The ribbon diagram of CBD1 is shown in purple superimposed on the space-filling model in the left panel (coordinates were from PDB 2DPK). The sites where single R1 spin-labeled side chains were incorporated are shown as solid spheres that are centered at the coordinates of the β-carbon of each residue. The spheres are color-coded to indicate changes in spin-labeled side chain mobility upon Ca2+ binding as follows: black, no change; bright red, substantial decrease; pale red, subtle decrease; bright blue, substantial increase; pale blue, subtle increase. The positions of the four Ca2+-binding sites are shown as small yellow spheres. The position of the F-G loop is shown schematically in dots. The green ribbon diagram and space-filling model at the top are the apical portion of the CBD2 domain. The EPR spectra in the right panel are from the surface sites in CBD1 and are shown as solid lines (no bound Ca2+) and dashed lines (saturating level of bound Ca2+). All spectra have been normalized to the same integrated signal intensity.
FIGURE 4.
EPR spectra from the Ca2+ binding loops, the A-B and F-G loops, and the N terminus of the CBD1 domain of CBD12. The solid lines in panels A and B are EPR data collected with no bound Ca2+, and the superimposed dashed lines are data collected in the presence of saturating level of Ca2+. The data in panel C were collected from wt-CBD12 in the presence of 10 mm Ca2+ (left lane) after EDTA treatment (center lane) and after the addition of 10 mm Ca2+ to the EDTA-treated sample (right lane).
Effects of Ca2+ Binding on the Global Structure of the CBD1 Domain in CBD12
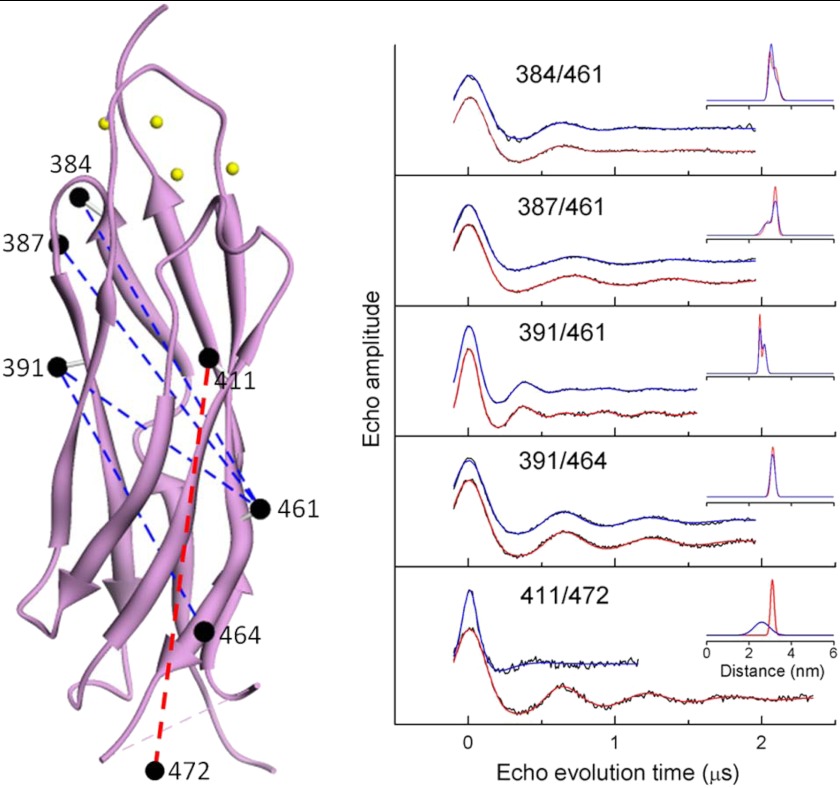
To determine whether Ca2+ binding to CBD12 produced any global structural changes in the CBD1 domain, five separate pairs of spin-labeled R1 side chains were incorporated as shown by the black spheres in Fig. 5, left panel. DEER was employed to measure the average inter-probe distance and distribution of distances between each of these five pairs as described under “Experimental Procedures” and in detail in previous work (e.g. Ref. 25–27). As shown by the DEER data in Fig. 5, right panel, the four inter-probe distances involving residues in the structured β-sandwich region of CBD1 showed no sensitivity to Ca2+ binding, indicating that the β-sandwich region does not undergo any major global structural change. However, both the average inter-probe distance and distribution of distances were highly sensitive to Ca2+ binding between probes at site 411 in the β-sandwich region and site 472 in the flexible F-G loop of CBD1. This latter result, in combination with the observation of substantial changes in the mobility of residue 479 in the F-G loop as shown in Fig. 4, indicates that the localized changes in mobility of the Ca2+ binding loops is propagated over a long distance to affect the mobility and average position of residues in the F-G loop of CBD1. As is evident from the structural models in Figs. 9 and 11, below, the Ca2+-binding sites on CBD2 are far removed from the F-G loop of CBD1 in full-length CBD12, and therefore, changes in the mobility of the Ca2+ binding loops of CBD2 are unlikely to be directly responsible for the observed changes.
FIGURE 5.
Pairs of sites selected for site-directed spin labeling in the CBD1 domain of CBD12 and their corresponding DEER spectra. The ribbon diagram of CBD1 is shown in purple in the left panel (coordinates were from PDB 2DPK). The sites where pairs of R1 spin labeled side chains were incorporated are shown as solid spheres connected by dashed lines. The spheres are centered at the coordinates of the β-carbon of each selected residue. The positions of the four Ca2+-binding sites are shown as small yellow spheres. The DEER data for each of the five pairs of sites are shown as solid black lines in the right panel. The fits to the DEER data are shown as solid blue lines (no bound Ca2+) and solid red lines (saturating level of bound Ca2+). The average distances and widths of the distance distributions are shown in the insets to each DEER data set in Å.
FIGURE 9.
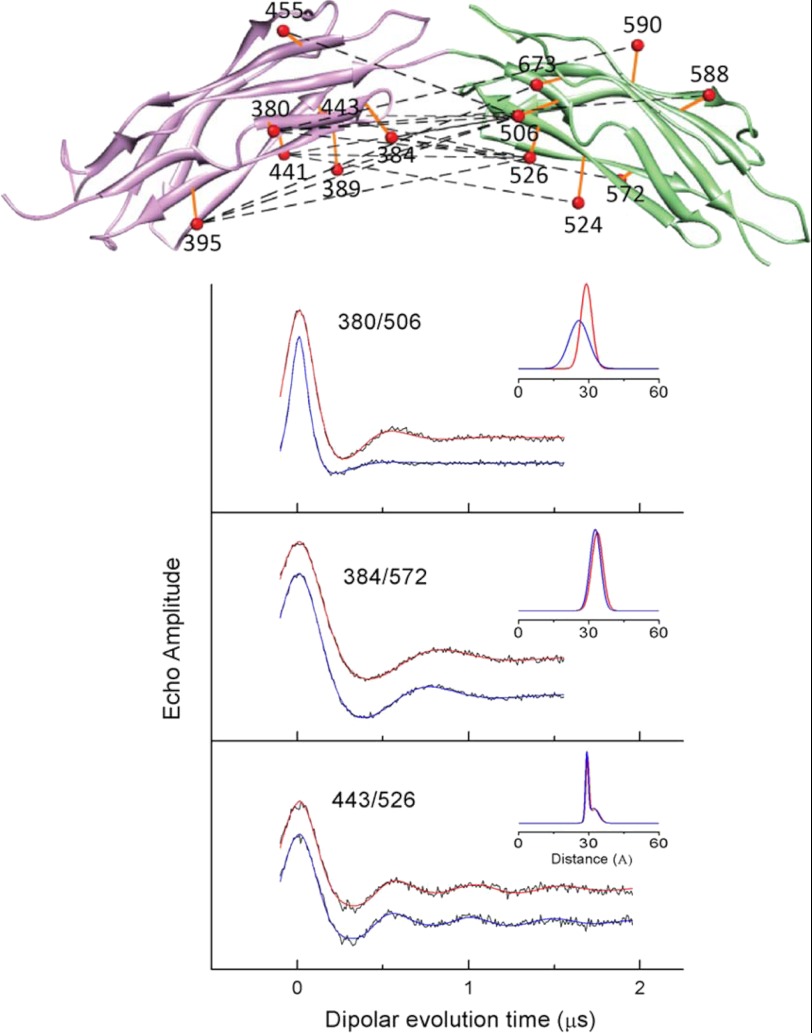
Pairs of sites selected for site-directed spin labeling in CBD12 and DEER spectra for three pairs of sites. The ribbon diagram of for the CBD1 domain is shown in purple (coordinates were from PDB 2DPK), and the ribbon diagram for the CBD2 domain is shown in green (coordinates were from PDB 2QVM) in the upper panel. The sites where pairs of R1 spin-labeled side chains were incorporated are shown as solid orange spheres connected by dashed lines. The spheres for each selected residue are centered at the coordinates of the average position of the midpoint of the N-O bond of the nitroxide, which was calculated as described under “Experimental Procedures.” The DEER data for three selected pairs of sites are shown as solid black lines in the lower panel. The fits to the DEER data are shown as solid blue lines (no bound Ca2+) and solid red lines (saturating level of bound Ca2+). The average distances and widths of the distance distributions are shown in the insets to each DEER data set in Å. The parameters from fitting the DEER data for all these three sites and those from the remaining sites shown in Fig. 10 in the presence of a saturating concentration of Ca2+ and with no bound Ca2+ are listed in Table 1.
FIGURE 11.
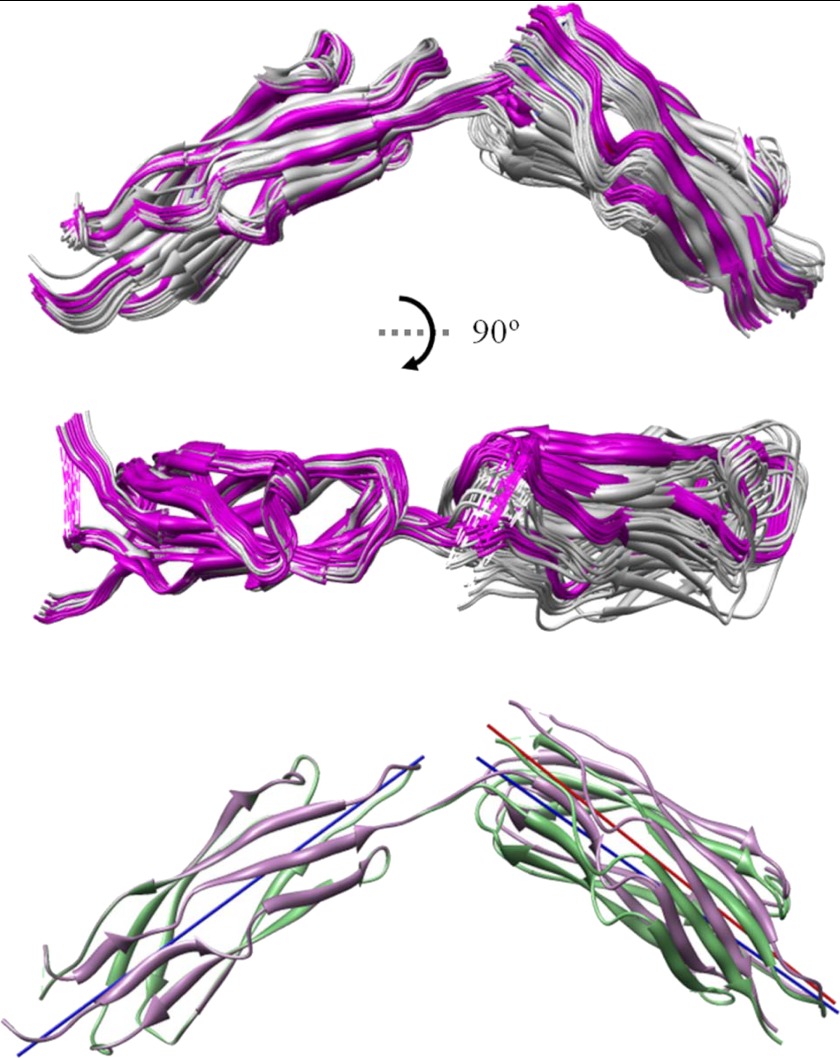
Structural models for CBD12. The top 20 structures determined from the 17 inter-probe distances measured by DEER are shown superimposed in the upper and middle panels. The middle set of structures is rotated by 90° relative to the upper panel and show that the two CBDs lie in very nearly the same plane. The overlaid structures in white are from the Ca2+-free form (average backbone root mean square deviation of 1.28 Å), and those in magenta are from the Ca2+-bound form (average backbone root mean square deviation of 0.92 Å). In the lower panel, the average structure calculated from each set of 20 is shown. The solid blue line that bisects CBD1 in the lower panel and the solid blue and red lines that bisect CBD2 show that the angle between the two domains does not change dramatically upon Ca2+ binding. The calculated angle between the two domains is 105° (Ca2+-bound) and 109° (Ca2+-free).
Effects of Ca2+ Binding on the Dynamics of Selected Spin-labeled Sites in the CBD2 Domain in CBD12
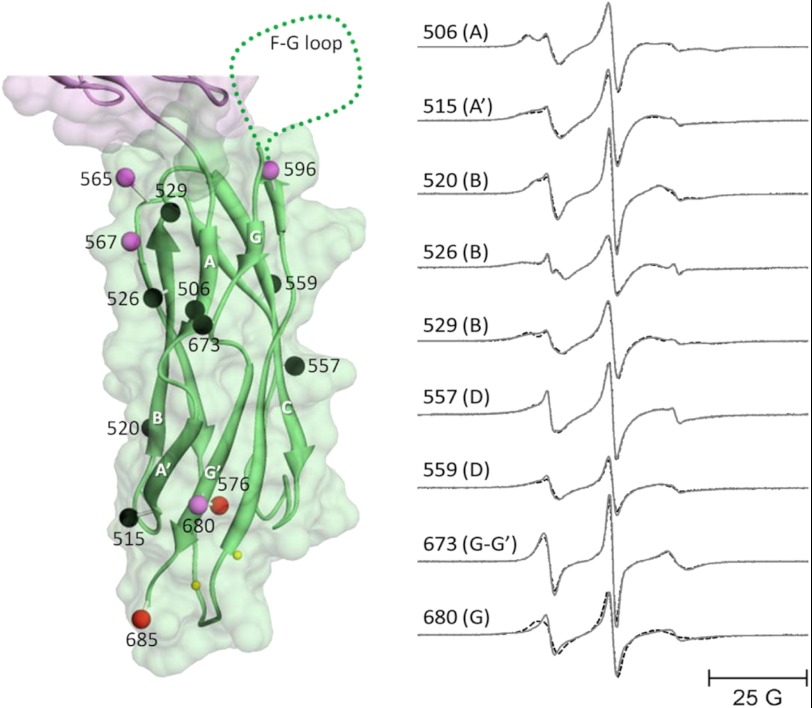
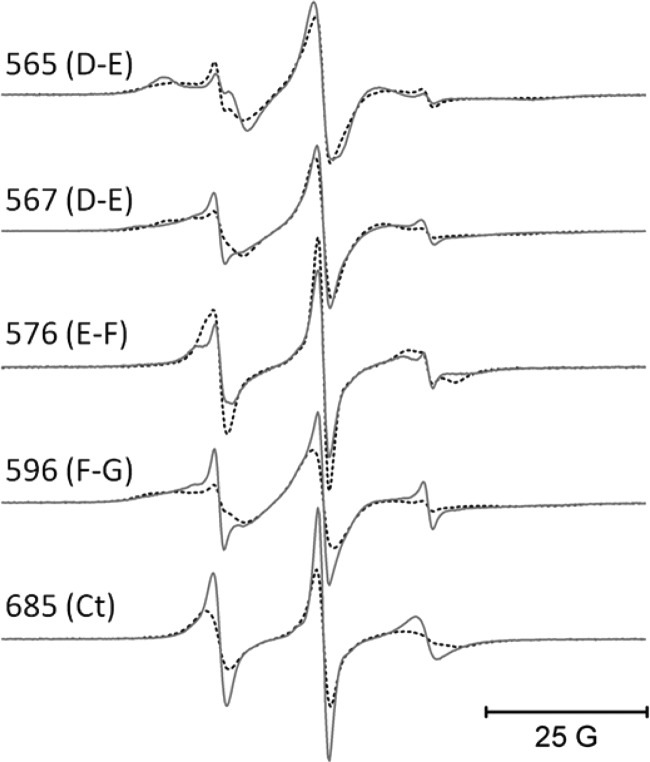
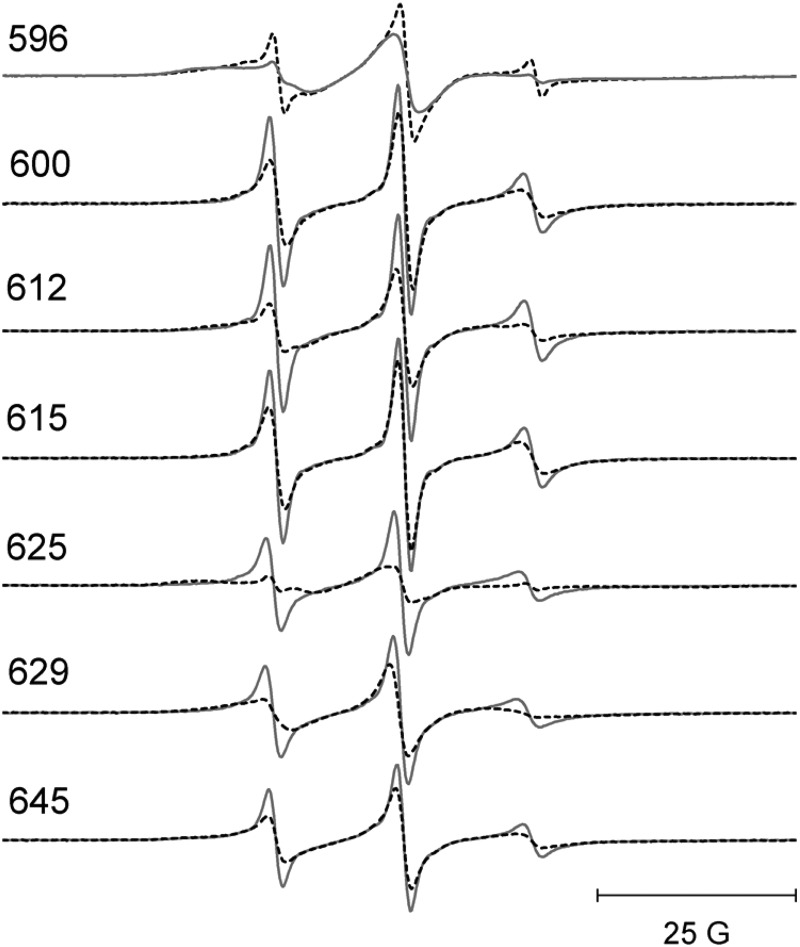
Fig. 6, left panel, shows the sites on CBD2 that were chosen for spin labeling in full-length CBD12. The spheres at each chosen site are color-coded to indicate whether R1 side-chain motion was unaffected (black) or decreased (shades of red) after the addition of a saturating level of Ca2+. Unlike CBD1, no sites examined in the β-sandwich region of CBD2 showed increased motion in the absence of bound Ca2+. All but one of the chosen sites in the highly structured β-sandwich region showed no sensitivity to Ca2+ binding including sites 506 in the A strand, 515 in the A′ strand, 520, 526, and 529 in the B strand, 557 and 559 in the D strand, and 673 in the break between the G and G′ strands. The single exception occurred at site 680, which lies at the end of the G′ strand near the Ca2+-binding sites (small yellow spheres). This site showed decreased motion upon saturation of the Ca2+-binding sites. Sites in loop regions including 565 and 567 in the D-E loop and 576 in the E-F loop as well as site 685 at the C terminus all showed decreased motion upon Ca2+ binding as indicated by the colored spheres in Fig. 6, left panel, and as demonstrated by the EPR spectra in Fig. 7.
FIGURE 6.
Sites selected for site-directed spin labeling in the CBD2 domain of CBD12 and their corresponding EPR spectra. The ribbon diagram of CBD2 is shown in green superimposed on the space filling model in the left panel (coordinates were from PDB 2QVM). The sites where single R1 spin-labeled side chains were incorporated are shown as solid spheres that are centered at the coordinates of the β-carbon of each residue. The spheres are color-coded to indicate changes in spin-labeled side chain mobility upon Ca2+ binding as follows: black, no change; bright red, substantial decrease; pale red, subtle decrease. The positions of the two Ca2+-binding sites are shown as small yellow spheres. The position of the F-G loop is shown schematically in dots. The purple ribbon diagram and space-filling model at the top are the apical portion of the CBD1 domain. The EPR spectra in the right panel are from sites in the central β-sandwich region and are shown as solid lines (no bound Ca2+) and dashed lines (saturating level of bound Ca2+). All spectra have been normalized to the same integrated signal intensity.
FIGURE 7.
EPR spectra from the Ca2+ binding loops, the F-G loop, and the C terminus of the CBD2 domain of CBD12. All EPR spectra were collected as described under “Experimental Procedures.” The solid lines are data collected with no bound Ca2+, and the superimposed dashed lines are data collected in the presence of a saturating level of Ca+2.
Effects of Ca2+ Binding on the Global Structure of the CBD2 Domain in CBD12
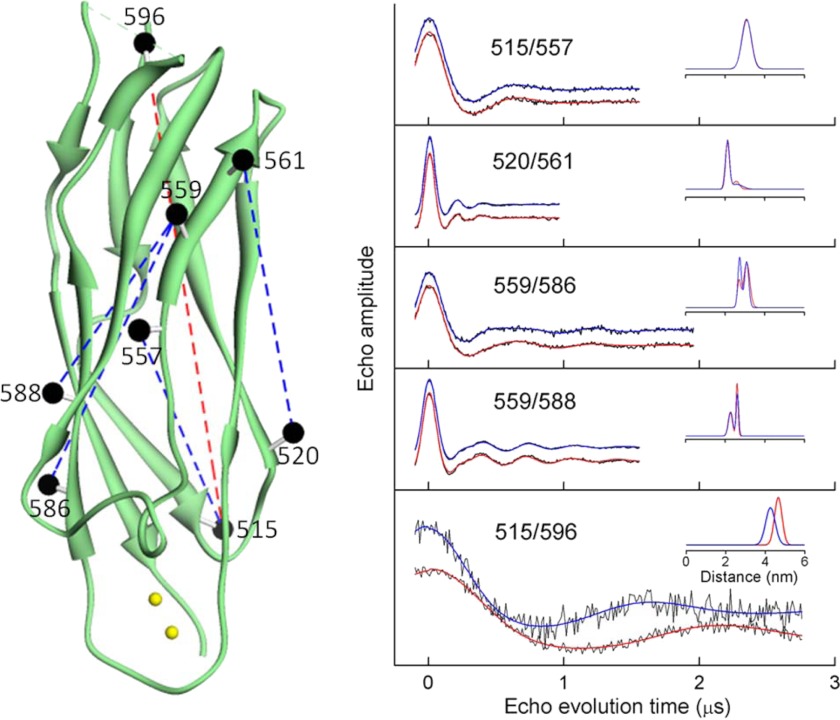
To determine whether Ca2+ binding to CBD12 produced any global structural changes in the CBD2 domain, five separate pairs of spin-labeled R1 side chains were incorporated as shown by the black spheres in Fig. 8, left panel. DEER was employed to measure the average inter-probe distance and distribution of distances between each of these five pairs as described under “Experimental Procedures” and in detail in previous work (e.g. Ref. 25–27). As shown by the DEER data in Fig. 8, right panel, the four inter-probe distances involving residues in the structured β-sandwich region of CBD2 showed no sensitivity to Ca2+ binding, indicating that the β-sandwich region, like CBD1, does not undergo any major global structural change. However, both the average inter-probe distance and distribution of distances were highly sensitive to Ca2+ binding between probes at site 515 in the β-sandwich region and site 596 in the proximal portion of the F-G loop, indicating a repositioning of at least a segment of this loop in response to saturation of the Ca2+-binding sites. As shown in Fig. 7, site 596 also showed an apparent increase in motion upon Ca2+ binding, indicating that the dynamics of at least a portion of the F-G loop in CBD2, which contains the alternative splicing region, is highly sensitive to occupancy of the Ca2+-binding sites. As shown in Fig. 14, below, the dynamics of all residues in the F-G loop showed sensitivity to Ca2+ binding.
FIGURE 8.
Pairs of sites selected for site directed spin labeling in the CBD2 domain of CBD12 and their corresponding DEER spectra. The ribbon diagram of CBD2 is shown in green in the left panel (coordinates were from PDB 2QVM). The sites where pairs of R1 spin-labeled side chains were incorporated are shown as solid spheres connected by dashed lines. The spheres are centered at the coordinates of the β-carbon of each selected residue. The positions of the two Ca2+-binding sites are shown as small yellow spheres. The position of the F-G loop is shown schematically in a dashed green line. The DEER data for each of the five pairs of sites are shown as solid black lines in the right panel. The fits to the DEER data are shown as solid blue lines (no bound Ca2+) and solid red lines (saturating level of bound Ca2+). The average distances and widths of the distance distributions are shown in the insets to each DEER data set in Å.
FIGURE 14.
EPR spectra from the F-G loop in CBD2 in full-length CBD12. The data for each site chosen are shown as solid lines (no bound Ca2+) and dashed lines (saturating level of bound Ca2+). All spectra have been normalized to the same integrated signal intensity.
Structural Models of CBD12 Derived from Interdomain Distance Measurements
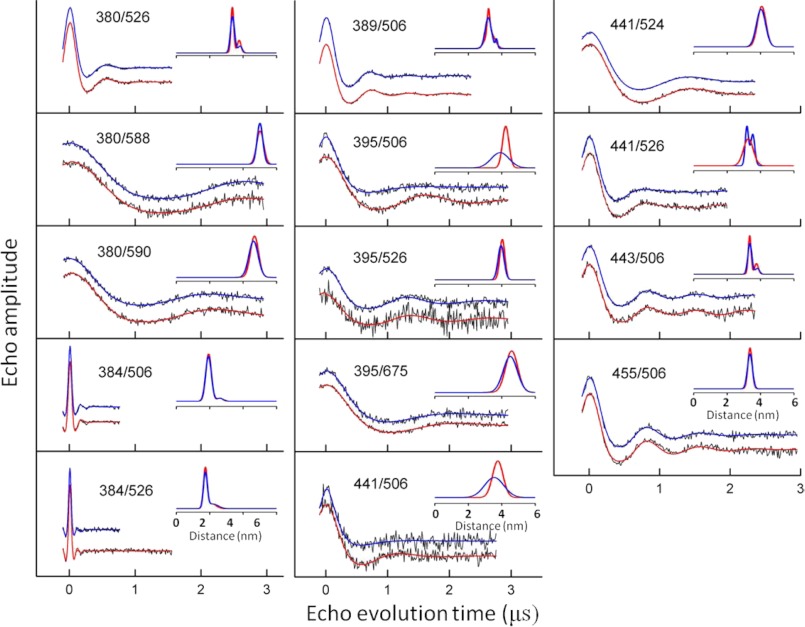
Previous studies have suggested that binding of Ca2+ to the two Ca2+-binding domains might result in a significant structural rearrangement of the two domains relative to each other (e.g. Ref. 12). To directly test this model for possible allosteric regulation of NCX1.1, 17 pairs of sites were introduced into full-length CBD12 as shown in Fig. 9, upper panel. For each of the pairs of sites, one site was in the CBD1 domain, and the other was in the CBD2 domain. As demonstrated by the experimental DEER data in Fig. 9, lower panel, and in Fig. 10, the average inter-probe distances and the corresponding distribution of distances did not change as a result of Ca2+ binding for most pairs of sites examined. These data are tabulated in Table 1. The exceptions to this were the changes observed for the 380/506 pair as shown in Fig. 9 and for the 395/506 and 441/506 pair as shown in Fig. 10.
FIGURE 10.
DEER data from the other 14 interdomain DEER measurements on CBD12. The experimental data, collected as described under “Experimental Procedures,” for each pair of sites are shown as dots. The fits to the experimental data are shown as solid lines in red (saturating level of bound Ca2+) and blue (no bound Ca2+). The inset in each panel is the average distance and distribution of distances, in Å, obtained from analyses of the data. The mean distances and the distribution of distances calculated from the data analysis are reported in Table 1 of the manuscript.
TABLE 1.
Parameters from analysis of DEER data
| CBD1/CBD2 | Saturating Ca2+ |
No bound Ca2+ |
||||
|---|---|---|---|---|---|---|
| ra | sb | fc | r | s | f | |
| Å | Å | Å | Å | |||
| 380/506 | 29.0 | 2.4 | 25.8 | 4.2 | ||
| 380/526 | 29.1 | 2.4 | 28.8 | 2.6 | ||
| 380/588 | 50.2 | 2.1 | 50.0 | 1.7 | ||
| 380/590 | 46.8 | 2.4 | 46.2 | 2.8 | ||
| 384/506 | 19.3 | 1.7 | 0.91 | 19.2 | 1.7 | 0.92 |
| 26.5 | 2.3 | 0.09 | 26.0 | 2.1 | 0.08 | |
| 384/526 | 17.4 | 1.1 | 0.79 | 17.4 | 1.2 | 0.72 |
| 21.4 | 2.5 | 0.21 | 21.9 | 3.3 | 0.28 | |
| 384/572 | 33.6 | 2.4 | 32.8 | 2.3 | ||
| 389/506 | 32.2 | 1.6 | 0.88 | 31.9 | 1.9 | 0.91 |
| 36.6 | 0.2 | 0.12 | 36.8 | 0.7 | 0.09 | |
| 395/506 | 42.3 | 2.0 | 41.0 | 2.1 | 0.39 | |
| 35.4 | 8.4 | 0.61 | ||||
| 395/526 | 40.7 | 2.4 | 39.6 | 1.8 | ||
| 395/673 | 45.9 | 3.6 | 45.0 | 4.2 | ||
| 441/506 | 37.6 | 3.2 | 35.4 | 5.8 | ||
| 441/524 | 40.7 | 2.6 | 40.3 | 2.8 | ||
| 441/526 | 31.9 | 1.0 | 0.52 | 32.7 | 2.9 | |
| 35.4 | 1.2 | 0.48 | ||||
| 443/506 | 33.5 | 0.9 | 0.62 | 33.6 | 1.2 | 0.83 |
| 37.6 | 1.1 | 0.38 | 38.1 | 1.3 | 0.17 | |
| 443/526 | 29.5 | 0.7 | 0.62 | 29.2 | 0.6 | 0.67 |
| 32.7 | 2.0 | 0.38 | 32.1 | 2.0 | 0.43 | |
| 455/506 | 33.7 | 1.3 | 33.7 | 1.5 | ||
a Mean distance from gaussian distance distribution.
b Width of Gaussian distance distribution.
c Relative fraction of each component.
As described under “Experimental Procedures” and in Fig. 2, these 17 inter-probe distances were used to construct models for CBD12 in the Ca2+-bound and Ca2+-free forms as shown in Fig. 11. In the upper two panels, the top 20 models calculated from the data are superimposed. In the lower panel, the average structure for each set of 20 is shown. Even when the data from the three pairs of sites that showed some changes (380/506, 395/506, and 441/506) are included in construction of structural models, there is only a modest change in the predicted structure with approximately a 4° change in the angle between the two axes that bisect CBD1 and CBD2 as shown by the solid colored lines in Fig. 11, lower. It is possible that site 506 is undergoing a repacking of the R1 side chain upon Ca2+ binding, and this leads to the small structural rearrangement that is suggested in Fig. 11. Repacking of the spin label is a likely explanation given that the remaining 14 distances and distance distributions did not change in any systematic way as shown in Table 1. Therefore, it is considered unlikely that there is any difference in the structures of the Ca2+-free and Ca2+-bound forms of CBD12.
Rotational Dynamics of the Two Ca2+ Binding Domains in CBD12
Brüschweiler and co-workers (17) reported compelling NMR relaxation data obtained from NCX1.4 (the AD splice variant with a shorter F-G loop in CBD2) that the three-amino acid linker between CBD1 and CBD2 became more rigid upon Ca2+ binding to CBD1 leading to a stronger motional coupling between the two domains. No evidence was seen for this in NCX.1.1 in the current studies. Specifically, the EPR data from site 461 located in the center of the F strand in CBD1 (see Fig. 3) is indicative of significant immobilization of the R1 side chain, and this does not change upon removal of Ca2+. This level of immobilization strongly suggests that the observed EPR line shape at this site senses the global tumbling of the domain to which it is attached. Likewise, the EPR data from site 506 located in the A strand in CBD2 (see Fig. 6) is indicative of significant immobilization of the R1 side chain, and this does not change upon removal of Ca2+. At both of these sites the dynamics of the R1 side chain is being determined by the local environment of the probe, possibly by any backbone fluctuations of the β-strands to which they are attached, and in large part by the global tumbling of the domains.
Dipolar Coupling between Residues Near the Linker between CBD1 and CBD2
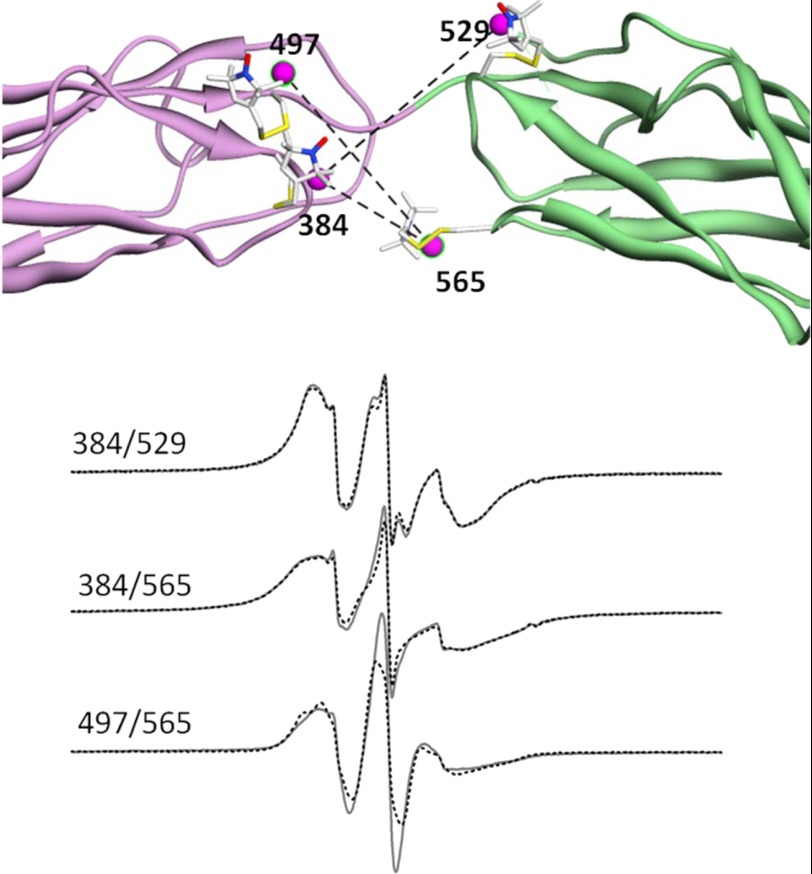
cw-EPR spectra are highly sensitive to dipolar coupling between two spin labels that are separated by less than 20 Å (e.g. Refs. 24 and 30). Specifically, the line shapes are sensitive to the average inter-probe distance, the relative orientations of the two probes, and the width of the distance distribution between them (23). As an alternative means of detecting whether the two Ca2+-binding domains become more mobile relative to each other in NCX1.1 when Ca2+ is removed, pairs of spin labels were introduced into CBD12 as shown in Fig. 12, upper panel. The three pairs were chosen based upon the models shown in Fig. 11 such that each pair was predicted to be <20 Å from each other, one label was on CBD1, and while the second was on CBD2, and they were near the linker region so mobility of one domain relative to the other should modulate the average inter-probe distance and the distribution of distances. As shown in Fig. 12, lower panel, none of the three pairs of sites showed any significant changes in dipolar coupling between the Ca2+-saturated and Ca2+-free states. These observations, which were made on samples at room temperature, are consistent with the lack of observation of any systematic changes in the widths of the distance distributions from DEER experiments performed at cryogenic temperatures as summarized in Table 1.
FIGURE 12.
Sites near the linker between CBD1 and CBD2 chosen for measurement of dipolar coupling. Three different pairs of sites, one on CBD1 and one on CBD2, were chosen for spin labeling that were predicted to be <20 Å from each based upon the structures presented in Fig. 9: 384/529 (upper set of EPR spectra), 384/565 (middle set of EPR spectra), and 497/565 (lower set of EPR spectra). In each set, the solid black spectra are in the presence of saturating levels of Ca2+, and the overlaid solid red spectra are in the absence of Ca2+. The magenta spheres show the midpoint of the N-O bond of the R1 side chain at each site. As shown by the EPR spectra, each chosen pair showed strong dipolar coupling that was not dependent on whether or not Ca2+ was bound.
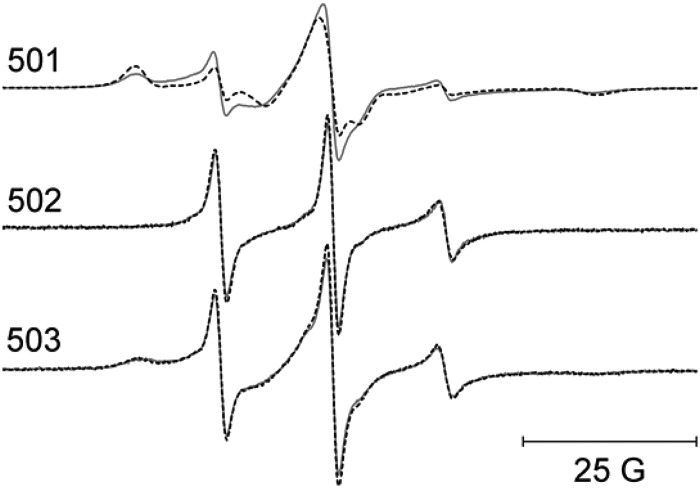
The dynamics of residues 501, 502, and 503 that form the link between CBD1 and CBD2 were also examined by incorporating an R1 side chain at each position and making EPR measurements. As shown in Fig. 13, there were no significant changes in EPR line shapes at any of these positions when Ca2+ was bound at saturating levels.
FIGURE 13.
EPR spectra from the three residues that form the short linker joining CBD1 and CBD2. The solid lines are data collected with no bound Ca2+, and the superimposed dashed lines are data collected in the presence of saturating level of Ca+2. All spectra have been normalized to the same integrated signal intensity.
Changes in Dynamics of the F-G Loop in CBD2 as a Result of Ca2+ Binding
The F-G loop of CBD2 is positioned near the Ca2+-binding sites on CBD1 and also near the short linker region between CBD1 and CBD2. It is also the loop where the splice variations in the NCX1 family of exchangers occur. The EPR data in Fig. 14 show that there are significant changes in the dynamics of residues throughout the F-G loop upon Ca2+ binding. It is yet uncertain how or if this change in dynamics is related to allosteric regulation of the exchanger. However, this is a region of CBD12 that shows consistent and relatively large changes in dynamics in response to Ca2+ binding. Additional DEER measurements between residues in the F-G loop and residues in the β-sandwich domains in CBD1 or CBD2 have also indicated that there are changes in the average positions of spin-labeled side chains in the F-G loop of CBD2 upon Ca2+ binding (data not shown).
DISCUSSION
The Ca2+-dependent regulation of NCX1 exchange activity is due to the presence of the long intracellular loop that contains a tandem array of two structurally homologous calcium binding domains. To date, most functional and structural studies have focused on the two CBDs to gain insight into potential mechanisms of how binding of Ca2+ to the intracellular loop allosterically regulates exchange function. These studies have led to different models for regulation. Given that high resolution structures of each separate domain have shown that the structural effect of Ca2+ binding on CBD1 and CBD2 is largely limited to the Ca2+ binding loops (7, 11, 13, 14), Hilge et al. (12) have proposed a model that assumed substantial alterations in the relative orientation between the two CBDs upon Ca2+ binding and subsequent transmission of a regulatory Ca2+ binding signal to the transmembrane domain through the α-catenin like domain. This model is supported by SAXS (12) and FRET measurements (16), both of which implied significant Ca2+-dependent conformational changes in CBD12. However, a more recent NMR study observed significant changes in flexibility of the short linker joining two CBDs and raised the possibility that a change in the dynamics of CBD12 in the NCX1.4 isoform is a potential mechanism for Ca2+ regulation (17). Apart from these models directly derived from observations of the structural changes within CBD12, a set of functional studies implied autoregulation of exchange function mediated by plausible interdomain interactions involving the XIP region of the full-length exchanger. Functional studies using a series of deletion mutants have proposed that the Na+-dependent inactivation can be regulated by interaction of XIP with a region on CBD2 (31–33) but not on CBD1. The strong correlation of the number of Ca2+ ions occupied and their binding affinities with the ability to overcome Na+-dependent inactivation observed in various splice variants of CBD2 supports this hypothesis (12).
The initial hypothetical model proposed by Hilge et al. (7) predicted a lengthwise antiparallel arrangement of the two CBDs for the Ca2+-bound state based upon resonance shifts in heteronuclear single quantum correlation spectra between CBD12 and the individual domains. However, the spatial arrangements of the two CBDs constructed by recent SAXS measurements were not antiparallel but, rather, were widely separated at the N and C termini for Ca2+-bound and apo states in both NCX1.4 and NCX1.1 (12). Furthermore, Brüschweiler and co-workers (17) generated a structural model of CBD12 for the AD splice variant using the backbone residual dipolar couplings from partially aligned samples, where the two CBDs adopt a fully extended arrangement in CBD12. In line with these structural models, the solution set of structural models for the ACDEF isoform constructed in this study using multiple long range distance constraints obtained from DEER measurements also indicated an elongated arrangement of the two CBDs with approximately a 105° interdomain axis angle. The difference in the interdomain angle between the two splice variants might be explained by the presence of the additional splice variant region in the ACDEF form that resides in the F-G loop of CBD2 and in close proximity to the short linker and the Ca2+ binding region of CBD1 (Fig. 6).
Most (14 of 17) of the interdomain DEER distances (Table 1, Figs. 9 and 10) showed no substantial change between the Ca2+-bound and apo state, demonstrating that there is no large scale rearrangement of the two Ca2+ binding domains relative to each other in NCX1.1 upon Ca2+ binding. This result is also supported by a set of dipolar coupled EPR spectra (Fig. 12) showing that three pairs of spin labels near the linker undergo no significant changes in the relative orientations of R1 side chains and interspin distances upon Ca2+ binding. Furthermore, the EPR spectra from two reference positions in NCX1.1, 461 and 506, did not exhibit any sign of changes in the backbone dynamics between the apo and Ca2+-bound states (Figs. 3 and 6). Consistently, most of the interdomain DEER measurements showed no significant changes in their distance distributions between apo and Ca2+-bound states (Table 1 and Figs. 9 and 10). Together, these data indicate that the transition in the flexibility of the short linker bridging two CBDs and the consequent changes in backbone dynamics may not be a common mechanism for Ca2+ regulation of NCX1 for the two splice variants of NCX1.1 and NCX1.4.
The findings from this study lead to apparent discrepancies with a few previous observations and need to be carefully considered. First, the prior SAXS and FRET studies have shown that Ca2+ binding induces significant conformational changes in the intracellular loop segments encompassing CBD12. However, it may not be straightforward to couple these observations to the Ca2+-dependent alteration in the relative orientation between the two CBDs as previously proposed by Hilge et al. (12). SAXS measurements on the ACDEF splice variant CBD12 revealed a 15 Å decrease in the maximum distance of scattering vectors (Dmax) upon Ca2+ binding. Given that the both F-G loops from CBD1 and CBD2 undergo significant conformational changes between Ca2+-bound and apo states as demonstrated by two intradomain DEER distances, 411–472 from CBD1 and 515–596 from CBD2 (Figs. 5 and 8), as well as spin label dynamics changes observed in residues 479 and 596 (Figs. 4 and 7), the observed change in Dmax could potentially be explained by the contributions from F-G loops rather than rigid body movement of the two CBDs. Unlike the results from the SAXS study, Ottolia and co-workers reported an increase in the inter-probe distance from FRET measurements using a CBD12 construct in which N and C termini were fused to CFP and YFP, respectively (16). It is possible that this increase might be the consequence of local conformational changes at the N- and C-terminal regions of CBD12, which are substantiated by the Ca2+-dependent changes in R1 side chain mobility at positions 370 and 685 (Figs. 4 and 7) and the fact that the N terminus is in spatial proximity to the dynamic F-G loop of CBD1. Second, the recent NMR relaxation study using the AD splice variant reported significant and global changes in backbone dynamics in CBD12 in a Ca2+-dependent manner, which were not observed in NCX1.1 (17). These different Ca2+ sensitivities in rotational dynamics from the two different splice variants could be due to the different F-G loops in CBD2. The additional 35 residues from the splice variant zone in NCX1.1 could play a role in loss of coupling of Ca2+ binding to the flexibility of the short linker that was observed in NCX1.4. Additional studies on both splice variants will be required to resolve this issue.
In the context of its structural similarity with the CBDs, C2-domains provide some insights into the mechanism of Ca2+-dependent regulation of NCX1 function. C2 domains are one of the main Ca2+ binding motifs and function in signal transduction or membrane trafficking in many proteins in a Ca2+-dependent manner. Importantly, none of the three-dimensional structures of C2 domains determined so far have shown a substantial Ca2+-induced conformational change (34). Instead, as exemplified in the binding of synaptotagmin I C2A with syntaxin, Ca2+ binding to the C2 domain was shown to result in changes in electrostatic potential of the Ca2+ binding region and is speculated to generate a binding surface for its binding partners (35). Likewise, Ca2+ binding to either CBD1 or CBD2 also results in substantial changes in the surface electrostatic potential of the Ca2+ binding regions in both CBDs of NCX1.4 (12). Thus it is possible that electrostatic interactions occurring in the Ca2+ binding regions from individual CBDs serve important roles in the ionic modulation of NCX1 function.
The ionic regulation of NCX1 function can be briefly described by two separate but integrated actions of two regulatory mechanisms, Ca2+ regulation and Na+-dependent inactivation (5, 6). Many lines of evidence from functional studies indicate that CBD1 and CBD2 play a dominant role in each process. Given that CBD12 from NCX1.1 does not undergo rigid body reorientation upon Ca2+ binding and interdomain interactions induced by surface electrostatic potential changes on each Ca2+-binding region is predicted to be the main event in ionic regulation, the spatial positioning of individual domains and the interactions with one another will be of primary significance in understanding the regulatory mechanism. Additional important observations from this study are the conformational changes in the F-G loops of both CBDs and in N- and C-terminal regions. According to the NMR and crystal structures from the AD splice variant, the F-G loop in CDB2 is largely unstructured regardless of Ca2+ binding. However, the F-G loop in ACDEF CDB2 provided EPR spectra displaying highly immobilized motion in the presence of Ca2+ (Fig. 14) and significant changes in DEER distances (e.g. Fig. 8), suggesting putative interactions of that region with other segments of the protein that could potentially result in the modulation of exchange function. Likewise, the F-G loop of CBD1 and terminal regions revealed Ca2+-dependent changes in their EPR spectra and DEER distances. Considering their proximity to the α-catenin like domain, these data imply that the α-catenin-like domain may be required not only for proper positioning of CBD12 but may be actively involved in relaying the Ca2+ binding effect on the CBDs to the exchange sites in the transmembrane domain. Additional studies on larger constructs containing CBD12, the α-catenin like domain, the XIP domain, and linker regions will be required to address this potential regulatory mechanism.
Acknowledgments
We greatly appreciate receiving the cDNA encoding NCX1.1 from Dr. J. Lytton, University of Calgary. Funding for the DEER instrument was provided by National Institutes of Health Grant RR019120.
This work was supported, in whole or in part, by National Institutes of Health Grant T32 GM008320 (to G. F. M.).
- XIP
- exchange inhibitory peptide
- CBD1
- Ca2+ binding domain 1
- DEER
- double electron-electron resonance
- MTSSL
- 1-oxyl-2,2,5,5-tetramethyl-Δ3-pyrroline-3-methyl methanethiosulfonate spin label
- cw-EPR
- continuous-wave EPR
- AD
- the AD splice variant of NCX1.
REFERENCES
- 1. Kang T. M., Hilgemann D. W. (2004) Multiple transport modes of the cardiac Na+/Ca2+ exchanger. Nature 427, 544–548 [DOI] [PubMed] [Google Scholar]
- 2. Piacentino V., 3rd, Weber C. R., Chen X., Weisser-Thomas J., Margulies K. B., Bers D. M., Houser S. R. (2003) Cellular basis of abnormal calcium transients of failing human ventricular myocytes. Circ. Res. 92, 651–658 [DOI] [PubMed] [Google Scholar]
- 3. Pogwizd S. M., Qi M., Yuan W., Samarel A. M., Bers D. M. (1999) Up-regulation of Na+/Ca2+ exchanger expression and function in an arrhythmogenic rabbit model of heart failure. Circ. Res. 85, 1009–1019 [DOI] [PubMed] [Google Scholar]
- 4. Weisser-Thomas J., Piacentino V., 3rd, Gaughan J. P., Margulies K., Houser S. R. (2003) Calcium entry via Na+/Ca2+ exchange during the action potential directly contributes to contraction of failing human ventricular myocytes. Cardiovasc. Res. 57, 974–985 [DOI] [PubMed] [Google Scholar]
- 5. Hilgemann D. W., Matsuoka S., Nagel G. A., Collins A. (1992) Steady-state and dynamic properties of cardiac sodium-calcium exchange. Sodium depenent inactivation. J. Gen. Physiol. 100, 905–932 [DOI] [PMC free article] [PubMed] [Google Scholar]
- 6. Hilgemann D. W., Collins A., Matsuoka S. (1992) Steady-state and dynamic properties of cardiac sodium-calcium exchange. Secondary modulation by cytoplasmic calcium and ATP. J. Gen. Physiol. 100, 933–961 [DOI] [PMC free article] [PubMed] [Google Scholar]
- 7. Hilge M., Aelen J., Vuister G. W. (2006) Ca2+ regulation in the Na+/Ca2+ exchanger involves two markedly different Ca2+ sensors. Mol. Cell 22, 15–25 [DOI] [PubMed] [Google Scholar]
- 8. Nicoll D. A., Ottolia M., Lu L., Lu Y., Philipson K. D. (1999) A new topological model of the cardiac sarcolemmal Na+-Ca2+ excyahger. J. Biol. Chem. 274, 910–917 [DOI] [PubMed] [Google Scholar]
- 9. Ren X., Nicoll D. A., Philipson K. D. (2006) Helix packing of the cardiac Na+-Ca2+ exchanger. Proximity of transmembrane segments 1, 2, and 6. J. Biol. Chem. 281, 22808–22814 [DOI] [PubMed] [Google Scholar]
- 10. Nicoll D. A., Sawaya M. R., Kwon S., Cascio D., Philipson K. D., Abramson J. (2006) The crystal strcuture of the primary Ca2+ sensor of the Na+/Ca2+ exchanger reveals a novel Ca2+ binding motif. J. Biol. Chem. 281, 21577–21581 [DOI] [PubMed] [Google Scholar]
- 11. Besserer G. M., Ottolia M., Nicoll D. A., Chaptal V., Cascio D., Philipson K. D., Abramson J. (2007) The second Ca2+ binding domain of the Na+-Ca2+ exchanger is essential for regulation. Crystal structures and mutational analysis. Proc. Natl. Acad. Sci. U.S.A. 104, 18467–18472 [DOI] [PMC free article] [PubMed] [Google Scholar]
- 12. Hilge M., Aelen J., Foarce A., Perrakis A., Vuister G. W. (2009) Ca2+ regulation in the Na+/Ca2+ exchanger features a dual electrostatic switch mechanism. Proc. Natl. Acad. Sci. U.S.A. 106, 14333–14338 [DOI] [PMC free article] [PubMed] [Google Scholar]
- 13. Johnson E., Bruschweiler-Li L., Showalter S. A., Vuister G. W., Zhang F., Brüschweiler R. (2008) Structure and dyanmics of Ca2+ binding domain 1 of the Na+/Ca2+ exchanger in the presence and absence of Ca2+. J. Mol. Biol. 377, 945–955 [DOI] [PMC free article] [PubMed] [Google Scholar]
- 14. Breukels V., Vuister G. W. (2010) Binding of calcium is sensed structurally and dynamically throughout the second calcium binding domain of the sodium/calcium exchanger. Proteins 78, 1813–1824 [DOI] [PubMed] [Google Scholar]
- 15. Aurora R., Rose G. D. (1998) Helix capping. Protein Sci. 7, 21–38 [DOI] [PMC free article] [PubMed] [Google Scholar]
- 16. John S. A., Ribalet B., Weiss J. N., Philipson K. D., Ottolia M. (2011) Ca2+-dependent structural rearrangements within Na+-Ca2+ exchanger dimers. Proc. Natl. Acad. Sci. U.S.A. 108, 1699–1704 [DOI] [PMC free article] [PubMed] [Google Scholar]
- 17. Salinas R. K., Bruschweiler-Li L., Johnson E., Brüschweiler R. (2011) Ca2+ binding alters the interdomain flexibility between the two cytoplasmic calcium binding domains in the Na+/Ca2+ exchanger. J. Biol. Chem. 286, 32123–32131 [DOI] [PMC free article] [PubMed] [Google Scholar]
- 18. Wu M., Tong S., Gonzalez J., Jayaraman V., Spudich J. L., Zheng L. (2011) Structural basis of the Ca2+ inhibition mechanism of Drosophila Na+/Ca2+ exchanger CALX and its modification by alternative splicing. Structure 19, 1509–1517 [DOI] [PMC free article] [PubMed] [Google Scholar]
- 19. Dyck C., Omelchenko A., Elias C. L., Quednau B. D., Philipson K. D., Hnatowich M., Hryshko L. V. (1999) Ionic regulatory properties of brain and kidney splice variants of the NCX1 Na+-Ca2+ exchanger. J. Gen. Physiol. 114, 701–711 [DOI] [PMC free article] [PubMed] [Google Scholar]
- 20. Laemmli U. K. (1970) Cleavage of structural proteins during the assembly of the head of bacteriophage T4. Nature 227, 680–685 [DOI] [PubMed] [Google Scholar]
- 21. Dong H., Dunn J., Lytton J. (2002) Stoichiometry of the cardiac Na+/Ca2+ exchanger NCX1.1 measured in transfected HEK cells. Biophys. J. 82, 1943–1952 [DOI] [PMC free article] [PubMed] [Google Scholar]
- 22. Dong H., Light P. E., French R. J., Lytton J. (2001) Electrophysiological characterization and ionic stoichiometry of the rat brain K+-dependent Na+/Ca2+ exchanger, NCKX2. J. Biol. Chem. 276, 25919–25928 [DOI] [PubMed] [Google Scholar]
- 23. Hustedt E. J., Stein R. A., Sethaphong L., Brandon S., Zhou Z., Desensi S. C. (2006) Dipolar coupling between nitroxide spin labels. The development and application of a tether-in-a-cone model. Biophys. J. 90, 340–356 [DOI] [PMC free article] [PubMed] [Google Scholar]
- 24. Rabenstein M. D., Shin Y. K. (1995) Determination of the distance between two spin labels attached to a macromolecule. Proc. Natl. Acad. Sci. U.S.A. 92, 8239–8243 [DOI] [PMC free article] [PubMed] [Google Scholar]
- 25. Kim S., Brandon S., Zhou Z., Cobb C. E., Edwards S. J., Moth C. W., Parry C. S., Smith J. A., Lybrand T. P., Hustedt E. J., Beth A. H. (2011) Determination of structural models of the complex between the cytoplasmic domain of erythrocyte band 3 and ankyrin-R repeats 13–24. J. Biol. Chem. 286, 20746–20757 [DOI] [PMC free article] [PubMed] [Google Scholar]
- 26. Zhou Z., DeSensi S. C., Stein R. A., Brandon S., Song L., Cobb C. E., Hustedt E. J., Beth A. H. (2007) Structure of the cytoplasmic domain of erythrocyte band 3 hereditary spherocytosis variant P327R. Band 3 Tuscaloosa. Biochemistry 46, 10248–10257 [DOI] [PubMed] [Google Scholar]
- 27. Zhou Z., DeSensi S. C., Stein R. A., Brandon S., Dixit M., McArdle E. J., Warren E. M., Kroh H. K., Song L., Cobb C. E., Hustedt E. J., Beth A. H. (2005) Solution structure of the cytoplasmic domain of erythrocyte membrane band 3 determined by site-directed spin labeling. Biochemistry 44, 15115–15128 [DOI] [PubMed] [Google Scholar]
- 28. Brandon S., Beth A. H., Hustedt E. J. (2012) Global analysis of DEER data. J. Magn. Reson. 218, 93–104 [DOI] [PMC free article] [PubMed] [Google Scholar]
- 29. Polyhach Y., Bordignon E., Jeschke G. (2011) Rotamer libraries of spin labelled cysteines for protein studies. Phys. Chem. Chem. Phys. 13, 2356–2366 [DOI] [PubMed] [Google Scholar]
- 30. Hustedt E. J., Smirnov A. I., Laub C. F., Cobb C. E., Beth A. H. (1997) Molecular distances from dipolar coupled spin-labels. The global analysis of multifrequency continuous wave electron paramagnetic resonance data. Biophys. J. 72, 1861–1877 [DOI] [PMC free article] [PubMed] [Google Scholar]
- 31. Matsuoka S., Nicoll D. A., Reilly R. F., Hilgemann D. W., Philipson K. D. (1993) Initial localization of regulatory regions of the cardiac sarcolemmal Na+-Ca2+ exchanger. Proc. Natl. Acad. Sci. U.S.A. 90, 3870–3874 [DOI] [PMC free article] [PubMed] [Google Scholar]
- 32. Matsuoka S., Nicoll D. A., He Z., Philipson K. D. (1997) Regulation of the cardiac Na+-Ca2+ exchanger by the endogenous XIP region. J. Gen. Physiol. 109, 273–286 [DOI] [PMC free article] [PubMed] [Google Scholar]
- 33. Maack C., Ganesan A., Sidor A., O'Rourke B. (2005) Cardiac sodium-calcium exchanger is regulated by allosteric calcium and exchanger inhibitory peptide at distinct sites. Circ. Res. 96, 91–99 [DOI] [PMC free article] [PubMed] [Google Scholar]
- 34. Rizo J., Südhof T. C. (1998) C2-domains, structure and function of a universal Ca2+ binding domain. J. Biol. Chem. 273, 15879–15882 [DOI] [PubMed] [Google Scholar]
- 35. Shao X., Li C., Fernandez I., Zhang X., Sudhof T. C., Rizo J. (1997) Synaptotagmin-syntaxin interaction. The C2 domain as a Ca2+-dependent electrostatic switch. Neuron 18, 133–142 [DOI] [PubMed] [Google Scholar]


