Abstract
We propose and experimentally demonstrate an ultra-thin rigid endoscope (450 μm diameter) based on a passive multimode optical fiber. We use digital phase conjugation to overcome the modal scrambling of the fiber to tightly focus and scan the laser light at its distal end. By exploiting the maximum number of modes available, sub-micron resolution, high quality fluorescence images of neuronal cells were acquired. The imaging system is evaluated in terms of fluorescence collection efficiency, resolution and field of view. The small diameter of the proposed endoscope, along with its high quality images offer an opportunity for minimally invasive medical endoscopic imaging and diagnosis based on cellular phenotype via direct tissue penetration.
OCIS codes: (110.2350) Fiber optics imaging, (170.2150) Endoscopic imaging, (070.5040) Phase conjugation, (090.1995) Digital holography, (170.0110) Imaging systems, (170.7050) Turbid media
1. Introduction
Endoscopy has revolutionized biomedical imaging. The ability to directly visualize structures of living organisms deep inside the body has proven indispensable both for prognosis and diagnosis. In the state of the art of endoscopic imaging one can identify two distinct approaches [1, 2]. The first relies on the miniaturization of optical elements like Gradient Index (GRIN) lenses [3–6], whereas on the other hand there is a different approach that utilizes fiber optics to achieve the goal of imaging deep inside the tissue. In the fiber optics domain, a large number of commercially available endoscopes are built using fiber bundles, where each fiber acts as a single pixel of the captured image [7, 8]. On the other hand there has been research on hybrid assemblies that exploit single-mode and multimode optical fibers, mechanical actuators and lens systems to deliver and scan a focused spot and collect the fluorescent light. This approach delivers highly versatile flexible endoscopes that can perform one and two photon imaging [9–11]. The major disadvantage is that the smallest achieved diameter is still a few millimeters.
In an attempt to shrink the size of fiber-based endoscopes, multimode fibers with their large number of degrees of freedom (directly linked to the number of propagation modes supported) appear as very suitable candidates. However, multimode fibers being the waveguide equivalent of free space scattering media, tend to scramble any information that is transmitted through them both in space and time [12]. The optical field that enters the fiber gets coupled to the different propagation modes, which follow different paths along the propagation, possibly exchanging energy and reach the output, were the field appears as a random pattern. Different techniques have been proposed to undo the scrambling properties of multimode fibers and to focus and scan light through them, like direct-search wavefront shaping techniques [13] or other complex optimization algorithms [14] and Digital Phase Conjugation [15]. Recently, different groups have presented fluorescent and linear scattering imaging based on multimode fibers [16–18].
In the present paper, we demonstrate a sub-micron resolution, lensless scanning fluorescent imaging scheme by using a multimode fiber and digital phase conjugation to undo the scattering properties of the waveguide. In our approach, we exploit all the available modes in a very high numerical aperture (NA) multimode fiber, in order to generate and scan, optimal resolution and contrast, focused spots and eventually to capture high-detail images of stained biological samples. Optical phase conjugation is a powerful technique that has been proposed and implemented for compensating the scattering that turbid media induce on imaging [19–23] along with compensating the modal and polarization dispersion in multimode fibers [24–26]. Digital phase conjugation [27], substitutes the nonlinear crystal that is needed for conventional phase conjugation with the pair of a digital sensor and a Spatial Light Modulator (SLM). Compared to iterative based wavefront optimization techniques, digital phase conjugation (DPC) requires only a single shot measurement. DPC extracts the correct phase front that undoes the modal scrambling created by the multimode fiber and generates a tightly focused spot at the distal tip of the fiber. The system is open loop; therefore the time that is needed for the calibration of the system is minimal.
2. Principle of operation and experimental setup
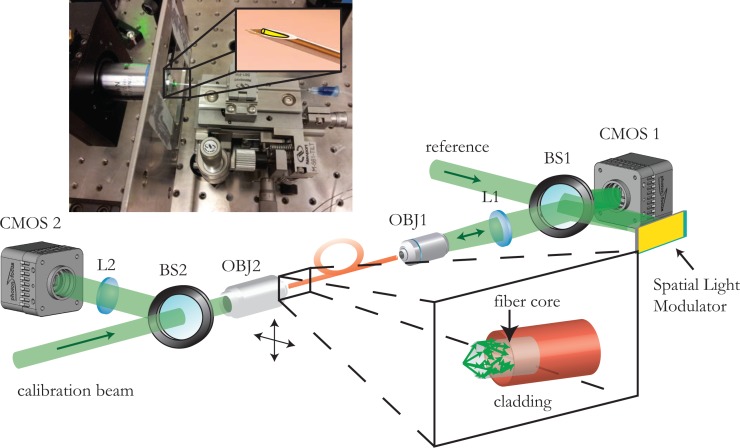
The proposed endoscopic system works as a reflection scanning fluorescence microscope [28]. In order to obtain an image, a focused spot is generated at the distal tip of the fiber and scanned on the object. The induced fluorescence from each point of the scanning grid is collected by the same optical system and is integrated on a photodetector. In our approach, we exploit the large number of degrees of freedom intrinsically available in the multimode fiber (directly linked to number of propagation modes supported by the fiber waveguide) to perform all the described actions. Initially, light is focused on the distal tip of the fiber and gets coupled to the different propagation modes. These modes reach the output of the fiber after following different paths inside the fiber core and also exchanging energy between each other, generating finally what is seemingly a random speckle pattern. The speckled output is combined with the reference and the resulting interference pattern is digitally recorded on the CMOS sensor. We can then reconstruct the field at the proximal end of the fiber and calculate the corresponding conjugate phase pattern. The reference beam transmitted through the beamsplitter is incident onto the SLM, and gets modulated by the phase conjugate pattern displayed on the SLM. The optical conjugate field that is formed in this way is reflected again on the beamsplitter and follows the same path as the image, in the reverse direction, retracing its way back through the fiber to exit the waveguide generating finally a tightly focused diffraction-limited spot at the original position.
A phase lookup table is generated for all the different points along a regular orthogonal grid by scanning the calibration beam around the fiber facet and reconstructing the phase pattern for each corresponding spot (as described above). The generation of diffraction limited spots, along the regular grid allows us to perform scanning based imaging. Light that is tightly focused onto the sample induces a fluorescent signal from the excited volume. The signal is emitted isotropically (in an ideal model where the excited volume is reasonably small) and part of the generated signal is captured by the fiber. The fluorescent signal that is captured by the multimode fiber propagates backwards and is collected by the same CMOS sensor that was used for the imaging, which now acts as a photon bucket. In the case when the photon budget is low, the signal from the fiber can be diverted towards a Photomultiplying Tube (PMT) or any other sensitive point photodetector. The experimental setup is described and graphically presented on Fig. 1.
Fig. 1.
Experimental setup and picture of the needle endoscope. On the lower part, the experimental setup is presented. Light focused on the fiber tip is dispersed over the different propagation modes supported by the fiber (inset). The speckled output is combined with the reference and the resulting interference pattern is digitally recorded onto the CMOS sensor. The reconstructed phase of the hologram is assigned on the Spatial Light Modulator, which then modulates the reference beam. The phase conjugate beam that is generated propagates backwards, retracing its way through the multimode fiber and coming into focus at the original position. The calibration beam can be scanned in both lateral dimensions (moving the calibration objective using motorized stages) generating a regular grid of focused spots and the corresponding phase lookup table. Upper part. Placing the fiber inside a needle tip we can make a rigid ultrathin endoscope that will allow the fiber to remain intact and at the same time allow for minimally invasive endoscopic imaging. The outer diameter of the endoscope is limited only by the needle and can be as small as 460μm for the 250μm cladding fiber used in the experiments.
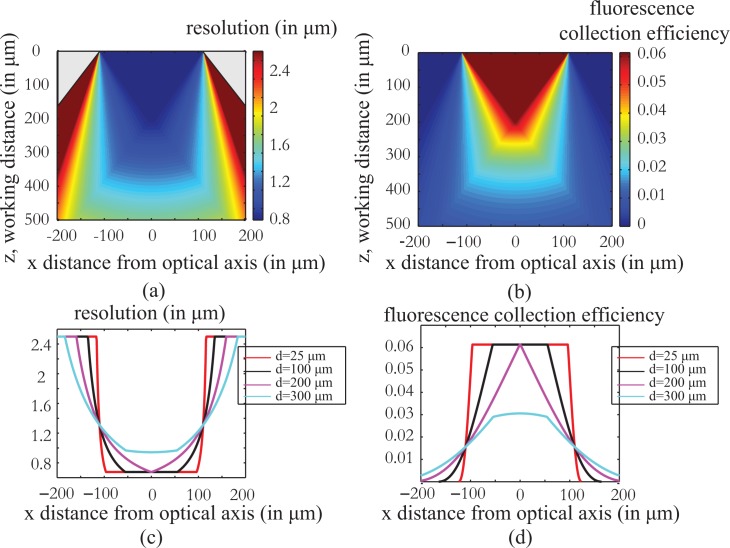
We define the working distance of the MMF endoscope as the distance of the focusing plane away from the distal tip of the multimode fiber, and the Field of View (FOV) as the maximum x and y dimensions of the corresponding regular grid along which the focus can be scanned. The distance between two adjacent focused spots is chosen based on the desired resolution and the speed of the system. The resolution is limited by the diffraction limit imposed by the fiber numerical aperture. Following a geometrical optics analysis (see Appendix A), we can estimate the effective numerical aperture of the fiber for each point in front of the fiber facet, as a function of the working distance (distance from the fiber facet, z) and distance from the optical axis, x. The resolution and fluorescence collection efficiency of the optical system as a function of the NA(x,z) at each point are given by,
| (1) |
and the fluorescence collection efficiency,
| (2) |
The simulation results for both the resolution and the fluorescence collection efficiency are presented in Fig. 2.
Fig. 2.
Resolution and fluorescence collection efficiency of the fiber endoscope as a function of working distance z and the distance from the optical axis of the system x as calculated using a geometrical optics analysis (Appendix A). The calculations are done for a 220μm diameter, 0.53 NA fiber. As shown in Fig. 2(a) and (c), the resolving power of the imaging system becomes worse as the imaging plane is set away from the fiber tip while at the same time, the useful field of view increases. indicate a clear trade off between resolution and field of view. Fig 2 (b), (d) present the fluorescence collection efficiency of the imaging system as a function of position. The efficiency is worse as the fluorophore is placed away from the fiber facet and towards the edges of the field of view. The simulations can help us predict the behavior of the system and correct any differences in the fluorescent levels of the final image.
Figures 2(a) and (c) demonstrate the resolving efficiency of the system, and demonstrate the tradeoff between resolution and field of view as a function of the working distance. The resolution degrades as we move away from the fiber tip but the field of view that we can image becomes larger. Figures 2 (b) and (d) show the relation between fluorescence collection efficiency and the imaging position and follow the same behavior as the resolution. The collection efficiency worsens as we image farther away from the fiber facet and towards the edges of the field of view.
3. Results and discussion
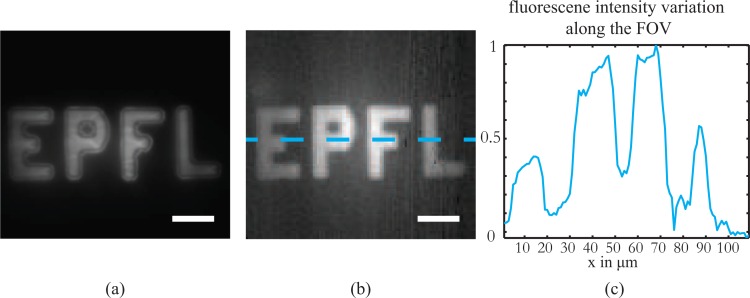
The performance of the fiber-based endoscope was primarily evaluated for a field of view that is larger compared to any of the reported imaging techniques using multimode fibers [16, 17]. In Fig. 3 we present the results of imaging a fluorescent pattern on a glass slide prepared with photolithography. The lateral size of the object is 100μm × 40μm and the total field of view in both images is 110μm × 100μm. The image on the left is the direct widefield fluorescent image recorded in reflection on the camera CMOS2 (see the experimental setup in Fig. 1) whereas the image on the right corresponds to the scanning fluorescence image of the same sample captured through the fiber where the pixel pitch was set to 1μm. The working distance of the endoscope was set to 200μm. We observe that the image quality is very good across the whole field of view without any apparent aberrations introduced. However, a difference on the level of the fluorescence signal between the centre and the edges of the FOV can be observed and matches well with the predicted fluorescence collection efficiency calculations presented in Fig. 2.
Fig. 3.
Fiber endoscope large field of view imaging. The scanning fluorescence image captured from a large field of view with the fiber endoscope at a working distance of 200m is a high fidelity replica of the widefield image taken with a microscope objective. The difference in the fluorescence level between the center and the edges is attributed to the different collections efficiencies away from the optical axis of the fiber and the quasi linear dependence observed coincides with the predicted behavior for the specific working distance (see Fig. 2(d)). The endoscope is capable of providing high information capacity, large field of view images. Scale bar equal to 20μm.
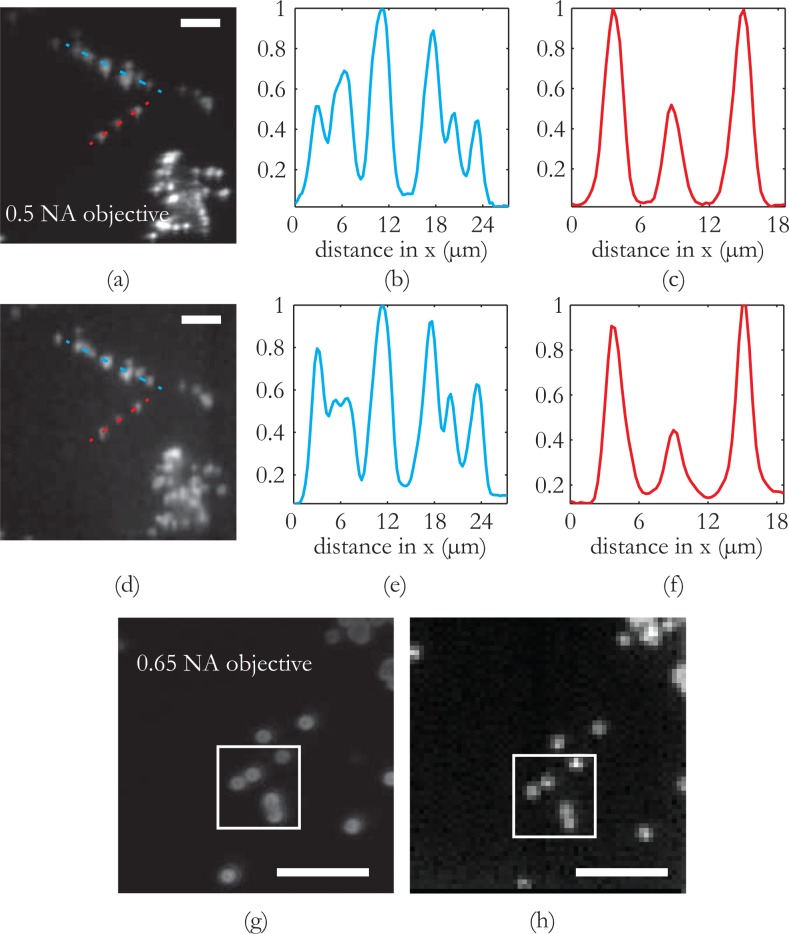
Next, we assess the image quality of the proposed system, first by comparing it against the image quality produced by a lens based optical system of a comparable numerical aperture and then by evaluating the resolution limit. For this purpose, we use a sample that consists of 1μm fluorescent beads laid on a glass substrate. This type of sample will introduce a higher complexity and richer information content. In Fig. 3(a) and (d), we compare the image of the fluorescent beads as taken with a 20×, 0.5 NA microscope objective (similar to the NA of the multimode fiber used in the experiments) against the image acquired with the scanning fluorescense endoscope. In order to directly compare the two images, the image acquired with the scanning method is resampled and convolved with a gaussian filter to eliminate the pixelation effect. The field of view is 60μm × 60μm in both images and the pixel pitch for the fiber scanning is set to 1μm. The level of detail as conveyed by both images is the same, as all possible features that are visible on the microscope objcetive image can be identified on the scanning image taken with the fiber. The overall differences on the level of the fluorescent signal are attributed to the different sides that the images are taken. Moreover, we present cross-sectional plots from two different parts of the image so that we can have a more quantitative comparison. We can observe in Fig. 3(b),(e) and Fig. 3(c),(f) that there is an one to one correspondence of the images acquired. As a conclusion, the lensless, fiber-based scanning fluorescence endoscope that we demonstrate can provide imaging quality that is directly comparable to a lens based optical system of the same numerical aperture.
In order to quantify the resolution limit of the fiber endoscope, we take a more detailed look into the bead sample as shown in Fig. 4(g, h). In this case the widefield fluorescence image is taken with a 0.65 NA microscope objective so that a more detailed view of the 1μm bead sample is revealed. For the scanning system, the pixel pitch is set to 0.5μm, smaller than the expected resolution and the field of view is set to 30μm by 30μm. We can observe that beads closely placed to each other at a distance smaller than 1μm (lower right part of the highlighted box) can be still resolved with our endoscopic system therefore setting the resolution limit of the system to the submicron range, significantly smaller than anything reported thus far [16–18].
Fig. 4.
Comparison of the fiber endoscopic imaging modality vs a conventional optical system of the same numerical aperture and estimation of resolution limit. (a) Widefield 0.5NA microscope objective image and (d) Image acquired with the multimode fiber. Comparison of the imaging capability of the system against a conventional optical system of similar NA. The information conveyed by the lensless multimode fiber endoscope is directly comparable to that given by the 0.5 NA microscope objective. The comparison of the cross sectional plots (b),(e) and (c),(f) verifies the conclusion. Fig. 3(g) and (h) are used to estimate the resolution of the system. In Fig. 3(g) the bead sample is imaged with a 0.65 NA objective to get a more detailed view. The scanning scheme (with a pixel pitch of 0.5μm) gives an image where two beads almost fused into each other can be still be separated, therefore placing the resolution limit of the system in the submicron range. Scale bars in all images are 10μm.
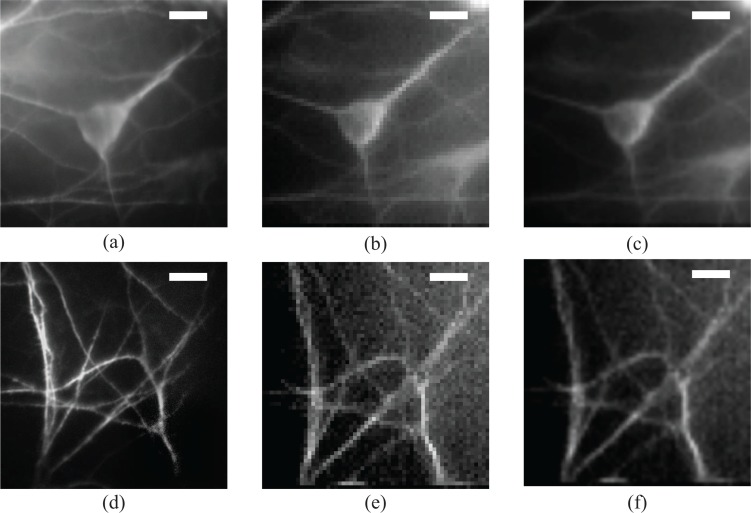
Having verified the efficacy of the scanning fluorescent fiber imaging, we demonstrate high resolution imaging of stained biological samples. This type of samples can be considered, as the real standard that will define whether the system can be used as an endoscope for in vivo diagnosis based on cellular phenotype. For this purpose, we prepare a sample of fluorescently labeled neuronal cells.
Fig. 5.
Probing cellular and subcellular details with the multimode fiber endoscope. Images of fluorescently stained neuronal cells acquired with the multimode fiber endoscope and compared against conventional images acquired with a microscope objective. First column, (a) widefield fluorescent image of a single neuron soma and (d) detail of dendrites, middle row; (b) and (e) direct stitched image as acquired from the fiber and right row, image from the fiber resampled and filtered so that the pixelation induced by the scanning acquisition is overcome. Highly detailed images of the neuronal soma and the dendritic network can be resolved by the fiber imaging system. The high quality of the images can make this endoscope useful for diagnostic purposes based on cellular phenotype. The working distance is 200μm to compensate for the coverslip that separates the cells from the fiber facet. Field of view is 60μm by 60μm and scale bars in all images are 10μm.
In Fig. 6, we present the images of two different parts of the sample. The left column consists of the images as taken with the CMOS2 camera in reflection under widefield excitation (40×, 0.65NA objective), the middle column are the images as they are assembled by digitally scanning the focus spot, pixel by pixel on the regular grid and finally in the right-hand column are the scanned images after resampling and Gaussian filtering to overcome the pixelation that the scanning induces. The acquired images showing the neuronal soma in Fig. 6(b, c) carry all the structural information of the cell body as can be seen by the widefield image Fig. 6(a). The quality of the acquired images can lead to effective diagnosis that depends on cellular phenotype. On the lower row, we present images of more detailed structures; dendrites that have a diameter of 1–3μm. In this case, where the photon budget is lower, the image quality starts degrading; however, we can still collect interesting information about the conformation of such small features.
Fig. 6.
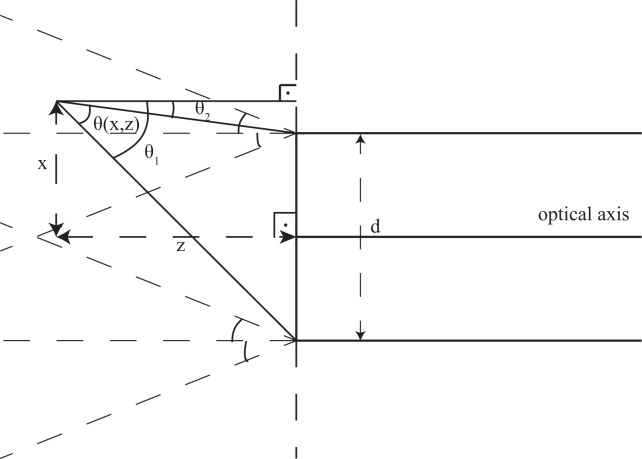
Geometrical optics calculations of the beam diameter as a function of the distance x from the optical axis and the working distance z.
4. Conclusions and outlook
We have demonstrated that by exploiting all the degrees of freedom available in a multimode fiber using digital phase conjugation to focus and scan the light, we have achieved sub-micrometer resolution scanning fluorescent imaging of biological samples. The resolution of the system has been measured by distinguishing 1μm fluorescent beads and was identified to reside on the sub–micron range. The system has been used to image fluorescently stained neuronal cells and detailed images successfully revealed the neuronal somata and the dendritic mesh. The quality of the images offers an opportunity for direct diagnosis based on cellular phenotype. However, the major limitation of multimode fibers is the modal distribution dependence on the spatial conformation (bending) of the fiber. This problem is present in all imaging systems that rely on multimode fibers both for the delivery and the collection of light, as the calibrated phase look-up table will generate correct results only for small perturbations of the fiber spatial conformation [18]. One possible solution to overcoming the problems associated with bending is to make the fiber rigid (therefore avoiding the bending) by epoxying it inside a needle tip. The multimode fiber was inserted in a 25-gauge needle (450 μm diameter), thereby demonstrating a significant reduction in size compared to other endoscopes. Moreover, the fiber part of the endoscope is passive (no active parts) which is expected to facilitate its acceptance since most of fiber endoscopes used clinically are based on passive fiber bundles. An endoscope with a rigid needle front-end is suitable for many applications and the device described in this paper suits this need, if care is taken to provide mechanical stability to the entire fiber. In such applications the proposed fiber endoscope might open opportunities for minimally invasive high-resolution endoscopic imaging through direct tissue penetration. For applications where a flexible probe is required, then we need to find ways to compensate for the spatial mode scrambling. We are working on two separate solutions to this problem. The first approach is to parameterize the spatial configuration of the fiber and accumulate enough input-output data to be able to dynamically calibrate the instrument. The second approach is based on the use of a point source (e.g. a metal nanoparticle) at the distal tip of the fiber, which allows us to continuously recalculate the required excitation light distribution in order to maintain focus.
Acknowledgments
We would like to thank Dr. Elpida Tsika from Moore Lab, EPFL and Dr. Jessica Sordet-Dessimoz from the Histology Core Facitility of EPFL, for providing the neuronal cells and helping with the immunostaining protocol. Also, we would like to thank Gregoire Laporte and Wuzho Song for helping with the photolithographic preparation of the fluorescent patterns. The authors acknowledge partial support from the Bertarelli Foundation under the grant, “Optical Imaging of the Inner Ear for Cellular Diagnosis and Therapy: Cochlear Implants and Beyond”.
Appendix A: Materials and methods
A.1. Experimental setup
The experiments were conducted with a 200/220μm core/1st cladding, 0.37/0.53 NA multimode fiber from Ceramoptec GmbH. The fiber exhibits a NA of 0.37 between the core and the first cladding and a NA of 0.53 between the 1st and the 2nd cladding. Therefore the overall NA of the fiber is somewhere in between those two values (closer to 0.48 according to our measurements). In the calibration stage, the calibration beam is initially focused on the distal fiber facet using a 40×, 0.65 NA microscope objective (OBJ2) to cover all the NA of the multimode fiber. The speckled output that is generated is imaged with a 4-f imaging system comprising of a microscope objective (40×, 0.65 NA, OBJ2) and a 200mm focal length lens (L1) and is combined with the reference using a 45:55 (R:T) pellicle beamsplitter to form an interference pattern on the CMOS sensor (Photonfocus MV1-1312-IE-G2). The laser source is a 532nm, CW, DPSS laser module. The calibration beam is scanned using 3 mechanical stages and the corresponding interference patterns are captured on the CMOS sensor. The phase conjugate patterns for all the focused spots are retrieved by digital reconstruction of the captured holograms. During the imaging stage, the different phase patterns are sequentially assigned on the SLM device and the focused spot is scanned along the original regular grid. The fluorescent signal that is generated is captured by the same fiber and integrated on the same CMOS sensor that was used initially (CMOS1). In the case of the neuronal cells where maximum sensitivity was needed, the signal was integrated onto an EMCCD device (Andor EMCCD iXon 885). The CMOS2 sensor shown in the experimental setup is only used as an observation sensor.
A.2. Sample preparation
The photolithographically prepared fluorescent sample was prepared by diluting SU8 photoresist with Rhodamine-6G fluorescent dye and conventional photolithography to define the pattern. The fluorescent beads used are 1μm nominal diameter orange fluorescent polystyrene beads purchased from Invitrogen Life Technologies Europe. The neuronal cells were stained using a immunofluorescence staining protocol established in Moore Lab, EPFL. The cells are primary rat neuronal cells that were grown on coverslips. After fixation of the cells with 4% PFA, the cells were incubated with a mouse anti-MAP2 primary antibody that binds to the microtubule associated proteins. These proteins contribute to the support of the cell structure and are present over the whole cell surface both the soma and the dendrites. After washing, the cells were incubated with an anti-mouse Alexa-546 secondary antibody that has a yellow fluorescent spectrum. The sample was washed for a final time and then was mounted on glass coverslips to be ready for imaging.
Appendix B: Calculation of fiber NA as a function of working distance and distance from the optical axis
The beam diameter can be found by calculating the maximum angle of the rays that can contribute to the beam at each position from the edges of the fiber. We can find this angle as shown in Fig. 6. Therefore we have,
| (B1) |
and
| (B2) |
In the case that any of the two angles is bigger than θmax= arcsin NAfiber then they are set equal to θmax, to take care of the fact that the fiber has a maximum angle that it can provide.
References and links
- 1.Flusberg B., Cocker E., Piyawattanametha W., Jung J., Cheung E., Schnitzer M., “Fiber-optic fluorescence imaging,” Nat. Methods 2, 941–950 (2005). 10.1038/nmeth820 [DOI] [PMC free article] [PubMed] [Google Scholar]
- 2.Helmchen F., “Miniaturization of fluorescence microscopes using fibre optics,” Exp. Physiol. 87, 737–745 (2002). 10.1113/eph8702478 [DOI] [PubMed] [Google Scholar]
- 3.Jung J., Schnitzer M., “Multiphoton endoscopy,” Opt. Lett. 28, 902–904 (2003). 10.1364/OL.28.000902 [DOI] [PubMed] [Google Scholar]
- 4.Jung J., Mehta A., Aksay E., Stepnoski R., Schnitzer M., “In vivo mammalian brain imaging using one-and two-photon fluorescence microendoscopy,” J. Neurophysiol. 92, 3121–3133 (2004). 10.1152/jn.00234.2004 [DOI] [PMC free article] [PubMed] [Google Scholar]
- 5.Levene M. J., Dombeck D., Kasischke K., Molloy R., Webb W., “In vivo multiphoton microscopy of deep brain tissue,” J. Neurophysiol. 91, 1908–1912 (2004). 10.1152/jn.01007.2003 [DOI] [PubMed] [Google Scholar]
- 6.Murray T. A., Levene M. J., “Singlet gradient index lens for deep in vivo multiphoton microscopy,” J. Biomed. Opt. 17, 0211061–0211064 (2012). 10.1117/1.JBO.17.2.021106 [DOI] [PubMed] [Google Scholar]
- 7.Gmitro A. F., Aziz D., “Confocal microscopy through a fiber-optic imaging bundle,” Opt. Lett. 18, 565–567 (1993). 10.1364/OL.18.000565 [DOI] [PubMed] [Google Scholar]
- 8.Göbel W., Kerr J. N. D., Nimmerjahn A., Helmchen F., “Miniaturized two-photon microscope based on a flexible coherent fiber bundle and a gradient-index lens objective,” Opt. Lett. 29, 2521–2523 (2004). 10.1364/OL.29.002521 [DOI] [PubMed] [Google Scholar]
- 9.Myaing M. T., MacDonald D. J., Li X., “Fiber-optic scanning two-photon fluorescence endoscope,” Opt. Lett. 31, 1076–1078 (2006). 10.1364/OL.31.001076 [DOI] [PubMed] [Google Scholar]
- 10.Engelbrecht C. J., Johnston R. S., Seibel E. J., Helmchen F., “Ultra-compact fiber-optic two-photon microscope for functional fluorescence imaging in vivo,” Opt. Express 16, 5556 (2008). 10.1364/OE.16.005556 [DOI] [PubMed] [Google Scholar]
- 11.Rivera D., Brown C., Ouzounov D., Pavlova I., Kobat D., Webb W., Xu C., “Compact and flexible raster scanning multiphoton endoscope capable of imaging unstained tissue,” Proc. Natl. Acad. Sci. USA 108, 17598–17603 (2011). 10.1073/pnas.1114746108 [DOI] [PMC free article] [PubMed] [Google Scholar]
- 12.Rokitski R., Fainman S., “Propagation of ultrashort pulses in multimode fiber in space and time,” Opt. Express 11, 1497–1502 (2003). 10.1364/OE.11.001497 [DOI] [PubMed] [Google Scholar]
- 13.Di Leonardo R., Bianchi S., “Hologram transmission through multi-mode optical fibers,” Opt. Express 19, 247–254 (2011). 10.1364/OE.19.000247 [DOI] [PubMed] [Google Scholar]
- 14.Čižmár T., Dholakia K., “Shaping the light transmission through a multimode optical fibre: complex transformation analysis and applications in biophotonics,” Opt. Express 19, 18871–18884 (2011). 10.1364/OE.19.018871 [DOI] [PubMed] [Google Scholar]
- 15.Papadopoulos I. N., Farahi S., Moser C., Psaltis D., “Focusing and scanning light through a multimode optical fiber using digital phase conjugation,” Opt. Express 20, 10583 (2012). 10.1364/OE.20.010583 [DOI] [PubMed] [Google Scholar]
- 16.Bianchi S., Di Leonardo R., “A multi-mode fiber probe for holographic micromanipulation and microscopy,” Lab Chip 12, 635–639 (2012). 10.1039/c1lc20719a [DOI] [PubMed] [Google Scholar]
- 17.Čižmár T., Dholakia K., “Exploiting multimode waveguides for pure fibre-based imaging,” Nat. Commun. 3, 1027 (2012). 10.1038/ncomms2024 [DOI] [PMC free article] [PubMed] [Google Scholar]
- 18.Choi Y., Yoon C., Kim M., Yang T., Fang-Yen C., Dasari R., Lee K., Choi W., “Scanner-free and wide-field endoscopic imaging by using a single multimode optical fiber,” Phys. Rev. Lett. 109, 203901 (2012). 10.1103/PhysRevLett.109.203901 [DOI] [PMC free article] [PubMed] [Google Scholar]
- 19.Leith E. N., Upatnieks J., “Holographic imagery through diffusing media,” J. Opt. Soc. Am. 56, 523–523 (1966). 10.1364/JOSA.56.000523 [DOI] [Google Scholar]
- 20.Kogelnik H., Pennington K. S., “Holographic imaging through a random medium,” J. Opt. Soc. Am. 58, 273–274 (1968). 10.1364/JOSA.58.000273 [DOI] [Google Scholar]
- 21.Agarwal G. S., Friberg A. T., Wolf E., “Scattering theory of distortion correction by phase conjugation,” J. Opt. Soc. Am. 73, 529–537 (1983). 10.1364/JOSA.73.000529 [DOI] [Google Scholar]
- 22.Yaqoob Z., Psaltis D., Feld M. S., Yang C., “Optical phase conjugation for turbidity suppression in biological samples,” Nat. Photon. 2, 110–115 (2008). 10.1038/nphoton.2007.297 [DOI] [PMC free article] [PubMed] [Google Scholar]
- 23.Popoff S. M., Lerosey G., Carminati R., Fink M., Boccara A., Gigan S., “Measuring the transmission matrix in optics: an approach to the study and control of light propagation in disordered media,” Phys. Rev. Lett. 104, 100601 (2010). 10.1103/PhysRevLett.104.100601 [DOI] [PubMed] [Google Scholar]
- 24.Yariv A. A., “Three-dimensional pictorial transmission in optical fibers,” Appl. Phys. Lett. 28, 88–89 (1976). 10.1063/1.88650 [DOI] [Google Scholar]
- 25.Tomita Y., Kyuma K., Yahalom R., Yariv A. A., “Demonstration of amplitude-distortion correction by modal dispersal and phase conjugation,” Opt. Lett. 12, 1020–1022 (1987). 10.1364/OL.12.001020 [DOI] [PubMed] [Google Scholar]
- 26.McMichael I., Yeh P., Beckwith P., “Correction of polarization and modal scrambling in multimode fibers by phase conjugation,” Opt. Lett. 12, 507–509 (1987). 10.1364/OL.12.000507 [DOI] [PubMed] [Google Scholar]
- 27.Bellanger C., Brignon A., Colineau J., Huignard J. P., “Coherent fiber combining by digital holography,” Opt. Lett. 33, 2937–2939 (2008). 10.1364/OL.33.002937 [DOI] [PubMed] [Google Scholar]
- 28.Sheppard C. J. R., Choudhury A., “Image formation in the scanning microscope,” J. Mod. Opt. 24, 1051–1073 (1977). [Google Scholar]


