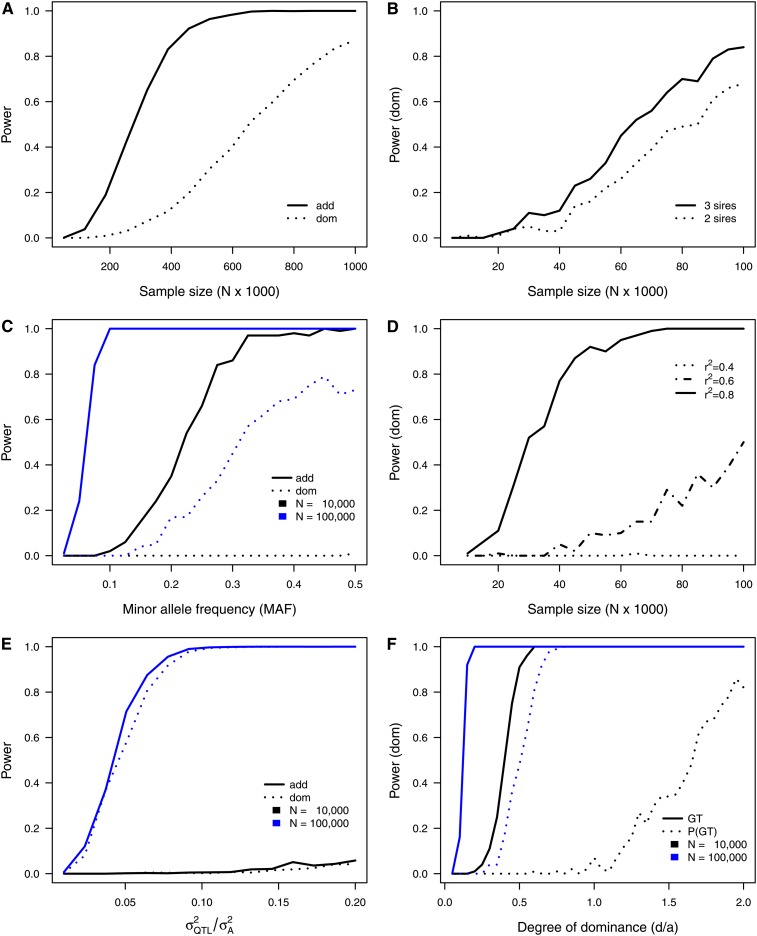
Figure 2 .
Graphical representation of the results obtained from single-marker simulation scenarios according to Table 3. (A) Power to detect additive (add) and dominance (dom) effects conditional on sample size (scenario 1). (B) Power to detect dominance effects conditional on sample size and the number of sires used in calculating genotype probabilities (scenario 2). (C) Power to detect additive (add) and dominance (dom) effects conditional on the minor allele frequency (MAF) in two different sample sizes (scenario 3). (D) Power to detect dominance effects conditional on sample size assuming different LD (r2) between marker and QTL (scenario 4). (E) Power to detect additive (add) and dominance (dom) effects conditional on the proportion of additive genetic variance explained by the QTL () in two different sample sizes (scenario 5). (F) Power to detect dominance effects conditional on the degree of dominance (d/|a|) and compared between true genotypes (GT) and genotype probabilities [P(GT), scenario 6].

