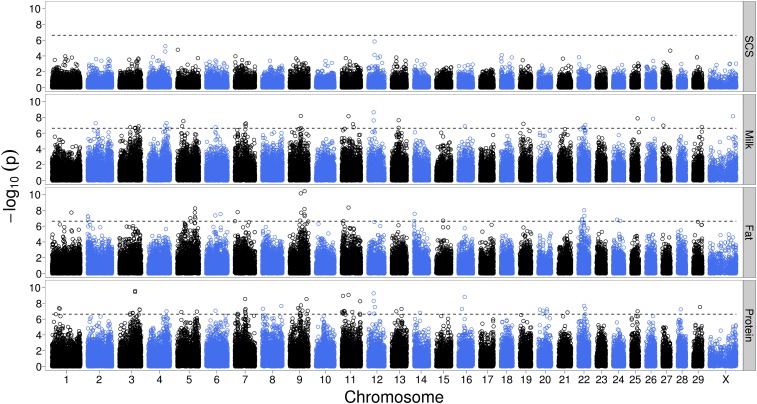
Figure 5 .
Manhattan plots representing the results of a genome scan for dominance, applying correction for relatedness among animals in a two-step mixed-model approach. Analyzed were the traits somatic cell score (SCS), milk yield, fat yield, and protein yield. Shown are the negative decadic logarithms of the raw P-values with a Bonferroni-corrected 1% genome-wide significance level (dashed line).

