

Abstract
An ImageJ JavaScript, AUTOCOUNTER, was specifically developed to monitor and measure LC3B-GFP expression in living human astrocytoma cells, namely T98G and U373-MG. Discrete intracellular GFP fluorescent spots derived from transduction of a Baculovirus replication-defective vector (BacMam LC3B-GFP), followed by microscope examinations at different times. After viral transgene expression, autophagy was induced by Rapamycin administration and assayed in ph-p70S6K/ p70S6K and LC3B immunoblotting expression as well as by electron microscopy examinations. A mutated transgene, defective in LC3B lipidation, was employed as a negative control to further exclude fluorescent dots derived from protein intracellular aggregation. The ImageJ JavaScript was then employed to evaluate and score the dynamics changes of the number and area of LC3B-GFP puncta per cell in time course assays and in complex microscope examinations. In conclusion, AUTOCOUNTER enabled to quantify LC3B-GFP expression and to monitor dynamics changes in number and shapes of autophagosomal-like vesicles: it might therefore represent a suitable algorithmic tool for in vitro autophagy modulation studies.
Key words: autophagy, autophagosome, vacuole, GFP, Rapamycin.
Introduction
Autophagy is a constitutive, dynamic, bulk degradation process that is necessary for a number of processes in living cells.1,2 Besides these functions, recent studies have revealed that pro-autophagic drugs constitute a novel strategy to overcome apoptosis-resistant cancers.3 Among these, Glioblastoma multiforme, the most common and life-threatening primary central nervous system malignant tumor, is characterized by resistance to apoptosis, high proliferation and invasiveness, and poor response to surgery, radiation, and chemotherapy-based treatments. In autophagy, the constant flow of autophagosomes to lysosomes is tightly regulated by a number of proteins. One of these, LC3B, initially present in a soluble form in the cytoplasm (LC3B-I), is converted to a lipidated form (LC3B-II), sequestered into autophagosomal membranes and finally delivered, along with autophagosomal cargo, to the lysosome and degraded. Consequently, the conversion of LC3B and its turnover can be used as a measure of the rate of autophagic degradation in cells.4 One of the most frequently used methods to monitor autophagy in vitro is based on GFP (Green Fluorescent Protein) expressed as a fusion protein with LC3B.5 However, this approach is limited by several issues such as the subjectivity in counting GFP-positive structures, the generation of fluorescent intracellular protein aggregates independent of autophagy and the possibility of a self-induction of autophagy by transfection procedures.6 Other in vitro methods to visualize the autophagic status are based on the staining of the growing cells with acidotropic dyes such as monodansyl-cadaverine (MDC),7 acridine orange,8 LysoSensor Blue9 and LysoTracker Red,10 and their subsequent steady-state microscopic visualization. However, the incorporated dyes are not strictly specific markers for autophagosomes;11 in addition, problems with non-specific background staining and meta-stable emission fluorescent spectra are often reported.12 In this report, we present an application for quantitative analysis of autophagosomes associated with LC3B-GFP fluorescence expression. We have experimentally applied and verified this computer assisted approach in a particular experimental setup: a well established Rapamycin-mediated autophagic induction in two different human glioma cell lines.
Materials and Methods
Human astrocytoma cells
Human astrocytoma established cell lines, i.e. T98G and U373-MG, provided by ECACC and previously employed,13 were cultured at 37°C and 5% CO2 atmosphere, using D-MEM medium supplemented with 10% FBS, 100 units/mL penicillin, 0.1 mg/mL streptomycin, and 1% L-glutamine (Invitrogen, Carlsbad, CA, USA).
Autophagy induction and detection
Rapamycin-mediated autophagy induction was carried out seeding 2×10⁵ cells onto 12-multiwell plates, 12 h before autophagy-inducer addition. Rapamycin (Sigma-Aldrich, St. Louis, MO, USA), resuspended in DMSO, was added and incubated for different times at the following concentrations (0.1, 0.5, and 1 µM). Protein expression was evaluated with 12% SDS-PAGE. Protein extracts were quantified using the Quant-it Protein Assay Kit (Invitrogen) and then denatured in Laemmli sample buffer (2% SDS, 6% glycerol, 150 mM beta-mercaptoethanol, 0.02% bromophenol blue, and 62.5 mM Tris-HCl pH=6.8). After electrophoresis, proteins were transferred onto nitro-cellulose membrane Hybond-C Extra (GE Healthcare, Waukesha, WI, USA). Membranes were blocked for 1 h with 8% non-fat milk in TBS (138 mM NaCl, 20 mM Tris pH=7.6) containing 0.1% Tween 20 and then incubated overnight at 4°C with primary antibodies. Species-specific peroxidase-labelled ECL secondary antibodies (GE Healthcare) were employed. Protein signals were revealed using the ECL Advance Western Blotting Detection Kit (GE Healthcare). The following primary rabbit polyclonal antibodies were employed: anti-LC3B, anti-(ph-p70S6 Kinase), anti-(p70S6 Kinase) (Cell Signalling Technology Inc., Danvers, MA, USA). Anti-β-actin was used for an internal control (mouse monoclonal antibody, Cell Signalling Technology). Protein expression was quantified by densitometric analysis with ImageJ software (http://rsbweb.nih.gov/ij/) according to the guidelines.
The Premo Autophagy Sensor Kit (Invitrogen) was employed for autophagosome detection, according to the guidelines. Briefly, T98G and U373-MG cells were transduced with BacMam LC3B-GFP or with BacMam LC3B(G120A)-GFP with a multiplicity of infection (MOI) equal to 30, using 5×10³ cells in 96-multiwell plates. Titration experiments with different MOIs (from 10 to 100) were performed. At different post-transduction (p.t.) times, an inverted fluorescence microscope (Eclipse Nikon TS100) was employed for live cells imaging using 40× magnification. For electron microscopy analysis, T98G and U373-MG cells (106) were grown in DMEM medium and treated with the autophagy inducer Rapamycin (1 µM). At 24 h p.t., cells were harvested by centrifugation at 800 rpm for 3 min and fixed with 2% glutaraldehyde in DMEM, for 2 h at room temperature. Cells were then rinsed in PBS (pH=7.2) overnight and post-fixed in 1% aqueous OsO4 for 2 h at room temperature. After that, cells were pre-embedded in 2% agarose in water, dehydrated in acetone, and finally embedded in epoxy resin (Electron Microscopy Sciences, EM-bed812). Ultrathin sections (50÷60 nm) were collected on formvar-carbon-coated nickel grids and stained with uranyl acetate and lead citrate. The specimens were observed with a Zeiss EM900 transmission electron microscope (TEM) equipped with a 30 µm objective aperture and operating at 80 kV.
ImageJ JavaScript
AUTOCOUNTER, a JavaScript implementation to analyze LC3B-GFP expression dynamics, is based upon ImageJ programming language (http://rbsweb.nih.gov/ij/) and is a custom-made list of ImageJ Java commands with fine-tuned parameters. This method is quasi-operator-independent because of i) the operator's use of two ImageJ tools (Freehand Selection, Threshold) and ii) the action of the operator-independent ImageJ JavaScript (Supplementary Figures 1 and 2).
Figure 1.

Rapamycin-treatment induced autophagy in T98G and U373-MG cells. Immunoblotting and densitometric analysis of the ph-p70S6K, p70S6K and LC3B expression 24 h p.t. with different Rapamycin concentrations. In densitometric analysis (values under panels), the protein expression was normalized to β-actin (using ImageJ software).
Figure 2.

Transmission electron microscopy analysis of T98G and U373-MG cells. Cells were untreated (panels a and b, respectively for T98G and U373-MG cells) or treated (panels c and d) with the autophagy-inducer Rapamycin (1 µM), harvested at 24 h p.t., fixed and stained for ultrastructural visualization at 12,000× magnification with a Zeiss EM900 TEM. Arrows indicate large intracellular vesicles, likely autophagosomes. Scale bars: 1 µm.
Briefly, by means of the Freehand Selection, the operator draws a red line highlighting the contour of a fluorescence-positive cell. Afterward, the operator-independent algorithm performs the following steps: i) split of the original RGB (red-green-blue) image into the three color channels to select the contribution of the green fluorescence; and ii) subtraction of the red channel from the green one to better distinguish the green vesicles/particles and to better eliminate the background contribution. Then, the operator refines the vesicle/particle contrast by means of the Threshold and the operator-independent algorithm performs the detection and the measurement of the vesicles in terms of number and area (default thresholding/segmentation method based on the IsoData algorithm, Supplementary Figures 1 and 2). AUTOCOUNTER ImageJ JavaScript is available upon request.
Results
Rapamycin-mediated autophagy induction was performed in T98G and U373-MG cells. In order to assess the Rapamycin efficacy in inducing autophagy by blocking the mTOR pathway, both T98G and U373-MG cells were initially incubated with different concentrations of Rapamycin (0.1, 0.5, and 1 µM) for 24 h; then, proteins were extracted and subjected to SDS electrophoresis. mTOR inhibition was evaluated by immunoblotting measuring ph-p70S6K/p70S6K ratio, while autophagy induction by LC3B-I to LC3B-II conversion. As reported in Figure 1, Rapamycin treatment resulted in a decrease of ph-p70S6K/p70S6K ratio; in addition, LC3B-II/BACT ratio increased in both cell lines, at each concentration of Rapamycin, suggesting autophagy activation. A TEM comparative analysis of the ultrastructural features of T98G and U373-MG cells, treated with 1 µM Rapamycin, revealed the presence of large cytoplasmic vacuoles containing residual digested material. Importantly, these autophagy-like vesicles were nearly absent in untreated cells (Figure 2). The Premo Autophagy Sensor was then employed for autophagy monitoring as follows T98G and U373-MG cells were seeded onto 96-multiwell plates at 5×10³; after cell attachment, the Premo Autophagy Sensor was added (MOI=30). After overnight culture, cells were incubated with Rapamycin (1 µM) as before and LC3B-GFP expression was time-course monitored using an inverted fluorescence microscope (Eclipse Nikon TS100). As a control, the BacMam LC3B(G120A)-GFP was similarly transduced in T98G and U373-MG cells, before Rapamycin administration; this mutation prevents the LC3B cleavage and the subsequent lipidation during normal autophagy, and thus the protein localization remains cytosolic and diffuse. As reported in Figure 3, Rapamycin untreated cells, transduced separately with wild-type BacMam LC3B-GFP or with BacMam LC3B(G120A)-GFP, showed, in a relatively low percentage (5÷10%), a diffuse cytosolic fluorescence: furthermore, in both cell lines, about 1% displayed a GFP punctate expression and, altogether, these patterns were maintained unaltered for 5 days of culture. Similarly, Rapamycin treated cells, transduced with BacMam LC3B(G120A)-GFP, generally displayed a 1÷3% of GFP punctate expression, independently from the time-course observation. Differently, the amount of LC3B-GFP dots per cell was significantly increased after Rapamycin administration, particularly from 24 to 48 h p.t. Following treatment with Chloroquine diphosphate at 30, 60, and 90 µM for 12 h, T98G and U373-MG cells, previously transduced with BacMam LC3B-GFP and treated with Rapamycin (1 µM) as before, exhibited a marked increase in LC3B-GFP expression, as expected: however, fluorescent spots are not clearly defined, resulting in large irregular shapes (Supplementary Figure 3).
Figure 3.
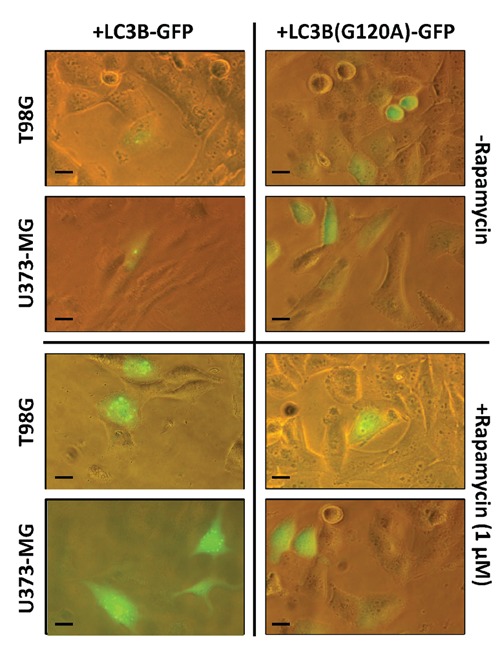
LC3B-GFP and LC3B(G120A)-GFP expression in Rapamycin treated T98G and U373-MG cells. T98G and U373-MG cells (5×10³) were transduced with LC3B-GFP and LC3B(G120A)-GFP BacMam viral particles (MOI=30) and, after 12 h, treated or not with Rapamycin (1 µM). After 24 h of further incubation, cells were analysed using an inverted fluorescence microscope at 40× magnification. Scale bars: 10 µm.
More specifically, to quantify the LC3B-GFP puncta per cell, in an unsupervised manner, a particular ImageJ JavaScript was developed. As summarized in the Materials and Methods section and in the Supplementary Figure 1, the program analysed DIC phase contrast-fluorescent photographs: the contours of cells were drawn by the operator and, after that, the number of intracellular fluorescent spots (#ves) and their percent area within the cell area (Aves/Acell) were calculated. In addition, the distribution of the fluorescent spots was calculated classifying their area in custom-defined classes (e.g., small: 0<C1≤1 µm2; medium: 1<C2≤3 µm2; large: C3>3 µm2).
The program was then applied in fluorescent spots calculation of Figure 4: panels a to d reported the time-course imaging of T98G and U373-MG cells after LC3B-GFP and 10 µM Rapamycin administration at 4 h (t1) and 5 h (t2). As highlighted in Table 1, the mean percent variation of vesicle area [▵(Aves/Acell)] in the time interval t1–t2 sensibly increased in both cell lines (61.6% and 96.7%, respectively for T98G and U373-MG); depending on the cell line, different trends were reported for the mean percent variation of number of fluorescent vesicles (▵#ves) (−22.3% and 40.9%, respectively for T98G and U373-MG). As expected, following the time progression, fusions of fluorescent organelles into larger ones and de novo generation of small and medium organelles were scored.
Figure 4.

Time-course analysis of LC3B-GFP expression in T98G and U373-MG cells. Cells were transduced with BacMam LC3B-GFP viral particles (MOI=30); after 12 h of incubation, cells were treated with Rapamycin (10 µM) and analysed at 4 h (t1) and 5 h (t2) p.t. Recorded DIC images by inverted fluorescence microscope were then analysed in the variation of number and area of vesicles by AUTOCOUNTER. The overall areas of the analysed cells were calculated. These results were reported in Table 1, referring to T98G (panels a and b) and to U373-MG (panels c and d). Scale bars: 10 µm.
Table 1. Time-course analysis of LC3B-GFP expression in T98G and U373-MG cells (results related to Figure 4, panels a to d).
| Time-course* | t1 | t2 | ||||||||
|---|---|---|---|---|---|---|---|---|---|---|
| Aves/Acell | #ves | #ves | #ves | #ves | Aves/Acell | #ves | #ves | #ves | #ves | |
| (%) | C1 | C2 | C3 | (%) | C1 | C2 | C3 | |||
| T98G Panel a | 2.1 | 19 | 15 | 3 | 1 | 3.5 | 12 | 4 | 7 | 1 |
| T98G Panel b | 3.4 | 13 | 4 | 8 | 1 | 5.3 | 12 | 5 | 2 | 5 |
| U373-MG Panel c | 1.2 | 9 | 5 | 3 | 1 | 3.2 | 17 | 11 | 3 | 3 |
| U373-MG Panel d | 2.0 | 14 | 12 | 2 | 0 | 2.6 | 13 | 10 | 3 | 0 |
| ▵t° | ▵t=t2–t1 | ||||
|---|---|---|---|---|---|
| ▵(Aves/Acell) | ▵#ves | ▵#ves C1 | ▵#ves C2 | ▵#ves C3 | |
| (%) | (%) | ||||
| T98G | 61.6 | −22.3 | −5 | −1 | 2 |
| U373-MG | 96.7 | 40.9 | 2 | 0.5 | 1 |
AUTOCOUNTER analysis in time-course imaging of T98G and U373-MG cells after LC3B-GFP and Rapamycin (10 µM) administration at 4 h (t1) and 5 h (t2). Ratio between vesicle area and cell area (Aves/Acell), number of vesicles (#ves), and number of vesicles grouped, according to their area, into three defined classes (small: 0<C1≤1 µm2; medium: 1<C2≤3 µm2; large: C3>3 µm2) are reported.
"°Dynamic change of vesicle pattern in the time interval ▵t=t2–t1 in terms of mean percent variation of vesicle area [▵(Aves/Acell)], mean percent variation of number of vesicles (▵#ves), and mean variation of number of vesicles in ranges of vesicle area.
In Figure 5, T98G and U373-MG cells characterized by difficult-to-measure fluorescent patterns were analysed by AUTOCOUNTER: as reported, the program detected almost all the fluorescent vesicles with a predominant distribution into small and medium size classes (Supplementary Table 1).
Figure 5.

Specificity and sensitivity of LC3B-GFP detection by AUTOCOUNTER. T98G and U373-MG cells were transduced with BacMam LC3B-GFP viral particles (5×10³ cells, MOI=30); after 12 h culturing, cells were then treated with Rapamycin (1 µM) and further incubated for additional 24 h. AUTOCOUNTER analysis was then performed on a0 and b0 light and fluorescent photograph panels. In panels a1 and b1, the contours of the cells were drawn by the operator. Then, panels a2 and b2 showed the transformed masks for vesicles number and area analysis. Scale bars: 10 µm. Size statistics of the GFP scored vesicles was reported in Supplementary Table 1.
To further assess if LC3B-GFP scoring was associated with the modulation of the autophagy induction, T98G and U373-MG cells were transduced with LC3B-GFP (5×10³ cells into 96-multiwells and MOI=30, as above) and then treated with increasing concentrations of Rapamycin (0.1, 0.5, 5, and 10 µM). As a result, fluorescent spots were primarily detected at the highest Rapamycin concentration even after 2 h p.t. Then, after 24 h p.t., fluorescent spots were analysed for all assays with AUTOCOUNTER. As reported in Figure 6, fluorescent vesicle areas were linearly correlated to the amount of the autophagy-inducer employed (correlation coefficient R2=0.9162). Differently, no significant correlation between the vesicle number and Rapamycin treatments was obtained (data not shown).
Figure 6.

Kinetics of LC3B-GFP expression upon Rapamycin differential treatments. T98G and U373-MG cells were transduced with BacMam LC3B-GFP viral particles (5×10³ cells, MOI=30); after 12 h culturing, cells were then treated with different Rapamycin concentrations (0.1, 0.5, 5, and 10 µM) and further incubated for additional 24 h. Scale bars: 10 µm. a) AUTOCOUNTER analysis was then performed in four different replicas for each treatment, evaluating overall vesicles number and area. b) Plot of the percent vesicle area normalized to the entire cell area vs. Rapamycin concentrations. The thinner line indicates the linear regression analysis. Vertical bars indicate the standard deviations.
Discussion
Autophagy is a constitutive process in most cell types and it can be induced by certain stimuli such as nutrient starvation, Rapamycin treatment,14 and infection with pathogens.15,16 Currently, the most commonly used and specific inducer of autophagy is Rapamycin, which directly inhibits mTOR in living cells.14,17
Autophagy can be observed by ultrastructural imaging of autophagosomes and other organelles involved in the process.18,19 Autophagosome membranes are smooth double membranes that engulf cytoplasmic material including mitochondria and ribosomes.20 Electron microscopy analysis can be employed in autophagy qualitative analysis, even if autophagosomes counting and the measure of their size can be achieved.12
Besides ultrastructural examinations, one of the most common imaging methods in autophagy studies is the visualization of the recruitment of microtubule-associated protein 1 light chain 3 beta (LC3B) to autophagosomes, an early step in autophagy that occurs when the protein is cleaved and lipidated.
LC3B is modified during the induction of autophagy through several processing steps including cleavage by the protease ATG4B to generate LC3-I, ATG3/7-mediated ligation of phosphatidylserine or phosphatidylethanolamine to generate LC3-II21 and translocation to the autophagosomal membrane.22 A second reaction catalyzed by ATG4B removes LC3-II from the autophagosomal membrane by delipidation. Translocation of LC3B-GFP can be identified by puncta that appear following engagement of the autophagic response.22
Although the analysis of fluorescent LC3B-GFP is a useful approach, it is tedious to quantify the autophagy by the manual counting of the fluorescent puncta. Furthermore, the cells should also be counted using unbiased procedures such as multispectral imaging flow cytometry.23–25 Of note, LC3B-GFP can associate with ubiquitinated protein aggregates referred to as Aggresome-Like Induced Structures (ALIS)26,27 and p62 bodies/sequestosomes.28 Therefore, a lipidation-defective LC3 mutant, where glycine 120 is mutated to alanine, was employed as a negative control. After transduction of the mutant and Rapamycin administrations, a very low amount of aggregates, independently of autophagy, was scored in both T98G and U373-MG cells. Similarly, as we have reported, the transfection protocol itself did not artifactually induce LC3B-GFP discrete signals. We have therefore introduced an ImageJ JavaScript for autophagy evaluation, AUTOCOUNTER, which resulted less labor intensive than western blotting and less subjective than manual counting of autophagic puncta under fluorescent microscopy examinations. Using LC3B-GFP-transduced and Rapamycin-stimulated cells, we have showed that the assay can be used to quantify the autophagy induction and to follow time-course dynamic changes in autophagic vesicles formation. This application was designed to monitor the autophagy status through the evaluation of the amount of puncta per cell as well as their area. In addition, it was reported that quantified autophagosome areas, in many cases, correlated with the rates of protein degradation.29–31 Therefore, the employed surface analysis of the same target cell in time-course assays may be informative regarding the specific autophagic status and its progression. The ImageJ JavaScript was then assayed in sensitivity and specificity of detection of fluorescent dots in complex cell panels. The program was able to detect nearly all vesicle-like spots, providing also statistics on their sizes. To correctly perform these assays, we have reported that, before the autophagy induction, the LC3B-GFP background number of puncta was relatively low (the frequencies of cells with fluorescent dots were about 1/100 and 1/150, respectively for T98G and U373-MG). As a consequence, the marked increase in LC3B-GFP expression was mainly associated with induced autophagosomes against a low background of constitutive autophagy. As extensively reported, the treatment with the lysosomotropic agent Chloroquine increased lysosomal pH inhibiting lysosomal fusion with the autophagosomes: this process interfered with the autophagic flux producing autophagosomes accumulation.32 However, in our experiments, this treatment resulted in an increase of the overall fluorescence signals, but with a clear worse geometrical definition of the resulted intracellular vesicles.
Furthermore, it was not clearly established if different sizes of LC3B-GFP positive vesicles correlated with the levels of autophagy. Therefore, the proposed program was designed to subdivide, according to the operator's requests, the intracellular fluorescent dots into three micrometric classes (small, medium, and large area). In addition, as a result of our assay, the increase in the autophagy-inducer administration clearly caused an increase of the overall surface of the autophagic vesicles rather than of their total number within the cells. In conclusion, we have developed and assayed an ImageJ JavaScript specifically devoted to LC3B-GFP expression analysis in living human astrocytoma cells: this program is mainly intended for in vitro studies of autophagy modulation. In addition, this program might be a framework for further refinements such as the possibility to track LC3B-RFP (Red Fluorescence Protein) vesicle expression as well as other fluorescence-based or non-fluorescence-based intracellular signals in cells of different origins.
Acknowledgements:
the present study was funded by Monte dei Paschi di Siena, FAR, PRIN 2008, and INAIL 2010.
References
- 1.Mizushima N. Autophagy: process and function. Genes Dev. 2007;21:2861–73. doi: 10.1101/gad.1599207. [DOI] [PubMed] [Google Scholar]
- 2.Yang Z, Klionsky DJ. An overview of the molecular mechanism of autophagy. Curr Top Microbiol Immunol. 2009;335:1–32. doi: 10.1007/978-3-642-00302-8_1. [DOI] [PMC free article] [PubMed] [Google Scholar]
- 3.Kögel D, Fulda S, Mittelbronn M. Therapeutic exploitation of apoptosis and autophagy for glioblastoma. Anticancer Agents Med Chem. 2010;10:438–49. doi: 10.2174/1871520611009060438. [DOI] [PubMed] [Google Scholar]
- 4.Klionsky DJ, Abeliovich H, Agostinis P, Agrawal DK, Aliev G, Askew DS, et al. Guidelines for the use and interpretation of assays for monitoring autophagy in higher eukaryotes. Autophagy. 2008;4:151–75. doi: 10.4161/auto.5338. [DOI] [PMC free article] [PubMed] [Google Scholar]
- 5.Mizushima N, Yamamoto A, Matsui M, Yoshimori T, Ohsumi Y. In vivo analysis of autophagy in response to nutrient starvation using transgenic mice expressing a fluorescent autophagosome marker. Mol Biol Cell. 2004;15:1101–11. doi: 10.1091/mbc.E03-09-0704. [DOI] [PMC free article] [PubMed] [Google Scholar]
- 6.Mizushima N, Yoshimori T. How to interpret LC3 immunoblotting. Autophagy. 2007;3:542–5. doi: 10.4161/auto.4600. [DOI] [PubMed] [Google Scholar]
- 7.Niemann A, Baltes J, Elsasser HP. Fluorescence properties and staining behavior of monodansylpentane, a structural homologue of the lysosomotropic agent monodansylcadaverine. J Histochem Cytochem. 2001;49:177–85. doi: 10.1177/002215540104900205. [DOI] [PubMed] [Google Scholar]
- 8.Paglin S, Hollister T, Delohery T, Hackett N, McMahill M, Sphicas E, et al. A novel response of cancer cells to radiation involves autophagy and formation of acidic vesicles. Cancer Res. 2001;61:439–44. [PubMed] [Google Scholar]
- 9.Florez-McClure ML, Linseman DA, Chu CT, Barker PA, Bouchard RJ, Le SS, et al. The p75 neurotrophin receptor can induce autophagy and death of cerebellar Purkinje neurons. J Neurosci. 2004;24:4498–509. doi: 10.1523/JNEUROSCI.5744-03.2004. [DOI] [PMC free article] [PubMed] [Google Scholar]
- 10.Scott RC, Schuldiner O, Neufeld TP. Role and regulation of starvation-induced autophagy in the Drosophila fat body. Dev Cell. 2004;7:167–78. doi: 10.1016/j.devcel.2004.07.009. [DOI] [PubMed] [Google Scholar]
- 11.Bampton ET, Goemans CG, Niranjan D, Mizushima N, Tolkovsky AM. The dynamics of autophagy visualized in live cells: from autophagosome formation to fusion with endo/lysosomes. Autophagy. 2005;1:23–36. doi: 10.4161/auto.1.1.1495. [DOI] [PubMed] [Google Scholar]
- 12.Munafo DB, Colombo MI. A novel assay to study autophagy: regulation of autophagosome vacuole size by amino acid deprivation. J Cell Sci. 2001;114:3619–29. doi: 10.1242/jcs.114.20.3619. [DOI] [PubMed] [Google Scholar]
- 13.Barbieri G, Palumbo S, Gabrusiewicz K, Azzalin A, Marchesi N, Spedito A, et al. Silencing of cellular prion protein (PrPC) expression by DNA-antisense oligonucleotides induces autophagy-dependent cell death in glioma cells. Autophagy. 2011;7:840–53. doi: 10.4161/auto.7.8.15615. [DOI] [PubMed] [Google Scholar]
- 14.Kamada Y, Funakoshi T, Shintani T, Nagano K, Ohsumi M, Ohsumi Y. Tormediated induction of autophagy via an Apg1 protein kinase complex. J Cell Biol. 2000;150:1507–13. doi: 10.1083/jcb.150.6.1507. [DOI] [PMC free article] [PubMed] [Google Scholar]
- 15.Jackson WT, Giddings TH, Jr., Taylor MP, Mulinyawe S, Rabinovitch M, Kopito RR, et al. Subversion of cellular autophagosomal machinery by RNA viruses. PLoS Biol. 2005;3:e156–e156. doi: 10.1371/journal.pbio.0030156. [DOI] [PMC free article] [PubMed] [Google Scholar]
- 16.Joubert PE, Meiffren G, Gregoire IP, Pontini G, Richetta C, Flacher M, et al. Autophagy induction by the pathogen receptor CD46. Cell Host Microbe. 2009;6:354–66. doi: 10.1016/j.chom.2009.09.006. [DOI] [PubMed] [Google Scholar]
- 17.Klionsky DJ, Meijer AJ, Codogno P. Autophagy and p70S6 kinase. Autophagy. 2005;1:59–60. doi: 10.4161/auto.1.1.1536. [DOI] [PubMed] [Google Scholar]
- 18.Arstila AU, Trump BF. Studies on cellular autophagocytosis. The formation of autophagic vacuoles in the liver after glucagon administration. Am J Pathol. 1968;53:687–733. [PMC free article] [PubMed] [Google Scholar]
- 19.Arstila AU, Trump BF. Autophagocytosis: origin of membrane and hydrolytic enzymes. Virchows Arch B Cell Pathol. 1969;2:85–90. doi: 10.1007/BF02889572. [DOI] [PubMed] [Google Scholar]
- 20.Kraft C, Deplazes A, Sohrmann M, Peter M. Mature ribosomes are selectively degraded upon starvation by an autophagy pathway requiring the Ubp3p/Bre5p ubiquitin protease. Nat Cell Biol. 2008;10:602–10. doi: 10.1038/ncb1723. [DOI] [PubMed] [Google Scholar]
- 21.Sou YS, Tanida I, Komatsu M, Ueno T, Kominami E. Phosphatidylserine in addition to phosphatidylethanolamine is an in vitro target of the mammalian Atg8 modifiers, LC3, GABARAP, and GATE-16. J Biol Chem. 2006;281:3017–24. doi: 10.1074/jbc.M505888200. [DOI] [PubMed] [Google Scholar]
- 22.Kabeya Y, Mizushima N, Ueno T, Yamamoto A, Kirisako T, Noda T, et al. LC3, a mammalian homologue of yeast Apg8p, is localized in autophagosome membranes after processing. EMBO J. 2000;19:5720–8. doi: 10.1093/emboj/19.21.5720. [DOI] [PMC free article] [PubMed] [Google Scholar]
- 23.Shvets E, Fass E, Elazar Z. Utilizing flow cytometry to monitor autophagy in living mammalian cells. Autophagy. 2008;4:621–8. doi: 10.4161/auto.5939. [DOI] [PubMed] [Google Scholar]
- 24.Eng KE, Panas MD, Hedestam GB, McInerney GM. A novel quantitative flow cytometry-based assay for autophagy. Autophagy. 2010;6:634–41. doi: 10.4161/auto.6.5.12112. [DOI] [PubMed] [Google Scholar]
- 25.Hundeshagen P, Hamacher-Brady A, Eils R, Brady NR. Concurrent detection of autolysosome formation and lysosomal degradation by flow cytometry in a high-content screen for inducers of autophagy. BMC Biol. 2011;9:38–38. doi: 10.1186/1741-7007-9-38. [DOI] [PMC free article] [PubMed] [Google Scholar]
- 26.Szeto J, Kaniuk NA, Canadien V, Nisman R, Mizushima N, Yoshimori T, et al. ALIS are stress-induced protein storage compartments for substrates of the proteasome and autophagy. Autophagy. 2006;2:189–99. doi: 10.4161/auto.2731. [DOI] [PubMed] [Google Scholar]
- 27.Kaniuk NA, Kiraly M, Bates H, Vranic M, Volchuk A, Brumell JH. Ubiquitinated-protein aggregates form in pancreatic beta-cells during diabetes-induced oxidative stress and are regulated by autophagy. Diabetes. 2007;56:930–9. doi: 10.2337/db06-1160. [DOI] [PubMed] [Google Scholar]
- 28.Pankiv S, Clausen TH, Lamark T, Brech A, Bruun JA, Outzen H, et al. p62/SQSTM1 binds directly to Atg8/LC3 to facilitate degradation of ubiquitinated protein aggregates by autophagy. J Biol Chem. 2007;282:24131–45. doi: 10.1074/jbc.M702824200. [DOI] [PubMed] [Google Scholar]
- 29.Kovacs AL, Grinde B, Seglen PO. Inhibition of autophagic vacuole formation and protein degradation by amino acids in isolated hepatocytes. Exp Cell Res. 1981;133:431–6. doi: 10.1016/0014-4827(81)90336-0. [DOI] [PubMed] [Google Scholar]
- 30.Mortimore GE, Hutson NJ, Surmacz CA. Quantitative correlation between proteolysis and macro- and microautophagy in mouse hepatocytes during starvation and refeeding. Proc Natl Acad Sci USA. 1983;80:2179–83. doi: 10.1073/pnas.80.8.2179. [DOI] [PMC free article] [PubMed] [Google Scholar]
- 31.Mortimore GE, Lardeux BR, Adams CE. Regulation of microautophagy and basal protein turnover in rat liver. Effects of short-term starvation. J Biol Chem. 1988;263:2506–12. [PubMed] [Google Scholar]
- 32.Shacka JJ, Klocke BJ, Roth KA. Autophagy, bafilomycin and cell death: the “a-B-cs” of plecomacrolide-induced neuroprotection. Autophagy. 2006;2:228–30. doi: 10.4161/auto.2703. [DOI] [PubMed] [Google Scholar]